HEART-Electrocardiographic Diagnosis of Myocardial Infarction duri
Bạn đang xem bản rút gọn của tài liệu. Xem và tải ngay bản đầy đủ của tài liệu tại đây (1.24 MB, 9 trang )
Cardiol Clin 24 (2006) 377–385
Electrocardiographic Diagnosis of Myocardial
Infarction during Left Bundle Branch Block
S. Serge Barold, MD*, Bengt Herweg, MD
Division of Cardiology, University of South Florida College of Medicine and Tampa General Hospital,
Tampa, FL 33606, USA
The diagnosis of myocardial infarction (MI) in
the presence of left bundle branch block (LBBB)
has long been considered problematic or even
almost impossible. Many proposed ECG markers
in the old literature have now been discarded.
However, the advent of reperfusion therapy has
generated greater interest in the ECG diagnosis of
acute MI (based on ST-segment abnormalities)
[1–4], although criteria for old MI (based on QRS
changes) have not been reevaluated for almost 20
years [5,6]. Furthermore, analysis of the some of
the published data is compounded by the considerable interobserver variability in the interpretation of ECGs [6–8].
Acute myocardial infarction
ST-segment deviation is the only useful electrocardiographic sign for the diagnosis of acute
MI in the presence of LBBB. In uncomplicated
LBBB, ECG leads with a predominantly negative
QRS complex show ST-segment elevation with
positive T waves, a pattern similar to the current
of injury observed during acute myocardial ischemia or MI. Studies of patients with LBBB during
either acute MI [9–11], or occlusion of a coronary
artery by an angioplasty balloon [12,13] have
shown that further ST-segment elevation occurs
in these leads. Electrocardiographic signs involving the QRS complex are not diagnostically useful
in the acute setting.
Sgarbossa and colleagues [1] studied 131 patients (enrolled in the GUSTO-1 trial) with acute
* Corresponding author.
E-mail address: (S.S. Barold).
MI (documented by serum enzyme changes) and
LBBB on their baseline ECG. The following definition of LBBB was used: a QRS duration of at
least 0.125 seconds in the presence of sinus or supraventricular rhythm, a QS or rS complex in lead
V1, and an R-wave peak time of at least 0.06 seconds in lead I, V5, or V6 associated with the absence of a Q or q wave in the same leads.
Patients with ECGs showing intermittent LBBB
were excluded from the study. The control group
consisted of 131 patients randomly selected from
the Duke Databank for Cardiovascular Disease,
who had complete LBBB and stable, angiographically documented coronary artery disease. These
patients did not have acute chest pain at the
time of the recorded ECGs.
The maximal sensitivity with the target specificity (O90%) was achieved in the following
situations: (1) at least one lead exhibiting STsegment elevation R1 mm concordant with (in the
same direction as) a predominantly positive QRS
complex. (2) Discordant ST-segment elevation
5 mm with (in the opposite direction from) a predominantly negative QRS complex. (3) ST-segment depression R1 mm in V1, V2, or V3 (Figs. 1
and 2). Electrocardiographic criteria with statistical significance for the diagnosis of acute MI and
their sensitivities, specificities, and likelihood ratios from the study of Sgarbossa and colleagues
are listed in Table 1. The likelihood ratios indicate
to what extent a particular criterion will increase
or decrease the probability of infarction. The
ECG criterion with the highest likelihood ratio
was ST-segment elevation of at least 1 mm in
leads with a QRS complex in the same direction.
Similarly, the absence of this criterion was associated with the lowest likelihood ratio.
0733-8651/06/$ - see front matter Ó 2006 Elsevier Inc. All rights reserved.
doi:10.1016/j.ccl.2006.05.002
cardiology.theclinics.com
378
BAROLD & HERWEG
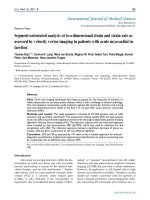
Fig. 1. ECG meeting all three independent criteria of Sgarbossa and colleagues for the diagnosis of acute MI with
LBBB. The ECG shows at least 1-mm concordant ST-elevation in lead II, at least 1-mm ST depression in leads V2
and V3, as well as discordant ST-elevation of at least 5 mm in leads III and aVF (Reproduced from Sgarbossa EB, Pinski
SL, Barbagelata A, et al, for the GUSTO-1 investigators. Electrocardiographic diagnosis of evolving acute myocardial
infarction in the presence of left bundle branch block. N Engl J Med 1996;334:481–7; Ó 1996 Massachusetts Medical
Society. Used with permission.)
With regard to the weakest criterion (STsegment elevation R5 mm discordant with the
QRS), Madias [14,15] warned that this sign may
occur in clinically stable patients with LBBB
without an acute MI (6%) in the presence of
unusually large QRS complexes in V1 to V3 in
which leads the ST-segment elevations are also
large. Such patients frequently have severe left
ventricular hypertrophy or markedly dilated
hearts.
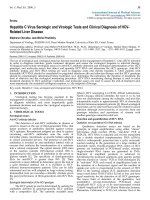
Fig. 2. Acute MI. The ECG shows sinus rhythm, and complete LBBB, and an acute anterolateral MI. There is concordant ST-elevation obvious in lead aVL, and less prominent in lead I. The right precordial leads (V1–V4) show marked
discordant ST-elevation.
379
ECG DIAGNOSIS OF MI DURING LBBB
Table 1
Results of the univariate analysis of the electrocardiographic criteria in the study of Sgarbossa and colleagues [1]
Criterion
ST-segment elevation
R1 mm and concordant
with the QRS complex
ST-segment depression
R1 mm in lead
V1, V2, or V3
ST-segment elevation
R5 mm and discordant
with QRS complex
Positive T wave in lead
V5 or V6
Left-axis deviation
Sensitivity percent
(95% CI)
Specificity percent
(95% CI)
Positive likelihood
ratio (95% CI)
Negative likelihood
ratio (95% CI)
73 (64–80)
92 (86–96)
9.54 (3.1–17.3)
0.3 (0.22–0.39)
25 (18–34)
96 (91–99)
6.58 (2.6–16.1)
0.78 (0.7–0.87)
31 (23–39)
92 (85–96)
3.63 (2.0–6.8)
0.75 (0.67–0.86)
26 (19–34)
92 (86–96)
3.42 (0.18–6.5)
0.8 (0.72–0.9)
72 (63–79)
48 (39–57)
1.38 (1.13–9.8)
0.59 (0.25–1.39)
Abbreviation: CI, confidence interval.
Positive likelihood (LR) ratio: the percentage of acute myocardial infarction (MI) patients positive by a stated ECG
sign for diagnosis divided by the percentage of patients without MI but showing a similar positive ECG sign. LRO1
indicates an increased probability that the target disorder is present, and an LR!1 indicates a decreased probability
that the target disorder is present. A likelihood ratio of 9 means that the criterion in question is nine times as likely
to occur in acute MI as it is in a patient without an MI.
LRỵ ẳ
probability of an individual with acute MI having a positive sign
probability of an individual without acute MI having a positive sign
LRÀ ¼
probability of an individual with acute MI having a negative sign
probability of an individual without acute MI having a negative sign
Reproduced from Sgarbossa EB, Pinski SL, Barbagelata A, et al, for the GUSTO-1 investigators. Electrocardiographic diagnosis of evolving acute myocardial infarction in the presence of left bundle branch block. N Engl J Med
1996;334:481–7. Ó 1996 Massachusetts Medical Society. Used with permission.
Scoring system
Sgarbossa and colleagues [1] developed an algorithm where an ECG is considered positive for
MI if its score is at least three points on the basis
of three criteria: ST-segment elevation of at least 1
mm in the lead with concordant QRS complex–
a score of five points; ST-segment depression of
at least 1 mm in leads V1, V2, or V3da score of
three points; and ST-segment elevation of at least
5 mm in the lead with discordant QRS complexd
a score of two points (Table 2). The scoring system represents the fact that ST-segment elevation
of at least 1 mm that is concordant with the QRS
complex or ST-segment depression of at least 1
mm in lead V1, V2, or V3 is a specific marker of
infarction, even when no other ECG change is observed. On the other hand, the sole presence of
ST-segment elevation of at least 5 mm that is discordant with the QRS complex (with a score of 2)
indicates a moderate-to-high probability of MI,
and further procedures should be undertaken to
confirm the diagnosis. Sgarbossa and colleagues
[1] indicated that their algorithm based on ST-segment changes (index score of at least 3) had a sensitivity of 78% and a specificity of 90% for the
diagnosis of MI in patients with LBBB.
Hirulog and Early Reperfusion or Occlusion
Trial (HERO-2)
The recently reported Hirulog and Early Reperfusion or Occlusion Trial (HERO-2) study [4]
involved 300 patients presenting with O30 min
of ischemic chest discomfort and presumed newonset LBBB according to the criteria of Sgarbossa
and colleagues [1]. Enzymatically confirmed acute
MI occurred in 80.7% of the LBBB patients.
Ninety-two patients exhibited positive ST-segment
380
BAROLD & HERWEG
Table 2
Odds ratios and scores for independent electrocardiographic criteria from Sgarbossa and colleagues [1]
Criterion
Odds ratio (95% CI)
Score
ST-segment elevation R1 mm and
concordant with QRS complex
ST-segment depression R1 mm in
lead V1, V2, or V3
ST-segment elevation R5 mm and
discordant with QRS complex
25.2 (11.6–54.7)
5
6.0 (1.9–19.3)
3
4.3 (1.8–10.6)
2
The odds ratio is a way of comparing whether the probability of a certain event is the same for two groups. An odds
ratio of 1 implies that the event is equally likely in both groups. An odds ratio O1 implies that the event is more likely
in the first group. An odds ratio !1 implies that the event is less likely in the first group. The table shows the ratio
of the odds of having the ECG sign in the acute myocardial infarction group relative to the odds of having the sign
in the control group. (Reproduced from Sgarbossa EB, Pinski SL, Barbagelata A, et al, for the GUSTO-1 investigators.
Electroỵcardiographic diagnosis of evolving acute myocardial infarction in the presence of left bundle branch block.
N Engl J med 1996;334:481–7.)
abnormalities for the diagnosis of acute MI according to the criteria of Sgarbossa and colleagues [1].
The study confirmed the findings of Sgarbossa
and colleagues [1] in terms of the following results
(Table 3): (1) concordant ST-segment elevation
R1 mm: high specificity (98.3%) but low sensitivity
(33.5%). (2) ST-segment depression measuring R1
mm in any of the V1 to V3 leads had similarly high
specificity, but only 14.1% sensitivity. Lowering
the cutoff for ST-segment changes to R0.5 mm
for each of the criteria in 1 and 2 did not improve
sensitivity. When both criteria were combined (ie,
concordant ST-segment elevation or lead V1 to
V3 ST-segment depression), the specificity for detection of enzymatically confirmed acute MI was
96.6%, and the sensitivity was 37.2%. (3) Discordant ST-segment elevation measuring R5 mm
was neither sensitive (29.3%) nor specific (58.6%).
Clinical implications of the Sgarbossa criteria
The clinical utility of the criteria and scoring
system of Sgarbossa and colleagues [1] have been
validated by other studies, all of which have also
demonstrated a high specificity, but some have
shown an even lower sensitivity than the original
data of Sgarbossa and colleagues [1] in terms of
the three individual ST-segment criteria and the
scoring algorithm [8,16–21]. As such, although
the criteria and the algorithm cannot be used to
rule out MI, it can help to rule it in. Patients
with an acute MI and LBBB have a high mortality
rate, but this is significantly related to age and comorbidities [22–24]. Thus, these markers should
be used together with the clinical findings because
the ECG markers alone miss acute MI in many
patients who would benefit from aggressive
Table 3
Application of ST-segment criteria for the diagnosis of AMI in the 300 patients with LBBB at randomization from
Wong and colleagues [4]
Concordant ST-segment
elevation R1 mm
Lead V1 to V3 ST-segment
depression R1 mm
Concordant ST-segment
elevation R1 mm or lead
V1 to V3 ST-segment
depression R1 mm
n
Sensitivity
(%)
Specificity
(%)
Positive predictive
value (%)
Negative predictive
value (%)
82
33.5 (27.6–39.8)
98.3 (89.5–99.9)
98.8 (92.5–99.9)
26.1 (20.6–32.6)
35
14.1 (10.1–19.2)
98.4 (89.5–99.9)
97.1 (83.4–99.9)
21.5 (16.8–27.0)
92
37.2 (31.1–43.6)
96.6 (87.0–99.4)
97.8 (91.6–99.6)
26.9 (21.1–33.6)
Abbreviations: AMI, acute myocardial infarction; LBBB, left bundle branch block. (Reproduced from Wong CK,
French JK, Aylward PE, et al, and the HERO-2 Trial Investigators. Patients with prolonged ischemic chest pain and
presumed-new left bundle branch block have heterogeneous outcomes depending on the presence of ST-segment
changes. J Am Coll cardiol 2005;46:29–38; with permission from American College of Cardiology Foundation.)
ECG DIAGNOSIS OF MI DURING LBBB
381
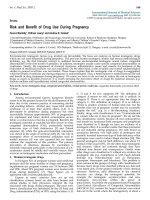
Fig. 3. Anterior MI of undetermined age with double Cabrera’s sign. (A) The ECG shows sinus rhythm, complete
LBBB, and qR complexes in leads I, aVL, and V4. Note the double Cabrera’s sign in lead V4. The presence of sinus
rhythm with a normal PR interval rules out a retrograde P wave as the cause of one of the notches on the ascending
limb of the S wave. (B) Magnified ECG of leads V4 and V5.
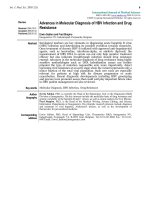
Fig. 4. Anterior MI of undetermined age. The ECG shows sinus rhythm with first-degree block and complete LBBB.
Note the rather tall first deflection in lead V1, which is an R wave. This finding in complete LBBB is very typical of anteroseptal MI of undetermined age. Poor R-wave progression V1 toV6 is also consistent with anterior MI.
382
BAROLD & HERWEG
Fig. 5. ECG pattern of MI after development of complete LBBB. (A) ECG showing sinus rhythm and an extensive acute
anterior MI. (B) ECG 1 month later showing sinus rhythm, new complete LBBB, and many of the signs of anterior MI:
tall initial positive deflection (R wave) in lead V1, Cabrera’s sign in leads V2– V4, q wave in leads 1 and aVL, and poor
r-wave progression in leads V4–V6.
treatment. The published studies showing poor
sensitivity of the ECG markers support the recommendations of the American College of Cardiology and the American Heart Association that
all patients with LBBB irrespective of ECG features and symptoms of acute MI should receive
reperfusion therapy (angioplasty may be preferable to fibrinolytic therapy if there are no contraindications) [25,26].
Old (remote) myocardial infarction
In uncomplicated LBBB, septal activation
occurs from right to left because the left septal
mass cannot be activated via the left bundle.
Consequently, LBBB does not generate a q wave
in the lateral leads (I and V6). Lead V1 may
show an initial r wave because of the anterior
component of right-to-left septal activation but
ECG DIAGNOSIS OF MI DURING LBBB
383
Fig. 6. Possible anterior MI unmasked by ventricular extrasystole during complete LBBB. Leads V2–V5 show ventricular extrasystoles with a qR or Qr comlexes consistent with anterior MI.
leads V1 to V3 may also show QS complexes. After
crossing the ventricular septum, the activation
reaches the left ventricle, which is depolarized
via ordinary myocardium, QS complexes may be
seen in leads III and aVF. Secondary ST segment,
and T-wave abnormalities are oriented in the opposite direction compared with the QRS complex.
The ECG manifestations of the old MI may remain concealed, probably more commonly than
those of acute MI with LBBB [2].
During LBBB, an extensive anteroseptal MI
will alter the initial QRS vector, with forces pointing to the right because of unopposed activation
of the right ventricle. This causes (initial) q waves
in leads I, aVL, V5, and V6, producing an Qr or
qR pattern.
A number of old studies reported that the
presence of a Q wave in lead 1 was a highly specific
and relatively sensitive sign for the diagnosis of
anterior infarction in the presence of complete
LBBB [27,28]. Cabrera and Friedland [29] described the diagnostic value of late notching of
the S wave in leads V3 to V5 (Fig. 3) in anterior infarction in terms of very high sensitivity and
specificity.
With regard to the QRS complex in the diagnosis of MI in LBBB, Wackers [6] also found
that an abnormal Q wave in leads I, aVL, or V6
(duration not stated) may be of diagnostic value
in anteroseptal MI with a sensitivity of 53% and
specificity of 91% (Figs. 4 and 5). A highly specific
criterion (100%) was the combination of an abnormal Q wave in V6 and an increased sharp R
wave in V1. This combination occurred only in patients with an anteroseptal MI, but the sensitivity
was low (20%). Cabrera’s sign (defined as notching of 0.05 sec in duration in the ascending limb
of the S wave in leads V3 or V4) was also useful
with a specificity of 47% for anteroseptal MI
and a specificity of 87% (see Fig. 3). Wackers [6]
also found that a number of other previously proposed QRS signs were disappointing for the diagnosis of MI. Wackers [6] also found that so-called
primary T-wave changes (T wave in the same direction as the QRS complex) carry no important
diagnostic value.
The most recent study involving the QRS
complex was published in 1989 by Hands and
colleagues [5]. They confirmed that Q waves (R30
msec) in two or more lateral leads (I, aVL, V5, and
384
BAROLD & HERWEG
V6) and R-wave regression from V1 to V4 each
had a poor sensitivity (21%) but high specificity
(100%) for the diagnosis of anterior infarction
(see Figs. 3–5). A Q wave of any size in the lateral
leads yielded a sensitivity of 29% and specificity of
91%. Pathologic studies have confirmed the presence of septal infarction in patients with LBBB
and Q waves in the lateral leads (I, aVL, V5,
and V6). Late notching of the upstroke of the S
wave (Cabrera’s sign) in at least two leads V3 to
V5 provided a sensitivity of 29% and specificity
of 91% (see Figs. 3 and 5). Other previously proposed signs of MI involving the QRS complex in
LBBB were found to have poor sensitivity, specificity, and predictive value. The significance of
a tall R wave in lead V1 during LBBB as a sign
of anterior MI was not studied in the report of
Hands and colleagues (see Figs. 4 and 5) [5]. This
may be a rare but very specific sign of MI corresponding to a q wave possibly in leads V7 or V8.
Ventricular extrasystoles
Ventricular extrasystoles may unmask the
pattern of an underlying MI in patients with
LBBB, but this sign is not absolutely specific
[30]. Such ventricular extrasystoles must satisfy
two conditions. (1) The configuration must be either qR or qRs but not QS, because a QS complex
can be generated by an extrasystole originating in
an area underlying the recording electrode. (2)
The qR or qRs complex must be registered in
a lead that would ordinarily be expected to reflect
left ventricular epicardial potentials in the precordial leads (Fig. 6). According to Coumel [31], who
analyzed the significance of QR complexes during
ventricular tachycardia in patients with coronary
artery disease, the QR, qR, or qRs patterns reflect
an MI, although its exact site cannot be determined. Josephson and Miller [32] disagree with
Coumel [31] because they observed qR patterns
in ventricular tachycardia with a LBBB pattern
in patients with cardiomyopathy. They emphasized that a QR complex could originate from
a fixed scar (infarct) or a conduction disturbance
secondary to fibrosis regardless of etiology.
References
[1] Sgarbossa EB, Pinski SL, Barbagelata A, et al, for
the GUSTO-1 investigators. Electrocardiographic
diagnosis of evolving acute myocardial infarction
in the presence of left bundle branch block. New
Engl J Med 1996;334:481–7.
[2] Sgarbossa EB. Recent advances in the electrocardiographic diagnosis of myocardial infarction: left
bundle branch block and pacing. Pacing Clin Electrophysiol 1996;19:1370–9.
[3] Sgarbossa EB. Value of the ECG in suspected acute
myocardial infarction with left bundle branch block.
J Electrocardiol 2000;33(Suppl):87–92.
[4] Wong CK, French JK, Aylward PE, et al, and
HERO-2 Trial Investigators. Patients with prolonged ischemic chest pain and presumed-new left
bundle branch block have heterogeneous outcomes
depending on the presence of ST-segmentchanges.
J Am Coll Cardiol 2005;46:29–38.
[5] Hands ME, Cook EF, Stone PH, et al, and the
MILIS Study Group. Electrocardiographic diagnosis of myocardial infarction in the presence of complete left bundle branch block. Am Heart J 1988;
116:23–32.
[6] Wackers FJ. The diagnosis of myocardial infarction
in the presence of left bundle branch block. Cardiol
Clin 1987;5:393–401.
[7] Wellens HJ. Acute myocardial infarction and left
bundle-branch blockdcan we lift the veil? N Engl
J Med 1996;334:528–9.
[8] Gula LJ, Dick A, Massel D. Diagnosing acute myocardial infarction in the setting of left bundle branch
block: prevalence and observer variability from
a large community setting. Coronary Artery Dis
2003;14:387–93.
[9] Kennamer R, Prinzmetal M. Myocardial infarction
complicated by left bundle branch block. Am Heart
J 1956;51:78–90.
[10] Wackers FJ. Complete left bundle branch block: is
the diagnosis of myocardial infarction possible? Int
J Cardiol 1983;2:521–9.
[11] Sclarovsky S, Sagie A, Strasberg B, et al. Ischemic
blocks during early phase of anterior myocardial infarction: correlation with ST-segment shift. Clin
Cardiol 1988;11:757–62.
[12] Cannon A, Freedman SB, Bailey BP, et al. ST-segment changes during transmural myocardial ischemia in chronic left bundle branch block. Am J
Cardiol 1989;64:1216–7.
[13] Stark KS, Krucoff MW, Schryver B, et al. Quantification of ST-segment changes during coronary angioplasty in patients with left bundle branch block.
Am J Cardiol 1991;67:1219–22.
[14] Madias JE, Sinha A, Ashtiani R, et al. A critique
of the new ST-segment criteria for the diagnosis
of acute myocardial infarction in patients with
left bundle-branch block. Clin Cardiol 2001;24:
652–5.
[15] Madias JE, Sinha A, Agarwal H, et al. ST-segment
elevation in leads V1–V3 in patients with LBBB.
J Electrocardiol 2001;34:87–8.
[16] Li SF, Walden PL, Macrcilla O, et al. Electrocardiographic diagnosis of myocardial infarction in patients with left bundle branch block. Ann Emerg
Med 2000;36:561–5.
ECG DIAGNOSIS OF MI DURING LBBB
[17] Sokolove PE, Sgarbossa EB, Amsterdam EA, et al.
Interobserver variability in the electrocardiographic
diagnosis of acute myocardial infarction in patients
with left bundle branch block. Ann Emerg Med
2000;36:566–71.
[18] Gunnarsson G, Eriksson P, Dellborg M. ECG criteria in diagnosis of acute myocardial infarction in the
presence of left bundle branch block. Int J Cardiol
2001;78:167–74.
[19] Kontos MC, McQueen RH, Jesse RL, et al. Can
myocardial infarction be rapidly identified in Emergency Department patients who have left bundle
branch block? Ann Emerg Med 2001;37:431–8.
[20] Shlipak MG, Lyons WL, Go AS, et al. Should the
electrocardiogram be used to guide therapy for patients with left bundle-branch block and suspected
myocardial infarction? JAMA 1999;281:714–9.
[21] Edhouse JA, Sakr M, Angus J, et al. Suspected myocardial infarction and left bundle branch block: electrocardiographic indicators of acute ischaemia.
J Accid Emerg Med 1999;16:331–5.
[22] Stenestrand U, Tabrizi F, Lindback J, et al.
Comorbidity and myocardial dysfunction are the
main explanations for the higher 1-year mortality
in acute myocardial infarction with left bundlebranch block. Circulation 2004;110(14):1896–902.
[23] Haywood LJ. Left bundle branch block in acute
myocardial infarction: benign or malignant? J Am
Coll Cardiol 2005;46:39–41.
[24] Moreno R, Garcia E, Lopez de Sa E, et al. Implications of left bundle branch block in acute myocardial
infarction treated with primary angioplasty. Am J
Cardiol 2002;90:401–3.
[25] Fibrinolytic Therapy Trialists’ (FTT) Collaborative
Group. Indications for fibrinolytic therapy in
[26]
[27]
[28]
[29]
[30]
[31]
[32]
385
suspected myocardial infarction: collaborative overview of early mortality and major morbidity results
from all randomised trials of more than 1000
patients. Lancet 1994;343:311–22.
Antman EM, Anbe DT, Armstrong PW, et al. ACC/
AHA guidelines for the management of patients
with ST-elevation myocardial infarction; a report
of the American College of Cardiology/American
Heart Association Task Force on Practice Guidelines (Committee to Revise the 1999 Guidelines for
the Management of patients with acute myocardial
infarction). J Am Coll Cardiol 2004;44(3):E1–211.
Besoaı´ n-Santander M, Go´mez-Ebensperguer G.
Electrocardiographic diagnosis of myocardial infarction in cases of complete left bundle branch
block. Am Heart J 1960;60:886–97.
Doucet P, Walsh TJ, Massie E. A vectorcardiographic and electrocardiographic study of left bundle branch block with myocardial infarction. Am J
Cardiol 1966;17:171–9.
Cabrera E, Friedland C. La onda de activacio´n ventricular en el bloqueo de rama izquierda con infarto:
un nuevo signo electrocardiogra´fico. Arch Inst Cardiol Mex 1953;23:441–60.
Dressler W. A case of myocardial infarction masked
by bundle branch block but revealed by occasional
premature ventricular beats. Am J Med Sci 1943;
206:361.
Coumel P. Diagnostic significance of the QRS wave
form in patients with ventricular tachycardia. Cardiol Clin 1987;5:527–40.
Josephson ME, Miller JM. Endocardial and epicardial recordings. Correlation of twelve-lead electrocardiograms at the site of origin of ventricular
tachycardia. Ann N Y Acad Sci 1990;601:128–47.