Báo cáo y học: "Segment-orientated analysis of two-dimensional strain and strain rate as assessed by velocity vector imaging in patients with acute myocardial infarction"
Bạn đang xem bản rút gọn của tài liệu. Xem và tải ngay bản đầy đủ của tài liệu tại đây (788.76 KB, 8 trang )
Int. J. Med. Sci. 2011, 8
106
I
I
n
n
t
t
e
e
r
r
n
n
a
a
t
t
i
i
o
o
n
n
a
a
l
l
J
J
o
o
u
u
r
r
n
n
a
a
l
l
o
o
f
f
M
M
e
e
d
d
i
i
c
c
a
a
l
l
S
S
c
c
i
i
e
e
n
n
c
c
e
e
s
s
2011; 8(2):106-113
© Ivyspring International Publisher. All rights reserved.
Research Paper
Segment-orientated analysis of two-dimensional strain and strain rate as
assessed by velocity vector imaging in patients with acute myocardial in-
farction
Thomas Butz
*
, Corinna N. Lang
*
, Marc van Bracht, Magnus W. Prull, Hakan Yeni, Petra Maagh, Gunnar
Plehn, Axel Meissner, Hans-Joachim Trappe
Department of Cardiology and Angiology, Marienhospital Herne, Ruhr University Bochum, Hoelkeskampring 40, D-44625
Herne, Germany
* Both authors contributed equally to this work
Corresponding author: Thomas Butz, MD, Department of Cardiology and Angiology, Marienhospital Herne,
Ruhr-University Bochum, Hoelkeskampring 40, D-44625 Herne, Germany. Phone: +49 (0)2323 499-0; Fax: +49 (0)2323
499-360; Mail:
Received: 2010.11.14; Accepted: 2011.01.31; Published: 2011.02.01
Abstract
Aims: Strain rate imaging techniques have been proposed for the detection of ischemic or
viable myocardium in coronary artery disease, which is still a challenge in clinical cardiology.
This retrospective comparative study analyzed regional left ventricular function and scaring
with two-dimensional strain (2DS) in the first 4 to 10 days after acute anterior myocardial
infarction (AMI).
Methods and results: The study population consisted of 32 AMI patients with an LAD
occlusion and successful reperfusion. The assessment of peak systolic 2DS and peak systolic
strain rate (SR) was performed segment-oriented with the angle-independent speckle tracking
algorithm Velocity Vector Imaging (VVI). The infarcted, adjacent and non-infarcted segments
were revealed by late enhancement MRI (LE-MRI), which was used as reference for the
comparison with 2DS. The infarcted segments showed a significant decrease of tissue ve-
locities, 2DS and SR in comparison to the non-affected segments.
Conclusion: 2DS and SR as assessed by VVI seem to be a suitable approach for echocar-
diographic quantification of global and regional myocardial function as well as a promising tool
for multimodal risk stratification after anterior AMI.
Key words: Myocardial infarction, Two-dimensional strain, Strain rate imaging, Late Enhancement
MRI
Introduction
After acute myocardial infarction (AMI) the dis-
crimination of avital scar tissue and vital reversible
harmed myocardium is crucial for the optimal indi-
vidual therapy, and for risk stratification
1
. Further
intervention, such as a percutaneous coronary inter-
vention (PCI) or a coronary artery bypass graft
(CABG), is only indicated if the myocardium is
hypokinetic due to insufficient blood supply (“hiber-
nating” or “stunned” myocardium), but still viable.
Until now only late enhancement magnetic resonance
imaging (LE-MRI) has provided a certain distinction.
However, its application is still limited due to high
expense and restricted availability. Therefore, current
studies are mostly concerned with the question if
newly emerged parametric echocardiographic meth-
ods, measuring left ventricular (LV) function and vi-
Int. J. Med. Sci. 2011, 8
107
ability by the deformation indices two-dimensional
strain (2DS) and strain rate (SR), might be an alterna-
tive approach in clinical routine.
Tissue Doppler Imaging (TDI) and 2D Speckle
Tracking (2DST) algorithms facilitate the assessment
of tissue velocities and deformation markers. But only
strain – procentual length alteration relative to a base
length – can distinguish between active and passive
movement. Strain rate records the change of length
per time unit
2-6
.
Previous studies using TDI or 2DST demon-
strated a reduction of the myocardial deformation
indices 2DS and SR in infarcted segments after AMI
7-13
. The goal of our retrospective study – since only
limited data has been obtained thus far – was the
further validation of the 2DST software “Velocity
Vector Imaging” (VVI) for the differentiation between
infarcted and non-infarcted segments as well as, the
correct localization of the infarcted segments in com-
parison to LE-MRI
14-15
.
Methods
Patients with their first AMI and successful
reperfusion of the left anterior descending artery
(LAD) by primary PCI were retrospectively enrolled
in this study.
Inclusion criteria were AMI caused by LAD oc-
clusion (type I, ESC) and coronary artery disease af-
fecting only 1 or 2 vessels. Patients with previous
AMI, with 3 affected coronary arteries, after CABG,
non-ischemic cardiomyopathy or high grade valvular
disease were excluded.
Standard echocardiography and cardiac LE-MRI
were performed 4 to 10 days after AMI. The segments
were categorized by cardiac LE-MRI as follows: in-
farcted (LE 51-100% of wall thickness and LAD terri-
tory), adjacent (either LE 1-50% of wall thickness or no
LE but LAD perfusion territory) and non-infarcted
(LE 0%, no LAD perfusion territory)
9
. The results of
the VVI offline analysis of the tissue velocities (S´, E´,
A´) derived from 2DST and deformation markers
(2DS, 2DSR) were compared intra-individually to the
MRI findings.
The study protocol was approved by the local
ethics committee of the Ruhr-University of Bochum.
Conventional 2D Doppler Echocardiography
In left lateral decubital position the patients un-
derwent transthoracic echocardiography according to
the ASE guidelines
16
on a Sequoia C512 ultrasound
system (Siemens Healthcare, Erlangen, Germany)
equipped with a phased array transducer (frequency
range of 3.75 – 4.25 MHz). ECG-controlled parasternal
long axis, parasternal short axis, apical 4-, 3-, and
2-chamber views of LV walls were obtained in en-
dexspiration. 3 cardiac cycles of each view were digi-
tally stored with the KardioPACS-Software 7.0
(medPACS, Essen, Germany). LV ejection fraction
(LV-EF) was calculated by the modified Simpson´s
method. LA and LV diameter were measured by
M-Mode echocardiography. High grade cardiac val-
vular disease was excluded by Color, PW and CW
Doppler according to current guidelines
16
.
Velocity vector imaging (VVI)
The principle of angle-independent VVI (Sie-
mens, Erlangen, Germany) has been developed from
M-Mode modifications
17
. Using 2D gray scale images
VVI analysis can be carried out in order to measure
tissue velocities (S´, E´, A´), 2DS and SR. We employed
the ASE recommendation of a 17 segments model for
our research to examine MRI and Echo data
18
. The
observer defined the endocardial border manually
and placed regions of interests (ROI) in the middle of
every segment (see Figure 1).
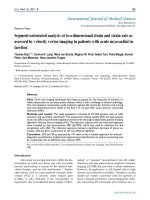
Figure 1: VVI approach to tissue velocities and deformation in the left ventricle (Four chamber view)
Int. J. Med. Sci. 2011, 8
108
The endocardial border and the myocardium
was then automatically tracked frame-by-frame by the
VVI software throughout the cardiac cycle. The VVI
algorithm includes speckle tracking, global motion
coherence, and consistency of periodicity between
cardiac cycles, which are described in detail in the
producers patent (US 6.909.914) and the patent ap-
plication publications (US 2005/0070798, US
2005/0074153)
19-20
.
In our study we focused on the longitudinal ve-
locities and deformation markers because ischemia
especially affects subendocardial fibers first, which
are mainly responsible for longitudinal movement
21
.
Late enhancement magnetic resonance imaging
(LE-MRI)
Using a 1.5-Tesla Magnetom Sonata system
(Siemens, Erlangen, Germany) we scanned the heart
and surrounding structures of 32 patients
ECG-triggered in endexspiration and produced the
standard views of the long and short axes, as well as
the left ventricular outflow tract. With the CMRtools
software (Cardiovascular Imaging Solutions, London,
UK) we calculated volumes as well as the LV-EF of the
left ventricle according to the reference data of Ma-
ceira et al.
22
.
Late gadolinium enhancement images were ac-
quired 10 to 25 minutes after applicating 0.1–0.2
mmol/kg bodyweight Magnevist® (Bayer,
Leverkusen, Germany) with a 2D-segmented, spoilt,
turbo gradient echo sequence (TRUFISP, Siemens,
Erlangen, Germany). This sequence technique devel-
oped by Simonetti et al. allows a detection of myo-
cardial necrosis, scars and fiber tissue (hyperen-
hancement of the myocardium)
30
. The inversion time
was individually adapted.
The segments were labeled in infarcted (LE
51-100% of wall thickness), adjacent (either LE 1-50%
or no LE but LAD perfusion territory) and
non-infarcted (LE 0%, no LAD perfusion territory) as
proposed before
9
.
Statistics
All continuous values were expressed as mean ±
standard deviation after ascertaining a normal dis-
tribution. We performed the unpaired or paired t-tests
and one-way repeated measures analysis of variance
(ANOVA). If the ANOVA test results were significant
we followed up with the post hoc Scheffé procedure.
ROC analysis was performed as previously described
23
. Coefficients of variance were calculated for the
inter- and intra-observer variation. Differences were
considered significant when the p-value was less than
0.05. We used the statistic software SPSS 15.0 (Chica-
go, IL, USA) for all analyses.
Results
Between August 2006 and April 2009, 32 patients
(27 men) with a mean age of 58±12 years (range 38–81
years), who had their first anterior AMI (23 STEMI; 9
NSTEMI) and underwent successful reperfusion of
the LAD by PCI, were enrolled in this study. Suc-
cessful acute revascularization of the infarcted area
was achieved by recanalisation, PCI and Stenting of
the culprit lesion in the infarct-related artery (LAD).
No patient had to underwent CABG. In the 11 pa-
tients with 2 vessel disease a stenosis > 50% was
found in the circumflex artery in 4 patients and in the
right coronary artery in 7 patients. Complete revas-
cularization in the patients with 2-vessel disease was
achieved by serial PCI of the remaining diseased
coronary arteries according to hemodynamic rele-
vance and morphology of the stenosis during the
further clinical course. Basic clinical data are listed in
Table 1.
Table 1: Basic clinical characteristics
Gender (male/female) 27/5
Age (years) 58 ± 12
Height (cm) 1.72 ± 9
Weight (kg) 81 ± 15
BMI (kg/m
2
) 27 ± 4
ECG (STEMI/NSTEMI) 23/9
Echocardiography was performed 7.8±3.6 days
after AMI. With a mean of 49±12 %, the LV-EF was
mildly impaired after the AMI. M-Mode and B-Mode
transthoracic echocardiographic diameters and vol-
umes are displayed in Table 2.
Table 2: Echocardiographic data set
Ejection fraction, EF (%) 49 ± 12
IVSD (cm) 1.1 ± 0.2
HWD (cm) 1.0 ± 0.1
LVDD (cm) 5.2 ± 0.4
LVSD (cm) 3.7 ± 1.2
LV-EDV (ml) 166 ± 46
FS (%) 29 ± 12
LA (cm) 3.8 ± 0.6
RVDD (cm) 2.1 ± 0.7
Aorta(cm) 3.0 ± 0.5
Vector Velocity Imaging (VVI)
In 386 (71%) of 544 segments the analysis by VVI
was feasible. Segments were excluded if the endocar-
Int. J. Med. Sci. 2011, 8
109
dial border was not tracked properly, if the digital
storage of 3 cardiac cycles was not completed, and if
movement of the files was evoked by breathing ex-
cursions of the patient. The mean picture frame rate
(PFR) was 45±16 s
-1
. The average values for the global
longitudinal deformation were: 2DS -11.67 ± 5.38 %;
systolic SR (sSR) -0.65 ± 0.27 s
-1
; early diastolic SR (Sre)
0.60 ± 0.35 s
-1
.
The analysis of tissue velocities demonstrated a
gradient of systolic (S´) and diastolic (early E´ and late
A´) velocities from the apex to the basis of the heart
with significant differences between basal, midven-
tricular and apical myocardium (see Table 3).
Table 3: Tissue velocities (S´, E´, A´) of basal, mid and
apical segments as assessed by VVI
Basal Mid Apical p ANOVA
S´ (cm/s) 3.64 ± 1.63 2.41 ± 1.07 1.06 ± 0.65 p < 0.001
E´ (cm/s) -2.60 ± 1.37 -1.68 ± 0.91 -0.72 ± 0.67 p < 0.001
Comparison of VVI and LE-MRI
MRI was performed 8.1±1.4 days after AMI. The
LE-MRI study resulted in 209 (38%) segments with a
LE ≥ 51%, 91 (17%) with a LE of 1-50% and 244 (45 %)
segments without LE. The categorization labeled 209
segments (38%) as infarcted, 162 (30%) as adjacent and
173 (32%) as non-infarcted.
The comparison of infarcted and non-infarcted
segments showed a significant difference (p < 0.05)
according to 2DS, dSR and tissue velocities, which is
depicted in Table 4 and Figures 2, 3. Infarcted seg-
ments demonstrated significantly decreased 2DS as
well as tissue velocities in comparison to adjacent and
non-infarcted segments.
To investigate infarct transmurality we also
compared the segments with LE ≥ 51%, LE 1-50% and
no LE. We demonstrated significant differences of
2DS, dSR, S´, E´, A´ (p < 0.05) between segments with
LE ≥ 51% and segments with no LE. According to
tissue velocity values we additionally found signifi-
cant differences between segments with LE ≥ 51% and
LE 1-50% (p < 0.05). The data is presented in Table 5.
In a receiver operating characteristic curve
(ROC) analysis VVI-derived mean peak systolic ve-
locity S´ of all infarcted segments in comparison to the
mean peak S´ velocities of the adjacent and
non-infarcted segments predicted infarction (LE ≥
51%) with 80% sensitivity and 70% specificity (area
under the curve, AUC: 0.8, confidence interval
0.77-0.86) for a cut-off value less than 1.95 cm/s (Fig-
ure 4, Table 6).
Figure 2: Significant difference of Strain (A; ANOVA: p <
0.05) and S´ (right) between infarcted, adjacent and
non-infarcted segments (B; ANOVA: p<0.01)
Figure 3: Example of a VVI analysis with markedly reduced
strain (arrow) in septal segments after AMI (four-chamber
view; green and blue ROI representing the mid and apical
septal segments)
Int. J. Med. Sci. 2011, 8
110
Figure 4: ROC analysis for the detection of previous
segmental myocardial infarction by strain, sSR, dSR or S´
after AMI
Table 4: Comparison of deformation and tissue velocities
in AMI according to the categorization of the segments as
infarcted, adjacent and non-infarcted (see methods).
infarcted adjacent non-infarcted p ANOVA
2DS (%) -10.37 ± 4.75 -11.45 ± 4.55 -12.01 ± 5.42 p < 0.05
sSR (s
-1
) -0.62 ± 0.25 -0.68 ± 0.25 -0.66 ± 0.27 n.s.
SRe (s
-1
) 0.53 ± 0.32 0.60 ± 0.34 0.63 ± 0.40 p < 0.05
S´ (cm/s) 1.61 ± 1.27 2.43 ± 1.33 3.10 ± 1.66 p < 0.001
E´ (cm/s) -1.10 ± 0.94 -1.65 ± 1.08 -2.25 ± 1.42 p < 0.001
A´ (cm/s) -1.00 ± 0.84 -1.36 ± 0.96 -1.88 ± 1.19 p < 0.001
Table 5: Comparison of deformation imaging and infarct
transmurality by LE-MRI
No LE LE 1- 50% LE ≥ 51% p ANOVA
2DS (%) -11.87 ± 5.42 -11.73 ±4.28 -10.34 ± 4.76 p < 0.05
sSR (s
-1
) -0.66 ± 0.26 -0.69 ± 0.26 -0.62 ± 0.25 n.s.
SRe (s
-1
) 0.69 ± 0.26 0.58 ± 0.34 0.53 ± 0.32 p < 0.05
S´ (cm/s) 3.01 ± 1.64 2.30 ± 1.25 1.60 ± 1.26 p < 0.001
E´ (cm/s) -2.22 ± 1.40 -1.60 ± 1.03 1.10 ± 0.94 p < 0.001
A´ (cm/s) 1.85 ± 1.17 -1.30 ± 0.93 -0.99 ± 0.84 p < 0.001
Table 6: Receiver operating characteristic (ROC) analysis
for different modalities for the detection of infarcted seg-
ments
cut-off AUC sensitivity specificity
Strain (%) -12.00 0.6 70% 43%
-10.34 0.6 54% 59%
-6.50 0.6 23% 87%
sSR (s
-1
) -0.73
0.54 70% 36%
SRe (s
-1
) 0.34
0.6 80% 20%
S´ (cm/s) 1.95 0.8 80% 70%
For intra-observer variability the same observer
reviewed the echocardiographic images of 20 patients
and repeated VVI measurements several weeks after
the initial measurement. In 8 cases we blinded a se-
cond observer to the first VVI measurements and MRI
data for another review. The results were reported as
correlation coefficients. For intra-observer variability
we found a correlation coefficient of 11%, for in-
ter-observer variability we demonstrated a correlation
coefficient of 17%. A paired t-test did not confirm any
significant difference between the obtained data sets.
Discussion
The main finding of this study is the significant
difference of strain, SRe and tissue velocities between
infarcted and non-infarcted segments demonstrated
by an comparison between 2D Speckle Tracking
(2DST) and late enhancement MRI (LE-MRI).
Deformation imaging after AMI
Our data demonstrated a significant difference
of tissue velocities (S´, E´) between infarcted and
non-infarcted segments assessed by VVI. Mean peak
systolic velocity S´ predicted infarcted segments (LE ≥
51%) in comparison to adjacent and non-infarcted
segments with a sensitivity of 80% and a specificity of
70% (AUC 0.8) with a cut-off value of less than 1.95
cm/s.
Poor agreement between VVI and TDI meas-
urements have been previously demonstrated, and
therefore they are not interchangeable
23,37
. The
measured tissue velocities in the present study are
lower than in previous VVI studies
14,15
, which might