Báo cáo y học: "MALDI-TOF MS Combined With Magnetic Beads for Detecting Serum Protein Biomarkers and Establishment of Boosting Decision Tree Model for Diagnosis of Colorectal Cancer"
Bạn đang xem bản rút gọn của tài liệu. Xem và tải ngay bản đầy đủ của tài liệu tại đây (1.07 MB, 9 trang )
Int. J. Med. Sci. 2011, 8
39
I
I
n
n
t
t
e
e
r
r
n
n
a
a
t
t
i
i
o
o
n
n
a
a
l
l
J
J
o
o
u
u
r
r
n
n
a
a
l
l
o
o
f
f
M
M
e
e
d
d
i
i
c
c
a
a
l
l
S
S
c
c
i
i
e
e
n
n
c
c
e
e
s
s
2011; 8(1):39-47
© Ivyspring International Publisher. All rights reserved.
Research Paper
MALDI-TOF MS Combined With Magnetic Beads for Detecting Serum Protein
Biomarkers and Establishment of Boosting Decision Tree Model for Diag-
nosis of Colorectal Cancer
Chibo Liu
1
, Chunqin Pan
1
, Jianmin Shen
2
, Haibao Wang
3
, Liang Yong
4
1. Department of Clinical Laboratory, Taizhou Municipal Hospital, Taizhou, Zhejiang, 318000, China
2. Department of Radiology, Taizhou Municipal Hospital, Taizhou, Zhejiang, 318000, China
3. Hospital Office, Taizhou Municipal Hospital, Taizhou, Zhejiang, 318000, China
4. Department of Oncology, Taizhou Municipal Hospital, Taizhou, Zhejiang, 318000, China
Corresponding author: Chibo Liu, Department of Clinical Laboratory, Taizhou Municipal Hospital, Taizhou, Zhejiang,
318000, China, Tel.: 86-576-8885-8213, Fax: 86-576-8885-8024, E-mail address: Haibao Wang, Hospital
Office, Taizhou Municipal Hospital, Taizhou, Zhejiang, 318000, China, Tel.: 86-576-8885-8001, Fax: 86-576-8885-8024, E-mail
address:
Received: 2010.09.25; Accepted: 2010.12.20; Published: 2011.01.03
Abstract
The aim of present study is to study the serum protein fingerprint of patients with colorectal
cancer (CRC) and to screen protein molecules that are closely related to colorectal cancer
during the onset and progression of the disease with Matrix-assisted laser desorp-
tion/ionization time-of-flight mass spectrometry (MALDI-TOF MS). Serum samples from 144
patients with CRC and 120 healthy volunteers were adopted in present study. Weak cation
exchange (WCX) magnetic beads and PBSII-C protein chips reader (Ciphergen Biosystems
Ins.) were used. The protein fingerprint expression of all the Serum samples and the resulted
profiles between cancer and normal groups were analyzed with Biomarker Wizard system.
Several proteomic peaks were detected and four potential biomarkers with different ex-
pression profiles were identified with their relative molecular weights of 2870.7Da, 3084Da,
9180.5Da, and 13748.8Da, respectively. Among the four proteins, two proteins with m/z
2870.7 and 3084 were down-regulated, and the other two with m/z 9180.5 and 13748.8 were
up-regulated in serum samples from CRC patients. The present diagnostic model could dis-
tinguish CRC from healthy controls with the sensitivity of 92.85% and the specificity of
91.25%. Blind test data indicated a sensitivity of 86.95% and a specificity of 85%. The result
suggested that MALDI technology could be used to screen critical proteins with differential
expression in the serum of CRC patients. These differentially regulated proteins were con-
sidered as potential biomarkers for the patients with CRC in the serum and of the potential
value for further investigation.
Key words: MALDI; colorectal cancer; Biomarker; Protein; serum
Introduction
Colorectal cancer (CRC) is one leading cause of
cancer death worldwide, with approximately 940 000
new cases and 500 000 deaths reported annually [1].
Colorectal cancer is also the second most common
cancer in Europe [2.3]. Colorectal cancer was regarded
as a multigenic disease and genetic abnormality plays
a critical role in the development and progression of
cancer cells besides the environmental factors [4]. The
Int. J. Med. Sci. 2011, 8
40
five year survival rate for colorectal cancer diagnosed
at early stages
is higher than 90%, while the five year
survival rate for
those diagnosed with widespread
cancer stage is less than 10% [5].
Mortality from CRC
is primarily due to its metastasis to the liver, ac-
counting for over 70% of death cases [6]. Surgical re-
section currently provides the best way of cure.
However, only 20% to 25% of CRC patients are eligi-
ble for surgery treatments, with recurrence rates
range from 40% to 70 % [7, 8].
Early diagnosis of CRC
is therefore of great importance.
Currently the sensitivity of the single biomarker
based CRC diagnosis is low and complicated with a
high probability of ‘false-positives’ cases. Carci-
noembryonic antigen (CEA) is of proved benefits in
prognosis and follow-up, but with limited sensitivity
(30-40%) for early CRC diagnosis [9]. It should be
noted that none of these existed serum markers could
be used individually for screening for CRC with suf-
ficient accuracy [30-34]. Endoscopic examination of
the colon remains to be the gold standard for diagno-
sis, which is however invasive, unpleasant and carries
associated risk of morbidity and mortality. Identifica-
tion of high-risk patients using a less invasive test
would decrease the numbers of such procedures re-
quired. Serial feacal occult blood testing was proved
to be useful but suffers from high false-negative and
false-positive rates [10; 11]. Additionally, stool DNA
analysis for multiple targets showed a sensitivity of
71–91% in preliminary studies and larger studies were
underway currently [12; 13]; however, a serum-based
assay with equivalent sensitivity and specificity
would be more feasible and acceptable to many pa-
tients.
A new method for diagnosing the early stage of
CRC from serum samples is still an urgent need in
clinical practice. In this study, we employed advanced
proteomic approaches- Matrix-assisted laser desorp-
tion/ionization time-of-flight mass spectrometry
(MALDI-TOF-MS) to identify relevant biomarkers
that could replace invasive and nonspecific tests for
the early diagnosis of CRC. This is a relatively new
technique, which is superior to 2D-gel-electrophoresis
in proteomic research because of its high sensitivity
for proteins in low molecular weight range and the
capability for high throughput screening, even for
proteins with extreme characteristics (highly hydro-
phobic, acidic or basic). In this technique, whole se-
rum was applied onto protein chips with different
chromatographic affinities in a suitable binding buf-
fer. Selectively bound proteins were retained on the
surface and non-selectively bound proteins were
washed off. In the mass spectrometer, a laser de-
sorbed the bound proteins from the chip surface,
which were subsequently detected in the TOF ana-
lyzer by their respective mass-to-charge ratios (m/z)
[35, 36]. As whole patterns of proteins in the serum
samples were analyzed, more than one biomarker
would be detected. Combination of several biomark-
ers for the evaluation of a patient’s status could lead
to enhanced sensitivity and specificity [37, 38, 39, 40,
41].
In present study, we aimed to search differen-
tially expressed proteins as potential biomarkers in
colorectal cancer patients by MALDI-TOF MS. We
used WCX magnetic beads to screen potential serum
biomarkers for colorectal cancer detection. A total of
264 serum samples from colorectal cancer patients
and healthy volunteers was collected and analyzed. A
panel of differentially expressed proteins was advo-
cated for biomarkers of diagnosis for colorectal can-
cer.
Materials and methods
Patients
Experiment was performed in Taizhou Munici-
pal Hospital, Zhejiang, China in April 2010. Samples
used were collected from 144 patients diagnosed with
CRC (ages ranging from 37-76) and 120 controls
(healthy volunteers, ages ranging from 33-68) at
Taizhou Municipal Hospital and The First Affiliated
Hospital of Medical College, Zhejiang University. All
CRC patients were diagnosed according to combined
clinical criteria, including Endoscopic examination of
the colon, a combination of computed tomography
(CT), positron emission tomography (PET), or both,
and further confirmed by histopathological analysis
(Table 1). The studies were approved by the local
Ethics Committee of Taizhou Municipal Hospital, and
had the informed consent of the patients and volun-
teers. The patients and serum samples were then di-
vided into two groups: the ‘‘training’’ set and the
blinded ‘‘test’’ set (Table 2).The blood samples were
collected in 5 ml BD Vacutainers without anticoagu-
lation and allowed to clot at room temperature for up
to 1 hr; the samples were then centrifuged at 4℃ for 5
min at 10000 rpm. The sera were frozen and stored at
-80℃ for future analysis.
Table 1 Clinical Tumor-Node-Metastasis Stages of 144
patients with CRC
Stage No. of patients (Training
set)
No. of patients (blind
set)
DUKES A 18 10
DUKES B 44 22
DUKES C 15 8
DUKES D 21 6
Total 98 46
Int. J. Med. Sci. 2011, 8
41
Table 2 Serum samples used in training and testing sets
Samples Training set blind set Total
Colorectal cancer 98 46 144
Healthy volunteers 80 40 120
Total 178 86 264
WCX magnetic beads analysis
Sample pretreatments and proteomic analysis in
the proteomic profiling analysis, the serum samples
from the diseased and control groups were rando-
mized, and blinded to investigators. Serum samples
were pretreated with weak cation exchange (WCX)
magnetic beads (SED
TM
) (Beijing SED Science &
Technology, Inc.). 10 μl of each serum sample was
mixed with 20 μl of U9 solution (9 mol/L urea, 2%
CHAPS, pH 9.0) in a 0.5 ml centrifuge-tube and in-
cubated for 30 min at 4℃. Denatured serum samples
were diluted with 370 μl binding buffer (50 mmol/L
sodium acetate, 0.1% Triton X-100, pH 4.0). At the
same time, 50 μl of WCX magnetic beads were placed
in a PCR-tube and the tube was placed in a magnet
separator for 1 min, after which the supernatant was
discarded carefully by using a pipette. The magnetic
beads were then washed twice with 100 μl binding
buffer. Then 100 μl of the diluted serum sample was
added to the activated magnetic beads, mixed and
incubated for 1 h at 4℃, after which the beads were
washed twice with 100 μl binding buffer.
MALDI-TOF MS
Following binding and washing, the bound
proteins were eluted from the magnetic beads using
10 μl of 0.5% trifluoroacetic acid. Then, 5 μl of the
eluted sample was diluted 1:2 fold in 5 μl of SPA (sa-
turated solution of sinapinic acid in 50% acetonitrile
with 0.5% trifluoroacetic acid). Two microliters of the
resulting mixture was aspirated and spotted onto the
gold-coated ProteinChip array. After air-drying for 5
minutes at room temperature, protein crystals on the
chip were scanned with the ProteinChip (Model PBS
IIc) reader (Ciphergen) to determine the masses and
intensities of all peaks over the range m/z 1,000 to
50,000. The reader was set up as follows: mass range
(1,000 to 50,000 Daltons), optimized mass range (1,000
to 20,000 Daltons), laser intensity (200), and sensitivity
(9). Mass calibration was performed using an
all-in-one peptide reference standard which contained
vasopressin (1084.2Da), somatostatin (1637.9Da), bo-
vine insulin β chain (3495.9 Da), human insulin re-
combinant (5807.6Da), hirudin (7033.6Da) (Ciphergen
Biosystems, Fremont, CA, USA). The default back-
ground subtraction was applied, and the peak inten-
sities were normalized using the total ion current
from a mass charge of 1000 to 50,000Da. A biomarker
detection software package (Ciphergen Biomarker
Wizards, Ciphergen Biosystems, Inc) was used to
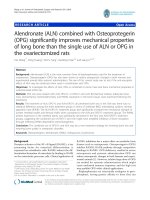
detect protein peaks (Figure 1).
Figure 1. Spectra illustrating reproducibility of 4 separate analyses from the healthy controls of blood type O. It should be
noted that the results were replicable and showed same protein peaks.
Int. J. Med. Sci. 2011, 8
42
Protein peaks were selected based on a first pass
of signal-noise ratio of 3 and a minimum peak thre-
shold of 20% of all spectra. This process was com-
pleted with a second pass of peak selection at 0.2% of
the mass window, and the estimated peaks were
added. These selected protein peaks were averaged as
clusters and were exported to a commercially availa-
ble software package (Biomarker Patterns, Ciphergen
Biosystems, Fremont, CA, USA) for further classifica-
tion analysis.
Detection and Statistical Data Analysis
The data were analyzed by Ciphergen's Pro-
teinChip Software (version 3.1). When the differen-
tiated expressions of protein mass peak were found
between the groups of colorectal cancer and healthy
controls, these data in the Excel format were imported
into the Biomarker Pattern Software (BPS) to construct
the classification tree of CRC. The significantly dif-
ferent expression of protein mass peaks (P < 0.01) was
listed by the software. Subsequently, the differen-
tiated expressions of protein mass peak were ana-
lyzed by discriminatory analysis. Briefly, the dataset
formed a "root node". The software tried to find the
best peak to separate this dataset into two "child
nodes" based on peak intensity. To achieve this, the
software would identify the best peak and set a peak
intensity threshold. If the peak intensity of a blind
sample was lower than or equal to the threshold, this
peak would go to the left-side child node. Otherwise,
the peak would go to the right-side child node. After
rounds of decision making, the training set was found
to be discriminatory with the least error.
All the results were expressed as mean±S.D.,
and P values < 0.01 were considered statistically sig-
nificant. Sensitivity was calculated as the ratio of the
number of correctly classified diseased samples to the
total number of diseased samples. Specificity was
calculated as the ratio of the number of negative
samples correctly classified to the total number of true
negative samples.
Results
Detection of the Protein Peaks
Proteomic data from the samples of the training
set (consisting of 98 CRC and 80 controls) were ana-
lyzed with Biomarker Wizard software 3.1. Up to 252
protein peaks per spot were detected between m/z
1000 and m/z 50000 and this proved the effectiveness
of the MALDI technology in separated detection of
low molecular weight proteins (<2 0000) (Figure 2, 3).
Additionally, we compared the spectrums from pa-
tients in different stages of CRC to evaluate the con-
sistency of these biomarkers in early diagnosis. Inte-
restingly we found that in serum from early stage
patients at DUKES A showed two more m/z peaks at
6111 and 7978, which would diminish in serum sam-
ples from later stage patients (B, C, D) (Figure 4).
Protein Fingerprint Analysis of Serum Samples
in Patients with CRC and Healthy Controls
The protein profile of the serum samples from
the 98 patients with CRC and the 80 healthy controls
were extracted by magnetic beads and examined by
MALDI-TOF-MS. The data were analyzed by Bio-
marker Wizard Version 3.1; 68 m/z peaks were found
to discriminate the patients with CRC and healthy
controls (Table 3). We were able to simultaneously
analyze the protein profiles of 90 serum samples from
both CRC patients and healthy volunteers. We identi-
fied several biomarkers specific for CRC (Figure 2, 3).
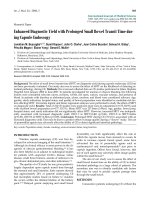
Figure 2. Representative protein spectrum of 2 separate analyses from CRC patient and control by MALDI-TOF MS
combined with WCX magnetic beads, showing the protein m/z between 1000 and 20000. The figure showed some different
peaks on the spectrum.
Int. J. Med. Sci. 2011, 8
43
Figure 3. Differential expression of MALDI peak m/z 2870.7, 3084, 9180.5, 13748.8 in CRC and control sera. Each peak
were represented by three control and three patient samples. The arrow indicated the peak difference.
Figure 4. The representative m/z peaks at 6111 and 7978 in different stage CRC patients with DUKES A and Patients with
DUKES B DUKES C and DUKES D. This data suggested that in different stages of CRC patients, there could be differential
regulation of biomarkers, and some of them could diminish in late stages.
Four peaks, m/z 2870.7Da, 3084Da, 9180.5Da,
13748.8Da were then chosen to set up the decision tree
[24-25] (Figure 5). At Node l, samples of m/z 9180.5
with peak intensities lower than or equal to 6.28 went
to terminal Node 1, which had 45 healthy volunteer.
Otherwise, samples entered Node 2, which had 35
healthy volunteers and 98 CRC samples. At Node 2,
samples of m/z 3084 with peak intensities lower than
or equal to 1.89 went to Node 3, which had 10 healthy
volunteers and 80 CRC samples. The other samples
entered terminal Node 4, which had 18 CRC samples
and 25 healthy volunteers. At Node 3, samples of m/z