Báo cáo y học: "Comparative study of control selection in a national population -based case-control study: Estimating risk of smoking on cancer deaths in Chinese men"
Bạn đang xem bản rút gọn của tài liệu. Xem và tải ngay bản đầy đủ của tài liệu tại đây (648.24 KB, 9 trang )
Int. J. Med. Sci. 2009, 6
329
I
I
n
n
t
t
e
e
r
r
n
n
a
a
t
t
i
i
o
o
n
n
a
a
l
l
J
J
o
o
u
u
r
r
n
n
a
a
l
l
o
o
f
f
M
M
e
e
d
d
i
i
c
c
a
a
l
l
S
S
c
c
i
i
e
e
n
n
c
c
e
e
s
s
2009; 6(6):329-337
© Ivyspring International Publisher. All rights reserved
Research Paper
Comparative study of control selection in a national population -based
case-control study: Estimating risk of smoking on cancer deaths in Chinese
men
Jingmei Jiang
1
, Boqi Liu
2
, Philip C. Nasca
3
, Wei Han
1
, Xiaonong Zou
2
, Xianjia Zeng
1
, Xiaobing Tian
1
,
Yanping Wu
2
, Ping Zhao
2
, Junyao Li
2
1. Department of Epidemiology and Medical Statistics, Peking Union Medical College
2. Department of Epidemiology, National Cancer Institute, Chinese Academy of Medical Sciences
3. Department of Epidemiology and Biostatistics, SUNY, Albany, the USA
Correspondence to: Professor Boqi Liu, 17 Pan Jia Yuan Nan Li, Beijing (100021), National Cancer Institute, Chinese
Academy of Medical Sciences, China. Tel: 86-10-87788441; Fax: 86-10-85370653; E- mail address:
Rec
eived: 2009.08.04; Accepted: 2009.10.20; Published: 2009.10.28
Abstract
Purpose: To assess the validation of a novel control selection design by comparing the
consistency between the new design and a routine design in a large case-control study that
was incorporated into a nationwide mortality survey in China.
Methods: A nationwide mortality study was conducted during 1989–1991. Surviving
spouses or other relatives of all adults who died during 1986–1988 provided detailed infor-
mation about their own as well as the deceased person’s smoking history. In this study,
130,079 males who died of various smoking-related cancers at age 35 or over were taken as
cases, while 103,248 male surviving spouses (same age range with cases) of women who died
during the same period and 49,331 males who died from causes other than those related to
smoking were used as control group 1 and control group 2, respectively. Consistency in the
results when comparing cases with each of the control groups was assessed.
Results: Consistency in the results was observed in the analyses using different control
groups although cancer deaths varied with region and age. Equivalence could be ascertained
using a 15% criterion in most cancer deaths which had high death rates in urban areas, but
they were uncertain for most cancers in rural areas irrespective of whether the hypothesis
testing showed significant differences or not.
Conclusions: Sex-matched living spouse control design as an alternative control selection
for a case-control study is valid and feasible, and the basic principles of the equivalence study
are also supported by epidemiological survey data.
Key words: case-control studies; epidemiologic methods; comparative study; smoking; Chinese
men.
Introduction
One of the most important measures for ascer-
taining the impact of tobacco on a population is the
estimation of the mortality attributable to its use. To
measure this, a number of indirect methods of quan-
tification are available.
1-5
However, although different
methodologies are widely used, their methodological
foundations are all quite similar. Mainly they are
based on the calculation of the proportional attribut-
able fraction. Thus, one of the limitations of the esti-
mation remained, because the proportional mortality
Int. J. Med. Sci. 2009, 6
330
analysis cannot estimate mortality from the causes of
death similar to those in the reference group. To im-
prove the existing calculations, a novel control group
design was introduced in a previous study,
6
which
replaced the regular reference group by using the
same sex surviving spouses of deceased people to
calculate the mortality risk rate. However, one ques-
tion has been raised simultaneously, is it accurate and
validation?
Although most clinical study activities are aimed
at showing that equivalence can also be claimed for
generic versions of innovator drugs and for such di-
verse entities as medical protocols, surgical tech-
niques and medical devices,
7-10
there are no such
standard criteria for how to evaluate and support
such equivalence claim in epidemiological survey
data although many reports,
11-13
for example, sug-
gested that several well-designed valid case-control
studies with consistent results should be helpful in
policy making when an answer is needed a short time.
The purpose of this study was to apply the basic
principles of a population-based case-control study to
assess the validation of the novel control selection
design by comparing the consistency between the
new design and a routine control selection design in a
large case-control study that was incorporated into a
nationwide mortality survey in China in 1989–1991.
As an example, we assessed the hazards of tobacco
use on smoking-related cancer deaths in Chinese
adult men. We also offer specific suggestions that we
believe are useful in choosing controls within the
framework of the study principles.
SUBJECTS AND METHODS
National Mortality Survey and Case-Control
Study Design
In 1989–1991, a large nationwide retrospective
mortality survey was conducted in China, which in-
volved 103 study areas (24 major cities and 79 coun-
ties) and approximately 1,000,000 adult deaths from
all causes during the years 1986–1988.
1
We defined the
total population (close to 67 million) from which the
mortality survey was conducted as the study base.
Cases and two groups of controls were obtained
within the study base: 130,079 males who died of
smoking-related cancers at age 35 or over were de-
fined as cases. These diseases included: malignant
neoplasm of the lips, oral cavity, and larynx ((ICD-9:
140–149, 161, 3.9%), esophageal cancer (150, 15.2%),
stomach cancer (151, 25.9%), liver cancer (155, 22.7%),
lung cancer (162, 27.2%), pancreatic cancer (157, 2.6%),
prostate cancer (185, 0.7%), and bladder cancer (188,
1.8%)). We combined the cancers of ICD-9 Codes
(140–149,161) into one group named “minor site can-
cers” because the death rates for these cancers were
too low for separate analysis. Two different control
groups were selected. The first group was recruited
using the novel design, which comprised all male
surviving spouses (same age range with cases) of any
women who died (any cause of death) during those
same years. The second control group was chosen
using the proportional mortality method and com-
prised all men aged 35 or over who died from causes
other than those related to smoking. These diseases
included: infectious and parasitic diseases (ICD-9:
001–009, 020–139, 7.8%), endocrine, metabolic, im-
mune diseases (240–279, 5.6%), blood and
blood-forming organ diseases (280–289, 0.9%), mental
disorders (290–319, 3.3%), nervous system diseases
(320–359, 3.1%), digestive system diseases (520–579,
27.5%), genitourinary system diseases (580–608,
10.0%), musculoskeletal and connective tissue dis-
eases (710–739, 0.9%), injury and poisoning (800–897,
33.1%), and other medical disorders (360–389,
680–709, 780–796, 7.9%). The selection of controls in
this study was based on three assumptions: (1) the
individuals in both control groups had, in 1980,
smoking habits that were similar to those of the study
base; (2) there was no significant relationship between
husband and wife in control group 1 in terms of to-
bacco use; (3) the causes of death in control group 2
were unrelated to tobacco exposure. Thus two sepa-
rate population-based case-control studies were
formed within the study base with one group of cases
and two different control groups.
The information on smoking history was ob-
tained by interviews. We interviewed informants
(spouses or other relatives) of all deceased persons
who described their own smoking habits as well as
those of their dead partners. These data were used to
determine whether people had ever smoked before
1980, a period of time prior to the onset of their dis-
ease. A non-smoker was defined as a person who had
never smoked during his life or had only smoked in-
frequently at a young age.
Statistical Methods
The relative risk (RR) for cancer deaths in smok-
ers and non-smokers was estimated by
non-conditional logistic regression, adjusted for age
(5-year age groups) and the area of the residence.
Confidence intervals (CIs) were used in this
study, as in clinical trials,
7–10
to evaluate the equiva-
lence of the two case-control studies in assessing the
risk of cancer deaths due to smoking. We first defined
a range of equivalence as an interval from -δ to δ
(here, we defined δ=0.15). We then simply checked
Int. J. Med. Sci. 2009, 6
331
whether the CI centered on the observed ratio of
2
1
ˆ
ˆ
RR
RR
(the procedure of calculating CI is listed in
Appendix) lay entirely between e
-δ
to e
+δ
. If it did,
equivalence was demonstrated; if it did not, there was
uncertainty regarding equivalence. Because
δ
δ
+≅ 1e
(when δ≤ 0.15), for convenience, the range
of equivalence was replaced by (1 - δ, 1 + δ). Thus the
limits for equivalence in this study were within 0.85
and 1.15.
RESULTS
There were a total of 130,079 cases and 152,579
controls (103,248 in control group 1; 49,331 in control
group 2) in our study. The basic characteristics of the
cases and controls, and relative risk of smok-
ing-related cancer deaths among smokers by com-
parison cases with each of the two control groups are
shown in Table 1. Although data show that the rela-
tive risk from smoking was greater for urban males
than rural males, both study groups revealed a con-
sistent pattern of the effect of smoking on risk of can-
cer deaths.
TABLE 1. Characteristics of cases and two control groups:
Population-based case-control study of smoking on risk of
cancer deaths among Chinese men 1989–1991.
Controls Characteristic Cases
Control
group 1
Control
group 2
No. of subjects 130,079 103,248 49,331
Mean age (years) 63.3 ± 10.7
†
62.4 ± 11.6 61.0 ± 13.8
% urban 69.2 69.1 24.6
% rural 30.8 30.9 75.4
% smokers (Total) 70.7 59.2 63.4
n, % smokers (Ur-
ban)
90,061 (70.1) 71,316
(57.1)
12,147 (58.4)
n, % smokers (Ru-
ral)
40,018 (71.9) 31,932
(64.1)
37,184 (65.1)
Relative Risk (95%CI)
‡
for smoking
with cases and different controls
Urban 1.77 (1.73–1.81) 1.71 (1.65–1.78)
Rural 1.44 (1.41-1.49) 1.37 (1.33–1.45)
% of deaths attributed to smoking
Urban 30.5% 29.1%
Rural 21.9% 19.4%
†
One standard deviation
‡
95% confidence interval
Overall, 35.6% of the cancer cases (38.5% urban,
28.9% rural) were confirmed by pathology, 56.3%
(55.8% urban, 57.5% rural) were diagnosed by X-ray
or by CT scan, and 8.1% (5.7% urban, 13.5% rural)
were diagnosed by clinical experience or by other
methods. The other methods group included patients
who could not afford to go to hospital, and when the
families of these individuals were interviewed, a
qualified physician provided a diagnosis based on the
patient’s symptoms.
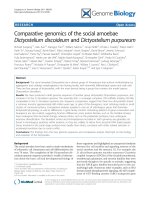
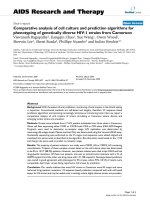
The adjusted cancer RRs and their CIs had a high
degree of overlap (with a small standard error) be-
tween the two control groups in deaths from
esophagus cancer, stomach cancer, liver cancer, and
lung cancer (Figure 1) which had high incidence rates
although the death rates from these cancers varied by
region and age (data not shown). When data were
combined to calculate the risk for all men, the RR
(95%CI) with control groups one and two, respec-
tively, were: 1.96 (1.84–2.08) and 1.88 (1.79–1.97) for
esophagus cancer; 1.29 (1.23–1.35) and 1.28 (1.24–1.34)
for stomach cancer; 1.35 (1.31–1.39) and 1.33
(1.27–1.39) for liver cancer, 2.98 (2.88–3.08) and 2.95
(2.81–3.09) for lung cancer. However, for other neo-
plasms which had low rates, the discrepancies in CIs
were increased because of a large standard error, and
this was particularly true for rural residents.
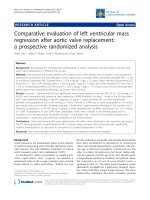
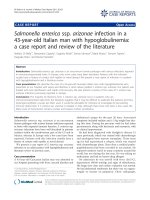
The relative risks for cancer deaths between the
two groups were also examined in subgroups ac-
cording to smoking history (Figure 2-3). The result
revealed a high consistency with both control groups
in most subgroups. In particular, with smokers in
both urban and rural areas, whose most recent habits
involved only cigarettes, significant dose-response
relationships were found both in the duration of the
smoking habit and in daily cigarette consumption. For
example, in urban men, the RR (95%CI) for daily
cigarette consumption <10, 10–19, ≥20 cigarettes per
day, respectively were: study group 1: 1.40 (1.34–1.45),
1.48 (1.44–1.52), and 2.25 (2.19–2.32); study group 2:
1.38 (1.29-1.49), 1.42 (1.35–1.50), and 2.12 (2.01–2.22).
The absolute differences between the two groups in
RRs ranged from 0.02 to 0.13. Furthermore, the RR
(95%CI) for those who smoked ≥20 cigarettes each day
and had been smoking of for <20, 20–34, and 35+
years, respectively, were: group 1: 1.73 (1.65–1.82),
2.26 (2.16–2.36) and 2.53 (2.45–2.62); group 2: 0.98
(0.90–1.06), 1.94 (1.78-2.12) and 3.06 (2.85–3.28). The
absolute differences in RRs ranged from 0.32 to 0.75,
respectively (all trends test, P < 0.001). There was a
similar trend in rural men, although the RRs were
smaller than in urban men.
The equivalence tests with a predefined interval
(0.85-1.15) for various cancer deaths were shown in
Figure 4, and the importance of not basing conclu-
sions on statistical significance can also be seen in this
Figure. Any CI which does not overlap 1.0 corre-
sponds to a statistically significant difference between
the two control groups. In the data shown for urban
males, the two estimates could be considered to have
Int. J. Med. Sci. 2009, 6
332
equivalence in esophagus cancer, stomach cancer,
liver cancer, pancreas cancer, lung cancer cancers, and
cancers on the minor sites, whereas the equivalence is
uncertain for bladder cancer and prostate cancer al-
though all showed no statistically significant differ-
ence between compared groups. For rural males, no
equivalence could be ascertained (except for liver
cancer deaths) irrespective of whether the hypothesis
testing showing significant differences or not. Fur-
thermore, when we combined all cancers to test
equivalence again, the results revealed equivalence in
the two control groups for both urban and rural
males, with no statistically significant difference in
total cancer deaths between the compared groups.
FIGURE 1.
Smoker vs. non-smoker cancer death RR ratios in various cancer sites in males ages 35 and over, 1986–1988
in urban and rural areas.
†
RR1 and RR2 denote relative risks calculated with study group1 and study group 2, respectively.
Int. J. Med. Sci. 2009, 6
333
FIGURE 2.
Proportion of smoking by different smoking histories and relative risk for smoker vs. non-smoker cancer death
in various subgroups. Urban males ages 35 and over, 1986–1988 in China.
†
RR1 and RR2 denote relative risks calculated
with study group1 and study group 2, respectively.
FIGURE 3.
Proportion of smoking by different smoking histories and relative risk for smoker vs. non-smoker cancer death
in various subgroups. Rural males ages 35 and over, 1986–1988 in China.