Báo cáo y học: "Line bisection performance in patients with generalized anxiety disorder and treatment-resistant depressionLine bisection performance in patients with generalized anxiety disorder and treatment-resistant depression"
Bạn đang xem bản rút gọn của tài liệu. Xem và tải ngay bản đầy đủ của tài liệu tại đây (281.35 KB, 8 trang )
Int. J. Med. Sci. 2010, 7
224
I
I
n
n
t
t
e
e
r
r
n
n
a
a
t
t
i
i
o
o
n
n
a
a
l
l
J
J
o
o
u
u
r
r
n
n
a
a
l
l
o
o
f
f
M
M
e
e
d
d
i
i
c
c
a
a
l
l
S
S
c
c
i
i
e
e
n
n
c
c
e
e
s
s
2010; 7(4):224-231
© Ivyspring International Publisher. All rights reserved
Research Paper
Line bisection performance in patients with generalized anxiety disorder
and treatment-resistant depression
Wei HE
1,2
, Hao CHAI
1,2
, Yingchun ZHANG
1
, Shaohua YU
2,3
, Wei CHEN
1
, and Wei WANG
1,2
1. Department of Psychiatry, Sir Run Run Shaw Hospital, Zhejiang University School of Medicine, Hangzhou, China;
2. Department of Clinical Psychology and Psychiatry, Zhejiang University School of Medicine, Hangzhou, China;
3. Department of Psychiatry, Second Hospital, Zhejiang University School of Medicine, Hangzhou, China
Corresponding author: Dr. Wei WANG, B.Med., D.Sc.; Department of Clinical Psychology and Psychiatry; Zhejiang
University School of Medicine; Yuhangtang Road 388; Hangzhou, Zhejiang 310058, China; Tel: +86-571-88208188. Email:
or
Received: 2010.04.06; Accepted: 2010.06.29; Published: 2010.07.02
Abstract
Background and Objectives The line bisection error to the left of the true center has been
interpreted as a relative right hemisphere activation, which might relate to the subject’s
emotional state. Considering that patients with generalized anxiety disorder (GAD) or
treatment-resistant depression (TRD) often have negative emotions, we hypothesized that
these patients would bisect lines significantly leftward. Methods We tried the line bisection
task in the right-handed healthy volunteers (n = 56), GAD (n = 47) and TRD outpatients (n =
52). Subjects also completed the Zuckerman – Kuhlman Personality Questionnaire, the
Zuckerman Sensation Seeking Scales, and the Plutchik-van Praag Depression Inventory.
Results GAD patients scored highest on the Neuroticism-Anxiety trait, TRD patients scored
highest on depression, and both patients scored lower on the Sociability trait. Patients with
GAD also bisected lines significantly leftward compared to the healthy subjects. The Fre-
quency of the bisection error was negatively correlated with Disinhibition-Seeking in the
healthy subjects, and with Total sensation-seeking and Experience-Seeking in GAD patients,
while the Magnitude of the line bisection error was negatively correlated with depression in
TRD patients. Conclusions The study suggests a stronger right hemispheric activation, a
weaker left activation, or both in the GAD, instead of TRD patients.
Key words: Generalized Anxiety Disorder; hemispheric activation; line bisection; treat-
ment-resistant depression
Introduction
The functional asymmetry of the cerebral he-
mispheres has been reported in patients with many
sorts of brain damage, who failed to orient, report, or
respond to stimuli located in one hemispace
1
. This
phenomenon is called visuospatial neglect
2
. Line
bisection has been employed as a sensitive test for
unilateral neglect
1,3
. In this task, lateral deviation
from the true center indicate the relative inattention
for the contralateral side of space, and a consistent
leftward error has been reported in healthy subjects in
the Western world, indicating a relatively right cere-
bral dominance in them (reviewed in Ref
4
). None-
theless, patients with right hemispheric lesions
usually place the subjective midpoint to the right of
the true center
4
.
Of interest to psychologists and psychiatrists are
the possible functional cerebral asymmetries
represented in sorts of psychiatric patients and in
different emotional states of healthy individuals,
which might be due to the different strategies for
Int. J. Med. Sci. 2010, 7
225
processing specific stimuli. In healthy subjects, nega-
tive emotions are more likely to be associated with the
activation of the right hemisphere
5,6
. For instance,
some studies have shown that the induced anxiety in
normal subjects selectively impaired their spatial, but
not verbal performance
7,8
, other studies in both in-
fants and adults have found that negative affects, such
as anxiousness and depression, are more relatively
associated with the right hemisphere activation, par-
ticularly the frontal lobe
6,9-11
. Moreover, the greater
right hemisphere activation in depression patients has
been demonstrated in studies that used the conso-
nant-vowel task
12
, and the electroencephalogram
measurements
13,14
.
Individuals with generalized anxiety disorder
(GAD) are found to be intolerant of uncertainty and
perceive more potentially negative situations than the
healthy subjects
15-17
, and people with depression also
employ a maladaptive problem-solving method,
which contributes to the maintenance of negative
emotions they perceived
18,19
. One question therefore
arises how patients with GAD, or with the treat-
ment-resistant depression (TRD), a severe form of
depression, would perform in the line bisection task.
The possible answers might help us to understand
better the hemispheric functions that contribute to
these pathologies on the one hand, and probably help
to further address the overlaps between anxiety and
depression on the other.
Bearing that GAD and TRD patients often
present negative emotions in mind, we have hy-
pothesized that these subjects would bisect lines fur-
ther leftward than the healthy volunteers would. In
addition, given the high prevalence of anxie-
ty/depression in the general population, it might be
interesting to compare the levels of anxie-
ty/depression between our patients and healthy sub-
jects. Thus, we used the Zuckerman-Kuhlman Per-
sonality Questionnaire
20
to measure the subject’s an-
xiety trait, and the Plutchik – van Praag Depressive
Inventory
21
to measure their depressive mood.
Moreover, since the sensation seeking trait is corre-
lated with a hemispheric asymmetry
22,23
, the Zuck-
erman Sensation Seeking Scales
24
were also used in
the present protocol.
Materials and Methods
Subjects
Considering that most Chinese people are
trained to use their right hands as artful ones in their
early lives
25
, studies of such training in athletes
showed consistently moderate rightward errors in the
line bisection task
26,27
, we therefore selected 155
moderate to strong right-handed subjects for our
study. Fifty-six healthy volunteers were recruited
among college students, medical staff members or
paid volunteers. After a semistructured interview, it
was determined that they were not suffering from any
kinds of anxiety or depressive disorder. Forty-seven
outpatients were diagnosed with GAD according to
the criteria of the Diagnostic and Statistical Manual of
Mental Disorders - Version IV – Text Revision
28
. Fif-
ty-two outpatients were diagnosed with TRD using
following criteria (all the four criteria were met): (1)
symptoms met criteria for major depressive disorder
28
; (2) remission failed after using at least two antide-
pressants; (3) patients scored more than 25 on the
Plutchik – van Praag Depression Inventory; (4) pa-
tients were without comorbidities of psychotic dis-
eases or drug abuse. In addition, patients were as-
certained not to have any organic brain lesions after
going through computerized tomographic or mag-
netic resonance imaging scans. About 50% of patients
had received anxiolytics or antidepressants before
arriving at our clinic, but no participants had ingested
alcohol, drugs or medication at least 72 hours prior to
the test. Subjects’ age and gender distributions are
summarized in Table 1. There were no significant
group differences when referring to age (one-way
ANOVA, main effect, F (2,152) = .94, P > .05), or
gender (main effect, F = .06, P > .05). This study pro-
tocol was approved by a local ethics committee and all
subjects gave their written informed consent.
Handedness was determined using a Chinese
translation of the Edinburgh Handedness Inventory
29
.
Such an inventory has been used in two previous
Chinese studies
30,31
. Each of the 12 items of the in-
ventory were scored 1, 2 or 3 according to the
left-hand, either left or right, or right preference. All
subjects scored between 29 and 36, and were thus
considered to be moderate or strong right-handers.
Their vision was either normal or corrected to normal.
Table 1. Age (in years) and gender distribution in healthy
subjects (n = 56), Generalized Anxiety Disorder (GAD, n =
47) and Treatment-Resistant Depression (TRD, n = 52)
patients
Mean age Age range Gender
Healthy 26.2 ± 8.5 19-54 24 f, 32 m
GAD 28.7 ± 9.5 17-48 21 f, 26 m
TRD 27.5 ± 9.9 16-56 24 f, 28 m
Inventories
Before the line bisection task, subjects were
asked to complete three questionnaires on-site in a
quiet room. A brief overview of each questionnaire is
described below:
Int. J. Med. Sci. 2010, 7
226
1) The Zuckerman – Kuhlman Personality Ques-
tionnaire. One point is given to each chosen item
corresponding to personality traits. The test provides
five measurements: (a) Impulsive Sensation Seeking
(19 items); (b) Neuroticism-Anxiety (19 items); (c)
Aggression-Hostility (17 items); (d) Activity (17
items); and (e) Sociability (17 items). The internal
reliabilities of these scales range from .72 to .86. In
this questionnaire, 10 items of another scale of dissi-
mulation (infrequency or lie) were randomly inserted
into the test body. Any score above 3 on the infre-
quency scale suggests either inattention to the content
of the items and acquiescence or a very strong social
desirability set; therefore, the infrequency scale was
used as a test validity indicator for individuals
20
. The
test has proven to be reliable in the Chinese culture
32
;
2) The Zuckerman Sensation Seeking Scales
(form V, 40 items). This inventory was slightly mod-
ified by Carton et al.
33
. One point is given for each
chosen item corresponding to sensation seeking. The
test provides four subscales of 10 items each, ( i.e.,
Disinhibition, Thrill and Adventure Seeking, Expe-
rience Seeking and Boredom Susceptibility). The To-
tal score in each subject was also calculated as the sum
of the four scale scores. The internal reliabilities of
these scales range from .56 to .82
24
. The test has
proven to be reliable in the Chinese culture
34
;
3) The Plutchik–van Praag Depression Invento-
ry. This inventory contains 34 items; each item has
three scale points (0, 1, 2), corresponding to depres-
sive tendencies. Subjects have “possible depression”
if they score between 20 and 25, or “depression” if
they score higher than 25. The internal reliability of
this inventory is .93
21
.
Procedures
All subjects were requested to bisect eight lines
without measuring or folding the paper. The lines,
drawn in black and oriented horizontally, ranged
from 102 – 144 mm in length, were arranged ran-
domly on a sheet of A4 size paper (in a portrait
orientation) one below the other, and differed in their
distances from the sheet margins so that their centers
were not in alignment. The response sheet was al-
ways centered on the subject’s mid-sagittal plane. No
restrictions were placed on head or eye movements,
and no time limits were imposed. Subjects were in-
structed to use their right hand to make a mark indi-
cating the center of the line.
Data analyses and statistics
There are many classical methods to analyze line
bisection performance, for instance the percentage
expression of bias errors
35
. Here we employed a me-
thod developed by Drake & Ulrich
36
. Briefly, the
distance of the line bisecting task mark was measured
from the actual center to the nearest millimeter. The
frequency of the directional errors (Frequency), ir-
respective of the magnitude, was calculated as (Right -
Left)/ (Right + Left); negative values indicate errors to
the left and positive ones indicate errors to the right.
The magnitude of line bisection deviation (Magni-
tude) was calculated as an algebraic sum of the dis-
tance of marks from the true center divided by the
number (e.g., 8) of trials. Negative values indicate
errors to the left and positive ones indicate errors to
the right.
Two-way ANOVA followed by a post-hoc,
Duncan’s multiple new range test was applied to the
five trait scores of the Zuckerman-Kuhlman Perso-
nality Questionnaire or four scale scores of sensa-
tion-seeking in the three groups. The mean Fre-
quency, Magnitude, or depression scores in the three
groups were submitted to a one-way ANOVA plus
Duncan’s test. The relationship between the Fre-
quency, Magnitude, five personality traits, four sen-
sation seeking scales, and depression scores was as-
sessed by the Spearman rank order correlation test.
With the present sample size, power to detect an effect
(e.g., a scale score) was larger than 80% at P < .05 in a
sample of 47 subjects per group (the smallest group in
the present study).
Results
When the two-way ANOVA was applied to the
five personality trait scores in the three groups, main
group (F (2, 152) = 5.16, P < .05, MSE = 77.89), scale (F
(4, 608) = 58.33, P < .001, MSE = 632.62), and
group-scale interaction (F (8, 608) = 10.14, P < .001,
MSE = 109.29) effects were detected. The post-hoc
Duncan’s test also detected that the GAD subjects
scored significantly higher on Neuroticism-Anxiety
than the healthy subjects and TRD patients did; pa-
tients also scored significantly lower on Sociability
than the healthy subjects did. The four sensa-
tion-seeking scale scores, however, were not signifi-
cantly different between groups (main group effect, F
(2, 152) = .45, P > .05, MSE = 9.746) (Table 2).
The mean depression scores among the three
groups also had statistically significant differences
from each other (main effect, F (2, 152) = 60.64, P <
.001, MSE = 6205.02), with that of the TRD patients
higher than those of both the healthy subjects and the
GAD patients (also see Table 2).
On average, TRD patients bisected slightly more
frequently to the left of the true center, whereas
healthy subjects bisected slightly more frequently to
the right. The difference between the healthy subjects
Int. J. Med. Sci. 2010, 7
227
and TRD patients was not statistically significant. In
contrast, GAD patients bisected significant more fre-
quently to the left of the true center than the healthy
subjects did. When the mean Frequency errors in the
three groups were analyzed, one-way ANOVA de-
tected a significant difference (F (2, 152) = 3.50, P <.05,
MSE = 1.40). The post-hoc Duncan’s test showed that
the GAD group (-.32 ± .56 S. D.) was significantly dif-
ferent from the healthy control group (.01 ± .67, P <
.05). The scatter plot of the Frequency is shown in
Figure 1. The mean Magnitude errors were also sig-
nificantly different among the three groups (F (2, 152)
= 3.31, P < .05, MSE = 5.90), post-hoc Duncan’s test
detected that the mean Magnitude in the GAD group
(-.54 mm ± 1.15 S.D.) was significantly different from
that in the healthy controls’ (.12 ± 1.42), but not from
that in the TRD (-.33 ± 1.40); there was no statistical
difference between the mean Magnitude errors of the
healthy controls and those of the TRD either.
Table 2. Scale scores in the healthy subjects (n = 56), Generalized Anxiety Disorder (GAD, n = 47), and Treat-
ment-Resistant Depression (TRD, n = 52) patients.
Healthy GAD TRD
The Zuckerman-Kuhlman Personality Questionnaire
Impulsive Sensation Seeking 8.13 ± 3.44 8.38 ± 3.15 8.50 ± 3.70
Neuroticism–Anxiety 8.79 ± 4.20 14.53 ± 2.87* 12.10 ± 3.60*
+
Aggression-Hostility 6.71 ± 2.97 7.79 ± 3.61 7.37 ± 3.40
Activity 8.41 ± 3.12 8.02 ± 2.75 7.25 ± 3.32
Sociability 7.63 ± 3.40 6.30 ± 3.08
*
5.85 ± 3.69
*
Sensation Seeking Scales
Disinhibition 3.05 ± 1.83 2.49 ± 1.83 2.96 ± 2.01
Thrill and Adventure Seeking 5.48 ± 2.85 4.89 ± 2.29 4.64 ± 2.57
Experience Seeking 3.45 ± 1.80 3.23 ± 1.68 3.48 ± 1.82
Boredom Susceptibility 2.11 ± 1.46 2.55 ± 1.60 2.39 ± 1.47
TOTAL 14.07 ± 5.79 13.09 ± 4.28 13.46 ± 5.29
The Plutchik–van Praag Depression Inventory
10.79 ± 6.95 19.55 ± 10.28* 32.17 ± 12.56*
+
Note: * p < .05, a given patient group vs. the healthy controls;
+
p < .05, a given group vs. GAD group.
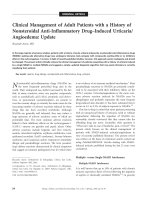
Figure 1. Scatter plot of the Frequency of errors in line bisection in the healthy subjects, Generalized Anxiety Disorder
(GAD) and Treatment-Resistant Depression (TRD) patients. Positive value indicates the rightward to the true center,
negative one the leftward. Big arrows in each group indicate the mean Frequency. Small arrows in each group indicate the
standard deviation of Frequency.
Int. J. Med. Sci. 2010, 7
228
Frequency was negatively correlated with the
Disinhibition-Seeking score (n = 56, r = -.28, P < .05) in
healthy subjects, and with Total sensation-seeking (n
= 47, r = -.30, P < .05) and Experience Seeking scores (n
= 47, r = -.34, P < .05) in GAD patients. In addition, the
depression score was negatively correlated with
Magnitude (n = 52, r = -.30, P < .05) in TRD patients.
No other correlations, such as between the handed-
ness and Frequency/ Magnitude, or personality trait
scores were found in our study.
Discussion
In the present study, patients scored higher on
Neuroticism-Anxiety (with GAD patients scoring
highest) and on depression (with TRD patients scor-
ing highest) than the healthy subjects did. These re-
sults lead to the observation that there is a great
overlap between anxiety and depression symptoms in
clinics
37,38
, and that these two disorders might share
similar genetic dimensions and disease continuums
39,40
. In addition, our patients scored lower on Socia-
bility than the healthy subjects did, which was also in
line with the previous report that major depression
affected the Sociability trait
41
, and this low extraver-
sion (introversion)
42
tendency has also been sug-
gested as personality endophenotypes in many an-
xiety disorders, e.g., social phobia and agoraphobia
43
.
In compliance with our hypothesis, GAD pa-
tients erred significantly leftward in line bisection,
which suggests a right hemispheric overactivation,
left hypoactivation, or both for this disorder. As we
have noted in our Introduction, negative emotions
like anxiousness are related to the activation of the
right hemisphere
8
. Some neuroimaging and electro-
physiological data have also shown that patients with
anxiety disorders (e.g., panic disorder) displayed
lower activation of the left parietal or superior tem-
poral cortex, but relatively greater activation of the
right frontal or hippocampal regions than the healthy
subjects did
44-46
. Contrary to our hypothesis, TRD
patients did not show significant leftward line bisec-
tion errors in our study. Such a result is in line with
previous studies, showing that the unipolar depres-
sive patients displayed a non-significant leftward bias
in manual line bisection, while schizophrenia patients
bisected significantly leftward
47-49
. However, results
in regard to the hemispheric activation in the depres-
sive disorder remain inconclusive up to date
50-55
.
Albeit, the slight rightward error found in our healthy
subjects was different from those documented in
Western countries
4
, this result is similar to those in
other studies conducted in Japan
56
and China
30,31
.
This discrepancy might result from a cultural back-
ground where most Chinese people are forced to use
their right hands during their early lives
25
.
The negative correlation between Frequency and
Disinhibition-Seeking scores in our healthy subjects,
and the negative correlation between Frequency and
the Total sensation-seeking and Experience-seeking
scores in GAD patients, contradict the recent neuro-
physiologic results in sensation seekers. For instance,
a greater left frontal EEG asymmetry at rest is related
to a tendency to engage in sensation-seeking and risky
behaviors in young adults
23
. Likewise, the associa-
tion of left hemisphere predominance and risk-taking
in healthy university students has also proven by
studying the line bisecting performance and Zucker-
man’s sensation seeking scales in Drake and Ulrich’s
study
36
. There is now no plausible explanation for
the paradox. As aforementioned, a rightward bias has
been reported in healthy subjects in some Eastern
countries like Japan and China, contradictory to those
found in Western societies, such a tendency might
contribute to our current findings. Moreover,
whether the reversed correlation in our GAD patients
was due to the severity of anxiety itself merits further
investigation. In our TRD patients, the depression
score was correlated negatively with Magnitude. This
finding is in accordance with the results in the ten-
sion-type headache study
31
, which might be because
many tension-type headache sufferers also displayed
signs of depression
57
. On the other hand, we could
not completely ruled out the medication effects on our
findings, since previous studies have shown the effect
of anxiolytics or antidepressants on cognition (e.g.,
attention, memory or learning)
58,59
, behavioral aspects
(e.g., executive function or motor reaction)
60
, and
hemispheric asymmetry
48
. However, prior to the
study, our patients were all medication-free for at
least 72 hours, which helped to remove some effects of
the anxiolytics or antidepressants. Nevertheless, fur-
ther studies about the medication effects on brain
asymmetry in anxiety and depression disorders
would be of interest.
Some limitations in our study should be under-
lined. Firstly, we did not consider the menstrual
cycles of our female subjects, since the line bisection
performance might be influenced by the menstrual
state of women
35,61
; however, three groups of our
subjects were gender-balanced. Secondly, we did not
measure the disordered personality traits in our sub-
jects, since the dependent personality disorder pa-
tients have shown a pronounced leftward line bisec-
tion error
30
. Thirdly, for more extensive comparisons,
we would need more data from left-handed subjects,
and data obtained using the neuroimaging or other