Báo cáo y học: "Strict glycaemic control in patients hospitalised in a mixed medical and surgical intensive care unit: a randomised clinical trial"
Bạn đang xem bản rút gọn của tài liệu. Xem và tải ngay bản đầy đủ của tài liệu tại đây (539.87 KB, 9 trang )
Open Access
Available online />Page 1 of 9
(page number not for citation purposes)
Vol 12 No 5
Research
Strict glycaemic control in patients hospitalised in a mixed
medical and surgical intensive care unit: a randomised clinical trial
Gisela Del Carmen De La Rosa
1
, Jorge Hernando Donado
2
, Alvaro Humberto Restrepo
1
,
Alvaro Mauricio Quintero
3
, Luis Gabriel González
3
, Nora Elena Saldarriaga
4
, Marisol Bedoya
1
,
Juan Manuel Toro
5
, Jorge Byron Velásquez
4
, Juan Carlos Valencia
4
, Clara Maria Arango
5
,
Pablo Henrique Aleman
1
, Esdras Martin Vasquez
4
, Juan Carlos Chavarriaga
4
, Andrés Yepes
4
,
William Pulido
4
, Carlos Alberto Cadavid
1
and Grupo de Investigacion en Cuidado intensivo: GICI-
HPTU
1
Department of Critical Care, Hospital Pablo Tobon Uribe, Calle 78B 69-240, Medellin, Colombia
2
Department of Epidemiology, Hospital Pablo Tobon Uribe, Calle 78B 69-240, Medellin, Colombia
3
Department of Internal Medicine, Universidad Pontificia Bolivariana, Cq 1 70-01, Medellin, Colombia
4
Department of Internal Medicine, Hospital Pablo Tobon Uribe, Calle 78B 69-240, Medellin, Colombia
5
Department of Internal Medicine, Universidad de Antioquia, Hospital Pablo Tobon Uribe, Calle 78B 69-240, Medellin, Colombia
Corresponding author: Gisela Del Carmen De La Rosa,
Received: 12 Jun 2008 Revisions requested: 7 Jul 2008 Revisions received: 5 Sep 2008 Accepted: 17 Sep 2008 Published: 17 Sep 2008
Critical Care 2008, 12:R120 (doi:10.1186/cc7017)
This article is online at: />© 2008 De La Rosa et al.; licensee BioMed Central Ltd.
This is an open access article distributed under the terms of the Creative Commons Attribution License ( />),
which permits unrestricted use, distribution, and reproduction in any medium, provided the original work is properly cited.
Abstract
Introduction Critically ill patients can develop hyperglycaemia
even if they do not have diabetes. Intensive insulin therapy
decreases morbidity and mortality rates in patients in a surgical
intensive care unit (ICU) and decreases morbidity in patients in
a medical ICU. The effect of this therapy on patients in a mixed
medical/surgical ICU is unknown. Our goal was to assess
whether the effect of intensive insulin therapy, compared with
standard therapy, decreases morbidity and mortality in patients
hospitalised in a mixed ICU.
Methods This is a prospective, randomised, non-blinded, single-
centre clinical trial in a medical/surgical ICU. Patients were
randomly assigned to receive either intensive insulin therapy to
maintain glucose levels between 80 and 110 mg/dl (4.4 to 6.1
mmol/l) or standard insulin therapy to maintain glucose levels
between 180 and 200 mg/dl (10 and 11.1 mmol/l). The primary
end point was mortality at 28 days.
Results Over a period of 30 months, 504 patients were
enrolled. The 28-day mortality rate was 32.4% (81 of 250) in the
standard insulin therapy group and 36.6% (93 of 254) in the
intensive insulin therapy group (Relative Risk [RR]: 1.1; 95%
confidence interval [CI]: 0.85 to 1.42). The ICU mortality in the
standard insulin therapy group was 31.2% (78 of 250) and
33.1% (84 of 254) in the intensive insulin therapy group (RR:
1.06; 95%CI: 0.82 to 1.36). There was no statistically
significant reduction in the rate of ICU-acquired infections:
33.2% in the standard insulin therapy group compared with
27.17% in the intensive insulin therapy group (RR: 0.82;
95%CI: 0.63 to 1.07). The rate of hypoglycaemia (≤ 40 mg/dl)
was 1.7% in the standard insulin therapy group and 8.5% in the
intensive insulin therapy group (RR: 5.04; 95% CI: 1.20 to
21.12).
Conclusions IIT used to maintain glucose levels within normal
limits did not reduce morbidity or mortality of patients admitted
to a mixed medical/surgical ICU. Furthermore, this therapy
increased the risk of hypoglycaemia.
Trial Registration clinicaltrials.gov Identifiers: 4374-04-13031;
094-2 in 000966421
APACHE II: Acute Physiology and Chronic Health Evaluation; CDC: Centers for Disease Control; 95% CI: 95% confidence interval; HPTU: Hospital
Pablo Tobón Uribe; ICU: intensive care unit; IQR: interquartile range; RR: relative risk; SD: standard deviation; SOFA: Sequential Organ Failure
Assessment.
Critical Care Vol 12 No 5 De La Rosa et al.
Page 2 of 9
(page number not for citation purposes)
Introduction
Hyperglycaemia is frequently found in critically ill patients even
in the absence of diabetes and it is associated with a poor
prognosis [1-4]. A randomised trial of 1548 patients hospital-
ised in a surgical intensive care unit (ICU) showed that main-
taining normal glucose levels reduces morbidity and mortality
[5]. In another randomised study of 1200 patients requiring a
minimum of three days hospitalisation in a medical ICU, inten-
sive glucose control resulted in a decrease in morbidity but not
in total mortality. However, a decrease in mortality was
observed in a subgroup of patients treated with intensive con-
trol for three or more days [6].
Observational studies have suggested that strict glucose con-
trol is able to reduce hospital mortality in mixed medical/surgi-
cal ICUs [7,8], but other non-experimental studies in similar
settings have not confirmed that the mean glucose level is an
independent risk factor for ICU mortality. [9-11].
It remains unclear if intensive insulin therapy is equally effica-
cious in both medical and surgical patients [12]. Therefore, we
conducted a randomised clinical trial to assess the efficacy
and safety of intensive insulin therapy compared with standard
glucose control in patients hospitalised for medical problems,
surgical non-cardiovascular procedures or trauma in a mixed
medical/surgical ICU.
Materials and methods
Patients
Patients aged 15 years or older admitted to the ICU at the
Hospital Pablo Tobón Uribe (HPTU), Medellín, Colombia,
between 12 July, 2003 and 21 December, 2005 with an
expected ICU stay of at least two days were eligible for the
trial. HPTU is a 239-bed university hospital with a mixed (sur-
gical/medical) 12-bed adult ICU. Reasons for exclusion were
pregnancy, diabetic ketoacidosis, hyperosmolar non-ketotic
state, readmission to the ICU during the same hospitalisation,
advanced stage cancer (solid or haematological), decision to
withhold or withdraw aggressive therapies, and inclusion in
another clinical trial.
The protocol was approved by the institution's ethics commit-
tee and written informed consent was obtained from the
patients or their closest relatives. An independent Data Safety
Monitoring Board comprised of three members with expertise
in statistics, critical care and clinical epidemiology conducted
two interim analyses. The end points for efficacy were based
on the O'Brien-Flemming procedure with p values of 0.0006
and 0.0151. In both analyses they recommended to continue
the trial.
Randomisation
Patients were randomly assigned into study groups with a 1:1
ratio according to a computer-generated random number list
with permuted blocks of six. They were stratified by diabetes
diagnosis. The procedure was managed in the central phar-
macy in charge of group assignment. Personnel involved in the
treatment and investigation were unaware of the randomised
schedule and the block size.
Interventions
Patients were randomly assigned to receive either standard
insulin therapy or intensive insulin therapy. Both groups
received insulin via continuous infusion pump (Baxter col-
league 3 or Baxter flo-Gard 6301, Baxter Healthcare Corpora-
tion I. V. System Division, Deerfield, IL, USA). The standard
concentration of insulin (Humulin R, Eli Lilly and Company,
Indianapolis, IN, USA) was 100 units in 100 ml of 0.9% saline
solution. In the standard insulin group, insulin infusion was
started when glucose levels exceeded 215 mg/dl and was
adjusted to maintain blood glucose levels between 180 and
200 mg/dl (10.0 to 11.1 mmol/L) (See additional data file 1).
In the intensive insulin group, insulin infusion was started when
blood glucose levels exceeded 110 mg/dL, and was adjusted
to maintain a glucose level of between 80 and 110 mg/dl (4.4
to 6.1 mmol/L) (See additional data file 2).
Blood glucose levels were measured in undiluted arterial
blood. Undiluted samples were obtained by removing at least
four times the flush-volume in the line between the sampling
point and the arterial puncture site before the actual sample
was taken or, when an arterial catheter was not available, in
capillary blood with the use of a point-of-care glucometre
(MediSense Optium, Abbot Laboratories MediSense Prod-
ucts Bedford, MA, USA). Glucose levels were determined with
a glucometre at admission to ICU. They were repeated every
one, two and four hours if the patient had insulin infusion, and
every four and six hours if no insulin was required according to
the algorithm.
A protocol (see additional data files 1 and 2), managed by the
ICU nurses, was used for the adjustment of the insulin dose.
The standard insulin therapy had been the usual treatment dur-
ing the past 12 months, and a training period of three months
in the intensive insulin therapy was implemented before start-
ing the trial.
To prevent hypoglycaemia in patients who were receiving insu-
lin but were not receiving enteral or total parenteral nutrition,
10% glucose was administered intravenously via continuous
infusion (5 g/hour). The same infusion was used in patients
with diabetes who were not receiving nutrition in order to pre-
vent ketosis. It was also used for treatment of hypoglycaemic
patients (glucose was administered via a 10 g intravenous
boluses). The glucose infusion was stopped when the
patient's nutrition was restarted or when the patient was no
longer hypoglycaemic.
Protocols were consistently followed throughout the patient's
whole ICU stay. After discharge from the ICU, treatment was
Available online />Page 3 of 9
(page number not for citation purposes)
continued according to the treating physician's recommenda-
tions and protocols were stopped.
We registered every patient's age, sex, body mass index, dia-
betes history, type of diabetes treatment, previous infections,
comorbidities, ICU admitting diagnosis, Acute Physiology and
Chronic Health Evaluation (APACHE II) score [13], Sequential
Organ Failure Assessment (SOFA) score [14] and Glasgow
coma score. The Glasgow coma score was obtained before
starting sedation and was changed only when the sedation
effects had finished.
Blood glucose levels were measured on admission. They were
also measured daily in the mornings. The median of all daily
values and daily maximal and minimal blood glucose levels
were documented. Hypoglycaemic episodes of less than 41
mg/dl (2.2 mmol/l) and within 41 to 59 mg/dl (2.2 to 3.2 mmol/
l) were registered, as well as the use of vasopressors, inotrop-
ics, steroids, transfusions, values of Glasgow trauma score,
daily number of glucometre readings, creatinine levels and the
SOFA scores.
If a patient presented with a temperature of 38.3°C or more or
if the treating physician suspected an infection, blood, urine
and sputum cultures were obtained. The diagnosis of infec-
tions acquired in the ICU was performed according to the
CDC diagnosis criteria applied by three different physicians
blinded to the treatment assignment [15]. A distinction was
made between primary and secondary bacteraemia, depend-
ing on whether or not a focus could be identified.
Outcomes
The primary outcome was 28-day all-cause mortality. Second-
ary outcomes were: ICU mortality; hospital mortality; incidence
of infections in the ICU (ventilator-associated pneumonia, uri-
nary infections, catheter-related infections and primary bacter-
aemias); ICU length of stay; days of mechanical ventilation and
incidence of severe hypoglycaemia defined as number of
patients with at least one episode of blood glucose level less
than 40 mg/dl (2.2 mmol/l).
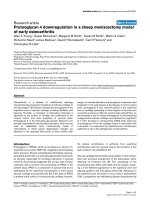
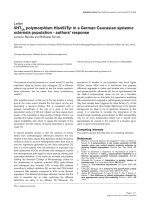
Figure 1
Flow of participants through the trialFlow of participants through the trial.
Critical Care Vol 12 No 5 De La Rosa et al.
Page 4 of 9
(page number not for citation purposes)
Sample size
We estimated that the enrollment of 504 patients would pro-
vide a power of 80% to detect an absolute reduction of 10%
in the 28-day mortality rate with an alpha error (two-sided test)
of 0.05. We assumed a 25% mortality rate in the control
group.
Statistical analysis
Data is presented in absolute numbers and proportions for
nominal variables. Mean ± standard deviation (SD) or median
and interquartile range (IQR) is used for continuous variables,
normally or non-normally distributed, respectively.
The outcomes were analysed according to the intention-to-
treat principle. Primary and secondary end points were com-
pared with the use of a Student's t-test for parametric data, the
Mann-Whitney U test for non-parametric data, and the Pear-
son chi-square or Fisher exact test for proportions. For rates of
mortality, 95% confidence intervals (CI) were calculated, and
a p < 0.05 was considered statistically significant. No correc-
tions were made for multiples tests. The statistical analyses
were executed with the statistics packet SPSS/PC 13.0
(SPSS Inc., Chicago, IL, USA).
Results
During the study period 1643 patients were admitted to the
ICU and 831 did not meet inclusion criteria: 791 had an
expected length of stay in the ICU of less than 48 hours and
40 exceeded the recruitment time limit. Of the 812 patients
who met the inclusion criteria, 308 were excluded for the fol-
lowing reasons: 221 had a terminal illness, 42 refused to par-
ticipate, 40 had a second admission to the ICU and five had
diabetic ketoacidosis or hyperosmolar coma. A total of 504
patients were enrolled, 250 in the control group and 254 in the
intervention group. There was one patient from the intensive
insulin group who did not receive either of the two protocols
and one patient who belonged to the intensive insulin group
who received the conventional insulin protocol. According to
the intention-to-treat principle, they were analysed in the group
they had been assigned to originally. The patients were fol-
lowed-up until discharged from the hospital (Figure 1).
Demographics and baseline characteristics were similar in the
two groups (Table 1). The average delay between admission
to the ICU and enrollment into a protocol group was 12.5 ±
6.2 hours in the intensive insulin group and 12.4 ± 5.9 hours
in the standard insulin group (p = 0.853). The mean time
Table 1
Baseline characteristics of the patients.
Variable Standard treatment Intensive treatment
(N = 250) (N = 254)
Male sex (%) 154 (62) 147 (58)
Age (years)* 47.4 ± 19.3 45.9 ± 20.2
Body-mass index *† 25 ± 4.5 24.6 ± 4,2
History of diabetes (%) 29 (11.6) 32 (12.6)
Treated with insulin 9 (3.6) 5 (2.1)
Histrory cirrhosis 7 (2.8) 9 (3.5)
History heart failure 3 (1.2) 6 (2.4)
History kidney failure 16 (6.4) 10 (3.9)
History of cancer 9 (3.6) 15 (5.9)
APACHE II – score *‡ 15.6 ± 7.6 15.7 ± 6.9
SOFA – scores *§ 7.6 ± 3.5 7.3 ± 3.2
Reason for ICU admission (%)
Medical 123 (49.2) 123 (48.4)
Surgery 37 (14.8) 45 (17.7)
Trauma 90 (36) 86 (33.9)
Blood glucose on admission (mg/dl) *¶ 153.6 ± 67.1 155.3 ± 68.4
* Values presented as mean ± SD.
†The body mass index is the weight in kilograms divided by the square of the height in metres.
‡APACHE II = Acute Physiology and Chronic Health Evaluation. Higher scores reflects more severe critical illness.
§SOFA = Sequencial Organ Failure Assessment. Higher scores reflect more severe organic dysfunction. for the worst values in the six organs
during the first 24 hours after enrollment.
¶To convert the values for glucose to millimoles per litre, multiply by 0.05551.
Available online />Page 5 of 9
(page number not for citation purposes)
required to reach the glucose goal was 6.3 ± 2.1 hours in the
intensive insulin group and 6.1 ± 2.5 hours in the standard
insulin group (p = 0.332).
Admissions due to infections were similar in both groups: 82
patients of 250 (32.8%) in the standard insulin group and 83
of 254 (32.7%) in the intensive insulin group.
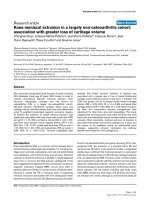
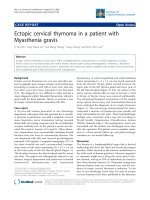
The mean calorie intake in 24 hours was 23.1 ± 12.7 kcal/kg
in the standard insulin group and 25.5 ± 14.4 kcal/kg in the
intensive insulin group (mean difference: 2.4; 95% CI: -0.02 to
4.9). Total parenteral nutrition (glucose 30 to 50% plus amino
acids and lipids to reach the required total caloric intake) alone
or combined with enteral nutrition was given to 14 patients in
the standard insulin group (5.6%) and 14 in the intensive insu-
lin group (5.5%). The remaining patients received total-enteral
feeding exclusively. In the standard insulin group 47% patients
(118 of 250) received at least six hours intravenous 10% glu-
cose (5 g/hour) during the ICU stay (Figure 2).
More patients in the intensive insulin group than in the stand-
ard insulin group received insulin (97% vs. 47%, p < 0.001)
as well as having a higher amount of insulin administered per
24 hours (52.4 ± 53.3 IU vs. 12.5 ± 32.8 IU, p < 0.001). The
intensive insulin group had lower mean blood glucose level
than the standard insulin group: 117 mg/dl (IQR: 101 to 140)
compared with 148 mg/dl (IQR: 122 to 180), (p < 0.001) (Fig-
ure 3), and had more glucometre readings per day: 13 ± 5.5
compared with 5.9 ± 4.0, p < 0.001. The proportion of
patients with at least one episode of a glucose level of 40 mg/
dl or less was higher in the intensive insulin group (8.3% vs.
0.8%, p < 0,001). Six patients in the intensive insulin group
had two or more hypoglycaemic events (Table 2). One patient
presented with an episode of tonic-clonic generalised seizure
Figure 2
Nutrition administered to all 504 patients during the first 10 days of intensive careNutrition administered to all 504 patients during the first 10 days
of intensive care. Feeding at 0 represents the administration of nutri-
tion between admission and 7 a.m., and 1 represents feeding on the
first day after admission, from 7 a.m. onwards. Nutrition in the two
groups was similar. (a) Total caloric intakes areexpressed as mean val-
ues (with the 95% confidence intervals indicated by the error bar). (b)
Nutrition administered by the enteral route are expressed as mean val-
ues, (with the 95% confidence intervals indicated by the error bar). (c)
Nutrition administered by the parenteral route are expressed as mean
values (with the 95% confidence intervals indicated by the error bar).
Figure 3
Daily blood glucose levels during the first 10 days of intensive careDaily blood glucose levels during the first 10 days of intensive
care. Medians and interquartile ranges (IQR) during the ICU stay (time)
are shown for the two treatment arms.