Báo cáo y học: "1, 25-dihydroxyvitamin D3 decreases adriamycin-induced podocyte apoptosis and loss"
Bạn đang xem bản rút gọn của tài liệu. Xem và tải ngay bản đầy đủ của tài liệu tại đây (696.22 KB, 10 trang )
Int. J. Med. Sci. 2010, 7
290
I
I
n
n
t
t
e
e
r
r
n
n
a
a
t
t
i
i
o
o
n
n
a
a
l
l
J
J
o
o
u
u
r
r
n
n
a
a
l
l
o
o
f
f
M
M
e
e
d
d
i
i
c
c
a
a
l
l
S
S
c
c
i
i
e
e
n
n
c
c
e
e
s
s
2010; 7(5):290-299
© Ivyspring International Publisher. All rights reserved
Research Paper
1, 25-dihydroxyvitamin D3 decreases adriamycin-induced podocyte
apoptosis and loss
Min-shu Zou
1
, Jian Yu
1
, Guo-ming Nie
1
, Wei-sun He
2
, Li-man Luo
1
, Hong-tao Xu
1
1. Department of Pediatrics, Wuhan General Hospital of Guangzhou Command, Wuhan 430070, China
2. Department of Nephrology, Affiliated Children Hospital of Shanghai Jiaotong University, Shanghai, China
Corresponding author: Jian Yu, Department of Pediatrics, Wuhan General Hospital of Guangzhou Command, Wuhan
430070, China. Email:
Received: 2010.05.26; Accepted: 2010.08.17; Published: 2010.08.24
Abstract
Background: Selective proteinuria is frequently observed in glomerular diseases characte-
rized by podocyte injury. Although, 1,25-dihydroxyvitamin D3 [1,25(OH)
2
D
3
] has potential
therapeutic effects on chronic kidney diseases through decreasing podocyte loss, the me-
chanism underlying the beneficial effects of 1,25(OH)
2
D
3
on podocytes remains still unknown.
The present study tested the hypothesis that 1,25(OH)
2
D
3
directly reduced podocyte
apoptosis and loss.
Methods: Sprague-Dawley (SD) ra t s w e r e r a n d o m l y a s s i g n e d i n t o t h r e e g r o u p s : A d r i a m y c i n
(ADR) group (n=15), ADR+1,25-(OH)
2
D
3
group (n=16), and control group (n=16). Rats in
ADR+1,25-( OH)
2
D
3
group were treated with 1,25(OH)
2
D
3
for 8 weeks. The number of
podocytes and foot process width (FPW) were detected by transmission electron micro-
scopy. The number of apoptotic podocytes per glomerulus and that of apoptotic nuclei an d
caspase-3 activity in cultured podocytes were determined by TUNEL staining. The average
number of podocytes per glomerulus was quantified by immunohistochemistry. Expressions
of p-Smad2/3, p-Smad1/5/8, Fas, Fas-Associated protein with Death Domain (FADD), Bax,
and Bcl-2 proteins were examined by Western blot assay.
Results: Compared with control group, proteinuria, FPW, apoptotic podocytes, caspase-3
activity, the protein expressions
of p-Smad2/3, Fas, FADD, and Bax were significantly in-
creased, podocyte density, p-Smad1/5/8 a n d Bcl-2 expression were d e c r e a s e d i n A D R g r o u p .
1,25(OH)
2
D
3
significantly reduced proteinuria, FPW, caspase-3 activity, expressions of
p-Smad2/3, Fas, FADD, and Bax and apoptosis of podocytes, but increased serum albumin,
number of viable podocytes , p-Smad1/5/8 and Bcl-2 expression in ADR treated rats.
Conclusion: ADR-induced podocyte apoptosis was associated with the imbalance of
p-Smad2/3, p-Smad1/5/8 the activity of caspase-3 a n d aberrant expressions of, F a s , F A D D , B a x
and Bcl-2. The beneficial effects of 1,25(OH)
2
D
3
on podocytes may be attributable to inhibit
podocyte apoptosis and the amelioration of podocytopenia.
Key words: 1, 25 -dihydroxyvitamin D3, podoc yte, proteinuria
Introduction
Podocytes
are highly specialized and terminally
differentiated cells with limited mitotic capacity.
Therefore, once lost, the regeneration of podocytes is
l i m i t e d . T h e r e i s a g r o w i n g b o d y o f l i t e r a t u r e s h o w i n g
that podocytopenia is a critical determinant in the
development of glomerulosclerosis that leads
to pro-
Int. J. Med. Sci. 2010, 7
291
gressive renal failure. Podocytopenia is caused by
detachment of
podocytes from glomerular basement
membrane (GBM) and/or apoptosis of podocytes (1).
Caspase-3 is a newly characterized mammalian
cysteine protease that promotes cell apoptosis in
m a n y d i f f e r e n t conditions. T h e m o s t c o m m o n c a u s e o f
apoptosis in kidney diseases is mediated by Fas (2).
Albumin overload also resulted in a dose-dependent
up-regulation of Fas and Fas-associated protein with
death domain (FADD) (3). Bcl-2 family which consists
of both pro-apoptotic protein (e.g., Bax) and an-
ti-apoptotic protein (e.g., Bcl-2 ) a p p e a r s t o p l a y c r u c i a l
roles in regulating the balance between apoptosis and
s u rv iv a l ( 4).
It has been demonstrated that 1,25-(OH)
2
D
3
ca n
reduce proteinuria in active Thy1-nephritis
rats (5),
inhibit progressive glomerulosclerosis and decrease
albuminuria in subtotally
nephrectomized rats (6),
and down-regulate the renin-angiotensin system
(RAS) by inhibiting renin production (7). Recent re-
ports also indicate that 1,25(OH)
2
D
3
can decrease po-
docyte loss and inhibit podocyte hypertrophy in
subtotally nephrectomized rats (8). In puromycin
aminonucleoside nephropathy rats, p o d o c y t e i n j u r y i s
suppressed by 1,25(OH)
2
D
3
via modulation of trans-
forming growth factor-beta 1 (TGF-1)/bone morpho-
genetic protein-7 (BMP-7) signalling (9). Those find-
ings clearly suggest podocytes serve as a potentially
important target for vitamin D in the treatment of
kidney diseases.
Recent studies have shown that podocytes un-
dergo apoptosis in glomerular disease (10). X i ao et al.
(11) demonstrated that 1,25(OH)
2
D
3
prevented pu-
romycin aminonucleoside-induced apoptosis of glo-
merular podocytes by activating the phosphatidyli-
nositol 3-kinase/Akt-signaling pathway. Gassler et al.
(12) revealed extensive apoptosis and markedly de-
creased number of nephrons in bcl-2 deficient mice.
Schiffer et al. (13) demonstrated podocytes undergo
apoptosis at early stages in the course of progressive
glomerulosclerosis in TGF-β1 transgenic mice. Their
results suggested a novel functional role for Smad7 as
amplifier of TGF-β-induced apoptosis in podocytes
and a new pathomechanism for podocyte depletion in
progressive glomerulosclerosis.
In clinical practice, 1,25-(OH)
2
D
3
is widely used
in the treatment of hypocalcemia and hyperphospha-
temia of patients with chronic kidney disease (CKD).
However, little is known about the effects of
1,25-( O H )
2
D
3
on podocyte apoptosis and podocyto-
penia. The present study aimed to investigate the ef-
fects of 1,25-(OH)
2
D
3
on podocyte apoptosis and po-
docytopenia induced by adriamycin (ADR) and the
potential mechanisms.
Materials and Methods
Animals and experimental design
Forty-eight male Sprague-Dawley (SD)
rat
s
were housed in a tempe
rat
ure-controlled room with a
12 h light/12 h dark cycle and given ad libitum access
to food and water. These rats were randomly divided
into three groups (n=16, per group): Adriamycin
(A DR) g r o u p, A D R + 1 , 2 5 -(OH)
2
D
3
group, and control
group. ADR induced nephropathy was introduced by
a single injection of 7.5 mg/kg ADR (0.75 mg/ml in
normal saline; Sigma) via the tail
ve i n ( 14). Rats in
ADR+1,25-( O H )
2
D
3
group were treated with
1,25-( O H )
2
D
3
(3 ng·100 g body weight
-1
·day
-1
) (8) by a
subcutaneous osmotic minipump for 8 weeks. One rat
died in the ADR group and was excluded from the
experiment. Rats in ADR group and control group
were subcutaneously given normal saline of equiva-
lent volume once daily for 8 weeks. Eight weeks later,
24-h urine samples were collected through metabolic
cages followed by sacrifice of mice. The 24-h u r i ne
protein (24 h UP) was determined by colorimetric
assay. Levels of serum albumin (SA), creatinine, total
cholesterol (TC) and triglyeride (TG) were measured
with an automatic biochemical analyzer (HITACHI
7080).
Detection of podocytes and foot process width
by transmission electron microscopy
Part of renal cortex was fixed in 1.5% glutaral-
dehyde and 1% paraformaldehyde, dehydrated, and
embedded in Spurr resin. Ultrathin sections were
prepared and stained with lead citrate for transmis-
sion electron microscopy. Ten fields (three glomeruli
per field) in transverse sections of each rat were ran -
domly selected under a transmission electron micro-
scope (×3000; Philips, Netherlands). The length of
peripheral GBM was measured and the number of
foot processes on GBM was counted. The mean foot
process width (FPW) was calculated as follow:
FPW=π/4×(∑GBM length/ ∑foot process); where
∑GBM length is the total length of GBM in one glo-
merulus, ∑foot process is the total number of foot
process, and π/4, a correction factor, serves to correct
the random orientation under which foot processes
are sectioned (15).
Detection of podocyte number per glomerulus
by immunohistochemistry
Renal tissues were fixed in formalin, embedded
in paraffin and cut into sections followed by staining
with periodic-acid schiff (PAS) reagent. The number
of podocytes in 3-µm frozen sections was determined
through double-staining with rabbit anti-Wilms tu-
Int. J. Med. Sci. 2010, 7
292
mor antigen-1 (WT-1) polyclonal antibody (1:50)
(Santa Cruz Biotechnology, Inc., USA) and mouse
anti-synaptopodin monoclonal antibody (1:50) (Bio-
friendship Inc., Beijing, China). Cells positive for both
synaptopodin and WT-1 w e r e c o u n t e d i n 3 0 g l o m e r u l i
of transverse sections. Results were presented as av-
erage number of podocytes per glomerulus in trans-
verse sections.
Detection of apoptotic podocytes per glomeru-
lus by TUNEL staining
Apoptotic nuclei were detected through a trans-
ferase-mediated dUTP nick-end labeling (TUNEL)
staining of kidney sections followed by counterstain-
ing with hematoxylin and PAS, as previously de-
scribed (13). TUNEL staining was performed accord-
ing to the manufacturer’s instructions (Biosynthesis
Biotechnology Co., Ltd, Beijing). In brief, 3 µm paraf-
fin-embedded kidney sections were deparaffinized
with xylene, blocked with 3% H
2
O
2
f o r 30 min,
washed with PBS, permeabilized with 0.5% Triton
X-100 for 10 min and then washed with PBS. Terminal
deoxynucleotidyl transferase (TdT) and bio-
tin-11-dUTP were supplemented followed by incuba-
tion for 60 min. Then, sections were washed with PBS,
incubated with avidin-biotinylated horseradish pe-
roxidase complex followed by color development
with DAB. Counterstaining for nuclei, dehydration,
clearing and mounting were performed. Cells with
brown granules in nuclei were TUNEL positive cells
and TUNEL positive podocytes on the GBM were
counted in 30 glomeruli of transverse section, Results
were expressed as average numbers of
TUNEL-positive podocytes per glomerulus.
Detection of apoptotic podocytes nuclei and the
activity of caspase-3
in cultured podocytes
Podocytes were isolated from glomeruli of SD
rats and maintained in medium as previously de-
scribed (16). Briefly, glomeruli were isolated by dif-
ferential sieving of minced cortices, followed by di-
gestion with collagenase and culture. Early cellular
outgrowths at 5-7 days were selectively removed by a
cylinder cloning technique. Cells were replated, and
plates growing pure colonies were then expanded and
identified. Podocytes between passages 8 and 10 were
used for experiments. Terminal deoxynucleotidedyl
transferase (TUNEL) assay (ApoAlert
Assay Kit; BD
Biosciences Clontech, San Jose, CA) was performed
as
previously described (17).
Briefly, cells were grown on
cover slips, fixed with 4% formaldehyde
for 30 min at
4°C, permeabilized with 0.2% Triton X-100
for 15 min
at 4°C, and incubated with a mixture of nucleotides
and TdT enzyme for 60 min at 37°C in humidified air
in dark. Reaction was terminated with 2X SSC, and
the cover slips were mounted
on glass slides. Apop-
totic nuclei were detected under fluorescence
micro-
scope, and cells with characteristic
morphology of
apoptosis, including nuclear fragmentation, nuclear
co n d e n s a ti o n , a n d in t e nsel y fl u o r e s ce n t nuclei were
counted. A total of 100 cells were counted for each
sample. Results were
expressed as the percentage of
TUNEL positive nuclei in all nuclei
visualized by
phase contrast microscope.
Detection of caspase-3 activity was performed
with BD ApoAlert Caspase Colorimetric Assay Kit
(BD Biosciences, Palo Alto, CA), according to the
manufacturer’s instructions. This assay uses the spec-
trophotometric detection of the chromophore
p-nitroaniline after its cleavage by caspase-3 from the
labeled caspase-specific substrates. Adherent cells
together with floating cells in the medium were col-
lected, and lysed with lysis buffer included in the kit.
After the cell lysate was incubated with caspase-3
substrate DEVD–p-nitroaniline (final concentration,
50 µM) at 37°C for 1 h, the absorbance (caspase-3 ac-
tivity) was measured by at 405 nm w i t h a m i c r o p la te
reader (Packard Spectracount).
Western blot assay
After removal of kidney capsule, the outer
cortex
was minced in 1- to 2-mm fragments, passed through
consecutive
80- and 120-mesh sieves, and recovered
from the 200-mesh sieve. After centrifugation, super-
natant was abandoned and glomeruli were obtained.
Glomeruli were lysed with RIPA buffer (0.1%
s o di u m
dodecyl sulfate, 1% sodium deoxycholate, 1% Triton
X-100, 150 mM NaCl, 10 mM EDTA, and 25 mM
Tris·HCl, pH
7.2) and protease inhibitors (1 mM
phenylmethylsulfonyl fluoride, 1 µg/ml leupeptin,
and 1 µg/ml pepstatin)
followed by ultrasonic ho -
mogenation on ice. Lysates were centrifuged
at 12,000
g for 10 min, and supernatants containing proteins
were collected. Then, 75 μg of total proteins
were
subjected to SDS-polyacrylamide gel electrophoresis
and transferred onto nitrocellulose membranes. After
being blocked in 5% low-fat milk, the membranes
were incubated with anti-p-smad2/3(1:500), an -
ti-p-Smad1/5/8(1:500), a nt i -Fas (1:1000), anti-FADD
(1:100), anti-Bax (1:500) or anti-Bcl2 (1:500) antibodies
(Santa Cruz Biotechnology, CA). Subsequently, the
membranes were rinsed in Tris-buffered saline con -
taining 0.02% Tween-20
and incubated with horsera-
dish peroxidase conjugated to anti-rabbit
or mouse
IgG antibody (1:4000, Santa Cruz). After washing, the
membranes were developed using an enhanced
che-
miluminescence reagent (Santa Cruz), and the specific
protein bands were scanned and quantitated. Expres-
Int. J. Med. Sci. 2010, 7
293
sion of specific protein was normalized by that of
GAPDH (36 kDa) as an endogenous reference.
Statistical Analyses
Data were presented as means ± standard devi-
ation (SD). Results were analyzed
using the
Kruskal-Wallis non-parametric test for multiple
comparisons followed by Mann-Whitney U-test. A
value of P<0.05 was considered statistically signifi-
cant. Correlations were assessed by Pearson correla-
tion analysis. Statistical analyses were performed with
SPSS version 11.0.
Results
Changes in 24 h UP, SA, TC and TG
The levels of 24 h UP, TC and TG in ADR group
were significantly higher than those in control group,
and the SA level in ADR group was m a r k e d l y lower
than that in control group. As compared with ADR
group, the levels of 24 UP, TC and TG were dramati-
cally decreased and SA increased after 1,25-(OH)
2
D
3
treatment. Results are shown in Table 1.
Table 1 24 h UP, SA, TC and TG levels in different groups
Group n 24 h UP
(mg)
SA (g/L) TC
(mmol/L)
TG (mmol/L)
control 16 1.01±0.29 35.10±3.33 0.43±0.11 0.89±0.21
ADR 15 57.05±9.28
##
18.13±3.06
##
8.06±2.00
##
8.17±1.97
##
ADR
+1,25(OH)
2
D
3
16 37.69±5.71
##
△△
23.25±3.01
##△△
5.09±1.42
##
△△
5.48±1.30
##△△
Data are means ± SD. 24 h UP, 24-h urine protein; SA, serum albu-
min; TC, total cholesterol; TG, triglyeride.
##
P < 0.01,
#
P < 0.01 vs. control group.
△△
P<0.01 vs. ADR group.
The number of podocytes and FPW
Compared with rats in control group, the num-
ber of podocytes was decreased and FPW increased in
A D R g r o u p . I n a ddition, after 1,25-(OH)
2
D
3
treatment,
the number of podocytes and FPW in 1,25-(OH)
2
D
3
group was higher and smaller than those in A DR
group, respectively (Table 2 and Figure 1).
Table 2 The number of podocytes and FPW in different
groups
Group n Podocytes FPW (nm)
control 16 5.46±0.51 271.38±52.48
ADR 15 3.35±0.14
##
806.13±120.19
##
ADR +1,25(OH)
2
D
3
16 4.44±0.23
## △△
401.13±52.48
## △△
Data are means ± SD. FPW, foot process width.
##
P < 0.01 vs. control group.
△△
P<0.01 vs. ADR group.
Effect of 1,25(OH)
2
D
3
treatment on podocyte
density
In the control group, the number of
double-positive podocytes was 11.55±1.69
cells/glomerulus. In the ADR group, the number of
double-positive podocytes (7.97±1.62
cells/glomerulus) was markedly lower than that in
1,25(OH)
2
D
3
group (10.07±1.54 cells/glomerulus) (P
<0.01) (Figure 2).
Podocyte apoptosis
TUNEL staining was performed to detect the
number of apoptotic podocytes per glomerulus. Sig-
nificant difference in the number of TUNEL-p o s i ti v e
podocytes was found between ADR group and con-
trol group (2.50±0.77 vs. 0.19±0.40, P<0.01). After 8
weeks of treatment with 1,25(OH)
2
D
3
, the number of
apoptotic podocytes was significantly higher than that
in ADR group (1.19±0.37 vs. 2.50±0.77, P<0.01), indi-
cating marked improvement in podocyte apoptosis
after 1,25(OH)
2
D
3
treatment (Figure 3).
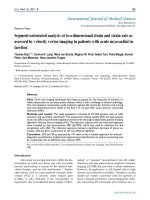
F i g u r e 1 . Ultrastructure of podocytes under a transmission electron microscope (×3000). A : c o n t r o l g r o u p ; B : A D R g r o u p
a n d C : 1, 2 5 ( O H )
2
D
3
group. The foot processes in the control group were intact. Fusion and disappearance of f o o t p r oc e s s e s
(arrow) were noted in the ADR group. Fusion and disappearance of foot processes were improved in 1,25(OH)
2
D
3
g r o up
when compared with the ADR group.
Int. J. Med. Sci. 2010, 7
294
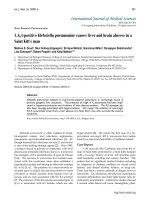
Figure 2. Podocytes in different groups under a light microscope (×200). Immunohistochemistry was performed to eva-
luate the number of podocytes. A: control group; B: ADR group and C: 1,25(OH)
2
D
3
group. The average number of
double-positive podocytes (arrow)
was 11.55±1.69 cells/glomerulus in the control group, and 7.97±1.62 cells/glomerulus in
the A D R g r o u p . Statistical analysis showed the average number of podocytes per glomerulus
was higher in the 1,25(OH)
2
D
3
group (1 0.07±1.54 cells/glomerulus) than that in the A D R g r o u p .
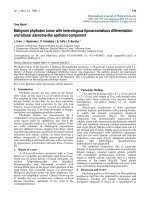
Figure 3. Apoptotic podocytes in different groups (×400). TUNEL staining was performed to detect the number of
apoptotic podocytes per glomerulus. A: c o n t r ol g r o up ; B: ADR group a n d C : 1,25(OH)
2
D
3
group. The average number of
TUNEL-positive podocytes (arrows) was 0.19±0.40 cells/glomerulus i n t h e c o n t r o l g r o u p a n d 2.50±0.77 cells/glomerulus in
the ADR group. Statistical analysis showed the number of TUNEL-positive podocytes
was lower in 1,25(OH)
2
D
3
-tr e a t e d
group (1 .19±0.37 cells/glomerulus) than in the ADR group.
##
P < 0.01 vs. control group.
△△
P<0.01 vs. ADR group.