Carbon Materials for Advanced Technologies Episode 11 ppsx
Bạn đang xem bản rút gọn của tài liệu. Xem và tải ngay bản đầy đủ của tài liệu tại đây (1016.49 KB, 40 trang )
380
2000
lorn
0
0
4
8
12
16
SCATTERING
ANGLE
(deg.)
C
k2
(k2
)
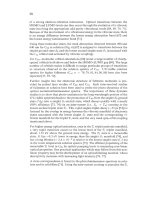
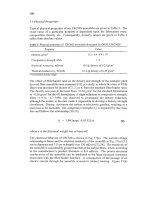
Fig.
28.
(a) Small angle scattering intensity versus scattering angle for Br1000. The
solid line
IS
a fit using equation
(6)
with
RE
=
5.5
A.
(b)
Natural log
of
the scattered
intensity versus
k2.
The straight-line fit allows
R,
to be extracted from eq.
(6).
The large
intensity at very small
k
is
caused by the scattering from macropores or mesopores in the
sample
381
R=B,
/A,
10
20
30
40
SCATTERING
ANGLE
(deg.)
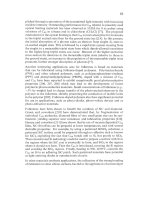
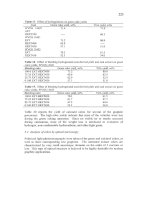
Fig. 29.
Schematic graph showing the definition
ofthe
parameter,
R,
used
to
empirically
estimate the fraction
of
single graphene layers
in
hard carbon
samples.
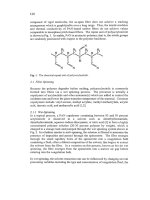
Figure
30
shows a series of calculated patterns for carbon samples with a
fraction,
f,
of
carbon atoms in randomly oriented single layers, a fraction
2/3(
1-
f)
in
bilayers and a fraction
1/3(1-f)
in trilayers
[12].
These curves can be used
to
estimate the dependence of the ratio,
€2,
defined by Fig.
29,
on the single layer
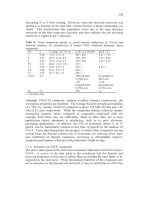
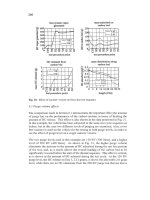
fraction. Figure
31
shows the dependence
of
R
on
single layer fraction for the
calculated patterns
in
Fig.
30,
and for another set
of
calculated patterns (not
shown)
where the fraction
of
carbon
atoms
in bilayers and trilayers was taken
to
be
%(l-f)
[12].
Both curves in
Fig.
31 clearly
show
that
R
decreases as the
single layer content
of
the sample increases and
is
fairly insensitive
to
how the
carbon is distributed
in
bilayers and trilayers.
3
82
Fig.
30.
Calculated
(002)
Bragg peaks for various single layer fractions
of
the sample
from reference 12.
The
calculations assumed that a fraction, f, of the carbon was in
single layers and that fractions 2/3(1-f) and
1/3(1-f)
were included
in
bilayers and
trilayers respectively.
3.5
2
Layer,
0.67(1-f);
3 Layer, 0.33(1-f)
3.0
PL
0
F
2.5
-
a
w
0
>
4
2.0
-
4
x
e
e
0
1.5
-
I
0.2
0.3
0.4
0.5
0.6
0.7
SINGLE LAYER FRACTION
Fig.
31.
The dependence
of
R
on
single-layer fraction for the calculated patterns
of
Fig.
30
,
and for a second set
of
calculations where the fraction of carbon atoms
rn
bilayers
and trilayers
is
equal
[12].
3
83
5.3
Mechanism
of
lithium insertion
The materials made near
1000°C
from the three resins have little hydrogen
content. These materials show bgh capacity (up to
550
mAh/g), little charge-
discharge hysteresis, and appear well-suited for application
in
lithium-ion
batteries. The mechanism for lithium insertion on the low voltage plateau is
believed to be the adsorption of lithium onto internal surfaces of nanopores
formed by single, bi, and bilayer graphene sheets which are arranged like
a
"house of cards" as shown in Fig.
24.
Additional samples were prepared from the three resins and were heated at
temperatures between
940"
and
IIOO",
under different inert gas flow rate and
with different heatmg rates. The samples have different microporosities and
show different capacities for lithium insertion. The results for all the carbons
prepared
from
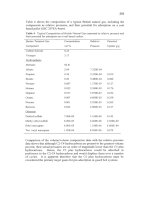
resins are shown in Fig.
32,
which shows the reversible capacity
plotted as a function
of
R.
The reversible capacity for Li insertion increases
as
R
decreases. This result
is
consistent with the result reported in reference
12,
0
0
0
I-
0.
O
4
p1
500
e.
0
0
0
0
0.
1.3 1.4 1.5 1.6 1.7 1.8
R
Fig.
32.
Reversible capacity of microporous carbon prepared from phenollc resins
heated between
940
to
1100°C
plotted as a function
of
the X-ray ratio
R.
R
is
a
parameter which
is
empirically correlated to the fraction
of
single-layer graphene sheets
in the samples.
3
84
which suggusts that Li atoms can be adsorbed onto the internal surface of
micropores in the hard carbon samples as shown
in
Fig. 24. If there are more
micropores (or small
R
for the sample), then the capacity is larger.
A
lithium cluster in the micropores
of
the carbon sample has a very similar
environment as lithium atoms in metallic lithium. Hence, we observe long low-
voltage plateaus on both discharge and charge for lithium insertion in the
microporous carbon.
Since these materials have significant microporosity, we expect their bulk
densities to be low.
For example, the tap density (100 taps) of BrlOOO was
measured to be 0.81 glcc, compared to 1.34 glcc for the synthetic graphitic
carbon powder, MCMl32700, measured by the same method.
6
Carbons
Used
in Commercial Applications
Most commercial lithium-ion cells maufactured today use graphitic carbons
from region 1 of Fig. 2. These are of several forms, with mesocarbon
microspheres and natural graphites being the most commonly used. The
specific capacity of these carbons is near 350 mAWg.
Sony Energytec uses a disordered hard carbon of the type described
in
region 3
of
Fig.
2.
These carbons have been produced by a number of Japanese
manufacturers including Kureha [4 11 and Mitsubishi Gas [40]. Our recent work
[44], and other work
in
the patent literature shows how such carbons can be
produced from natural precursors like sugar and wood. This suggests that it
should ultimately be possible to prepare such carbons very cheaply. The
specific capacity
of
region-3 carbons which are in commercial production are
around 500 mAWg.
There are numerous alternatives to pure carbons for use in Li-ion batteries,
Wilson et al. 1451 have
shown
how disordered carbons containmg silicon
nanoclusters can use the large alloying capacity of silicon for
Li,
in addition to
the insertion capacity
of
the carbon itself. These materials can have reversible
capacities up to 500mAWg. They are prepared by chemical vapor deposioon
methods and hence are a lab curiosity at the moment. In an effort to make these
materials more practical, Wilson et al.
[46]
examined the products of the
pyrolysis of siloxane polymers and found they could have reversible capacihes
near
600
&g.
A
recent patent filing by Selko [47] showed that Si0 (a
mixture of nanometer sized amorphous Si and amorphous SiO, regions within
particles) has a voltage of about 0.3V versus Li metal and a capacity for lithium
near
11
OOmAWg. Our preliminary experiments have confiied this result, but
385
do not show good cycle life. In another recent patent filing, researchers at Fuji
[48]
have shown that SnO, SnO, and amorphous SiSnO, all have large
reversible capacities
(>
500
mAh/g)
for lithium below about
0.8V. Fuji
has
even announced plans to commercialize a cell with one of the anodes described
in ref.
48.
It is clear that there is enormous activity
in
the the search for better and cheaper
anode materials
for
Li-ion batteries. In fact, it is not certain at this time whether
carbon will remain the material of choice for this application.
Nevertheless,
large strides toward the opfimization and understanding of carbons for Li-ion
batteries have been made in the last
5
to
10
years.
If continued progress
is
made, we can expect to see carbon materials in Li-ion batteries for a long time
to come.
7
1.
2.
3.
4.
5.
6.
7.
8.
9.
10.
11.
12.
13.
14.
15.
16
17.
18.
19
References
T. Nagaura and
K.
Tozawa, Prog. Batt. Solar Cells 9,209 (1990).
J.R. Dahn, A.K. Sleigh, Hang Shi, B.W. Way, W.J. Weydanz, J.N. Reimers,
Q.
Zhong, and
U.
von Sacken, “Carbons and Graphites as Substitutes for the
Lithium Anode”, in
Lithium Batteries,
G.
Pistoia, Elsevier, North Holland
S.
Hossain, “Rechargeable Lithium Batteries (Ambient temperature)”, in
Handbook
of
Batteries,
2nd edition, D. Linden, McGraw-Hill Inc.
(1
995).
J.R. Dahn,
U.
von Sacken, M.W. Juzkow, and
H.
Al-Janaby, J. Electrochem.
Soc. 138, 2207
(I
991).
J.R Dahn, Tao Zheng, Yinghu Liu, J.S. Xue, Science 270, 590 (1995).
Tao Zheng, J.N. Reimers, and J.R. Dahn, Phys. Rev. B 51, 734-741 (1995).
Tao Zheng and J.R. Dahn, Phys. Rev. B53,3061-3071 (1996)
Tao Zheng, Yinghu
Liu,
E.W. Fuller, Sheilla Tseng,
U.
von Sacken, and J.R.
Dah, J. Electrochem. SOC. 142,258
1
(1995).
Tao Zheng, J.S. Xue, and J.R. Dahn, Chemistry
of Materials,
8,
389 (1996)
Tao Zheng, W.R. McKinnon, and J.R. Dahn,
J.
Electrochem SOC., 143 (71,
Tao Zheng,
Q.
Zhong, and J.R. Dahn, J Electrochem. SOC. 142, L21l (1995).
Yinghu Liu,
J.S
Xue, Tao Zheng,
and
J.R. Dahn, Carbon 34, 193
(1
996).
Tao Zheng,
W.
Xing and J.R. Dahn,
Carbons
Prepared from
Coals
for Anodes
oflithiurn-Ion
Cells,
Carbon, 34(12), pp. 1501-1507 (1996).
Hang
Shi, Ph.D. Thesis, Simon Fraser University (1993).
Hang Shi, J.N. Reimers, and J.R. Dahn, J. Appl. Cryst.
26,
827 (1993).
P. Scherrer, Nachr Gottinger Gesell., 98 (191
8).
B.E.
Warren, Phys. Rev. 9,693 (1941).
B.E.
Warren,X-RayDiSfraction,
p. 254, Dover, N.Y. (1990).
A. Guinier,
G.
Fournet,
Smalldngle
Scatterzng
of
X-Rays
Sons,
N.
Y.,
1955).
(1993).
pp. 2137-2145 (1996).
(John Wiley
&
20.
21.
22
23.
24.
25.
26.
27.
28
29.
30.
31.
32.
33.
34.
35.
36.
37.
38.
39.
40.
41.
42.
43.
M. Kalliat, C.Y. Kwak and P.W. Schmidt,
in
“New Approaches in Coal
Chemisty”,
edited by B.D. B laustein, B.C. Bockrath and
S.
Friedman,
American Chemical Society, Washington,
D.C.,
p. 3, (1981).
R.E. Franklin,
J.
Chem. Phys. 47,573 (1950).
For examples, see paper in volumes
1
and 2 in
Chemisty and Physics
of
Carbon,
edited by P.L. Walker, Jr., Marcel Dekker Inc., N.Y. (1965, 1966).
B.E. Warren,Phys. Rev. 9,693 (1941).
E.
Peled,
J.
Electrochem. SOC. 126, 2047 (1979).
R. Fong, U. von Sacken, and J.R. Dahn,
J.
Electrochem. SOC. 137, 2009
(1
990).
R.C. Boehm, and
A.
Banerjee,
J.
Chem. Phys. 96, 1150 (1992).
Tao Zheng, and J.R. Dahn, Synth. Met. 73,
1
(1995).
S.
Yata, H. Kinoshita, M. Komori,
N.
Ando, T. Kashiwamura, T. Harada, K.
Tanaka, and T. Yamabe, Synth. Met. 62, 153 (1994).
A. Mabuchi, K. Tokumitsu, H. Fujimoto, and T. Kasuh, In Proc. 7th Int.
Meeting on Lithium Batteries, May 15-20 (1994), Boston,
USA,
paper I-A-10,
p. 207 of ext. abs.; also see
H.
Fujimoto, A. Mabuchi, K. Tokumtsu, and T
Kasuh, ibid, paper 11-B-12, p. 540.
K.
Sato, M. Noguchi, A. Demachi,
N.
Oki,
and
M.
Endo, Science 264, 556
(1994).
J.S.
Xue, A.M. Wilson, and J.R. Dahn, Canadian patent application, filed May
20 (1995).
B.R. Puri, “Surface Complexes on Carbons”, in
Chemisty and Physics
of
Carbons,
edited by P.L. Walker, Jr.,
Vol.
6, Marcel Dekker Inc., N.Y. (1970)
For example, see Tao Zheng’s Ph.D. Thesis, Simon Fraser University, Canada
(1
996).
R.E. Franklin, Acta Cryst. 4,253 (1951).
R. Diamond, in
Proc. Third Con$
on
Carbon,
p. 367, Buffalo, New York
(1957), published by Pregammon Press, New York (1959).
T. Enoki, S. Miyajima, M. Sano, and H. Inokuchi,
J.
Mater. Res. 5,435 (1990).
P. Papanek, M. Radosavljievic, and
J.E.
Fischer,
Chem. Mater.,
8(7), pp. 1519-
1526 (1996).
L.S.
Selwyn, W.R. McKinnon,
U.
von Sacken, and C.A. Jones, Solid State
Ionics 22, 337 (1987).
A
Omaru,
H.
Azuma,
M.
Aoki, A. Kita, and Y. Nishi, paper #25, 182”d
meeting
of
the Electrochemical Society, Toronto, Canada. Extended Abstracts
of
Battery Division, p. 34 (1992).
Y.
Takahashi,
J.
Oishi,
Y
Miki,
M.
Yoshimura,
K.
Shibahara, and H.
Sakamoto, 35“ Battery Symposium in Japan, Nov. 14-16, Nagoya, Japan,
paper
2B05,
extended abstracts, page 39 (1994).
N.
Sonobe,
M.
Ishikawa, and
T.
Iwasaki, 35” Battery Symposium in Japan,
Nov. 14-16, Nagoya, Japan, paper 2B09, extended abstracts, page 47 (1994).
E. Fitzer, W. Schaefer, and
S.
Yamada, Carbon 7, 643 (1969).
U.
von Sacken, Q. Zhong, Tao Zheng, and J.R.
Dahn,
PhenoZic Resin
Precursor Pregraphitic Carbonaceous Insertion Compounds and Use as
Anodes in Rechargeable Batteries,
Canadian Patent Application #2,146,426
(1995).
387
44.
Weibing Xing, J.S. Xue and J.R. Dah,
Optimizing Pyrolysis
of
Sugar Carbons
for Use as Anode Materials in Lithium-Ion Batteries,
J.
Electrochem SOC.,
143, 3046 (1996);
Weibing Xing, J.S. Xue, Tao Zheng, A. Gibaud and J.R.
Dahn,
Correlation between Lithium Intercalation Capacity and Microstructure
in Hard Carbons,
J.
Electrochem. SOC.,
143,3482 (1996).
A.M. Wilson and J.R. Dahn,
J.
Electrochem. SOC.
142,326 (1995).
A.M. Wilson, J.N. Reimers, E.W. Fuller and J.R. Dahn, Solid State Ionics,
74,
249 (1 994).
K.
Tahara,
H.
Ishikawa,
F.
Iwasaki,
S.
Yahagi, A. Sakata, and
T.
Sakai,
European Patent Application
#93 11 1938.2, (1993).
Y.
Idota,
M.
Mishima,
Y.
Miyaki,
T.
Kubota and
T.
Miyasaka, Canadian
Patent Application
2,134,052 (1994).
45.
46.
47.
48.
389
CHAPTER
12
Fusion Energy Applications
LANCE
L.
SNEAD
Oak Ridge National Laboratory
P.Q. Box
2008
Oak Ridge, Tennessee
37831-6087,
U.S.A.
1
Introduction
1.
I
Background
When
two
light elements collide with sufficient energy they may "fuse" and
form
a krd, heavier, element.
A
simple mass balance would show that there is a small
mass
loss
in
this process, correspondmg to a significant energy release. Many light
elements can undergo exothermic fusion reactions, but fusion of the isotopes
of
hydrogen and helium are the easiest reactions to induce. The most probable fusion
reactions
and
their released energies are:
1H'
+
1H'
+
1D2
f
positron
=
1.4
MeV
1H'
+
ID2
+
2~e3
=
5.5MeV
IH'
+
1~3
+
2~4
=
19.9MeV
1D2
+
1D2
+
2He3
+
neutron
=
3.3
MeV
ID2
+
ID2
+
1~3
+
IH'
=
4.0MeV
1D2
+
1T'
+
2He4
+
neutron
=
17.6MeV
ID^
+
2~~3
+
2~~4
+
H
=
18.2MeV
Fusion requires high temperature (energies) to cause the atoms to bind together.
The likelihood of atoms fusing together is hghly dependent on the individual
isotopes and their temperature. It can be shown that the D+T reaction
is
the easiest
reaction to drive. However, the inherent rahoactivity and expense of tritium has
restricted its use, while the lighter hydrogen isotopes have been extensively used.
The gaseous temperatures required for
D+T
reaction are related to the kinetic
energy
of
the ions, and are in excess
of
50 million degrees Kelvin. While
significant power has been produced from fusion systems, the total amount of
power produced in any reactor is much less than the power added to the system to
drive the fusion process. The cvent goal of fusion programs worldwide is to
achieve "ignition," where the plasma begins a self-sustaining burn
from
which
more power
is
generated than consumed in the fusion process.
390
Carbon materials in the form of graphite have played a major role in fusion systems
as armor to keep higher atomic number elements from entering into, and
extinguishing, the high temperature reactant gases know as the plasma.
Although
there are many benefits to the use of graphite in fusion systems, there are also
significant design challenges and drawbacks. Significant progress has been made
toward demonstrating self-sustaining, power-producing, fusion plasmas. Much of
the progress can be attributed to the use of graphite and carbon-fiber composites
(CFCs),
as well
as
other low atomic number plasma-facing materials such
as
beryllium. With the use of advanced materials, it is possible that the next planned
experiment, the International Thermonuclear Experimental Reactor (ITER), will
demonstrate an ignited fusion plasma and provide a test bed for a demonstration
fusion power reactor.
1.2
Current and planned fusion machines
The containment of very high-temperature, high-density plasmas and the
maintenance of a near steady state plasma condition (thus enabling the fusion
reaction) are the greatest challenges to fusion power. Many reactor concepts have
been studied in the past and attention is now focused on the "tokamak" system.
This
toroidal confinement system was developed
in
the mid-1960s in Russia. The
basic concept of the tokamak is
to
confine within, and couple the plasma ions to,
continuous magnetic field lines which travel helically through a toroidal vacuum
vessel. For a non-collisional plasma, the ions can therefore be heated by various
external means to the extreme temperature necessary for the fusion reaction to take
place. The tokamak concept is the basis for the four largest present day fusion
machines (Table
I),
and
is
the premise for the proposed ITER machine currently
under design by the European
Community,
Japan, Russia, and the United States.
The ITER design calls for a tokamak with an inner plasma chamber diameter (twice
the minor radius) of about 6 meters, and a machine standing well over twenty
meters.
1.3
Plasma-facing components
The greatest effort in the development of fusion energy has been
in
the enormously
challenging area of plasma physics and plasma confinement. It is clear that perfect
containment of a fusion plasma is impossible, and that interactions between the hot
ionized plasma gas and their surroundings will take place. In confinement systems
such as the tokamak, this interaction point is very close to, and in some cases
defines, the edge of the plasma. The components which are in line of sight of the
plasma, and therefore impacted by the hot gasses and particles, are called plasma-
facing components (PFCs) or plasma-facing materials (PFMs). The reactions
between the fusion plasma and the PFMs are severe and typically cause melting or
sublimation, component mechanical failure due to high thermal stress, and
391
excessive surface erosion. The plasma ion flux and associated heat loading to the
plasma-facing materials is highly non-uniform and quite dependent on the tokamak
design.
The hot plasma gasses are made up of unburned hydrogen fuel, fusion byproducts
such as helium, plasma electrons and impurity elements previously removed from
PFCs, and plasma electrons. As can be seen in Eq.
1,
the type of particles which
may strke the PFMs are dependent on the fusion fuel. For the D+T fuel system,
the plasma
will
contain not only the
D+T
fuel, but high energy alpha particles
(3.5
MeV He) and neutrons (14.1 MeV). The partitioning
of
the reaction energy
between helium and the neutron is both an advantage and a disadvantage for the
D+T fuel system. Because the energetic helium nucleus quickly collides with the
surrounding gasses, most of its energy remains in the plasma and helps to sustain
a high plasma temperature.
Conversely, the neutron has very little chance of
collision
in
the low density plasma and loses its energy outside
of
the plasma
(usually over meters
of
path length inside the structure of the reactor). Because less
than
30%
of the D+T reaction energy remains in the plasma, only
this
fraction is
eventually distributed on the PFCs, thus reducing the heat load handling
requirement and material erosion. However, as discussed in Section
3
of
this
chapter, the material damage associated with the 14.1 MeV neutron collisions is
significant and offsets the reduced
D+T
heat loading.
Fusion devices can be characterized by how the plasma edge is defined and how
the impacting flux and heat are handled.
The classic approach is to define the
plasma edge by placing a sacrificial component in contact with the plasma. This
component, which intercepts the plasma edge particle flux, is
hown
as a bumper
or
bumper limiter, and extends circumferentially around the torus.
A
second
approach to defrning the plasma edge is to magnetically capture and divert the edge
plasma onto a divertor plate well removed from the central plasma. Once the
plasma gasses are cooled they can be pumped away. The point on the "divertor"
where the particle
flm
strikes experiences a significant ion heat loadmg, and many
techniques such as magnetic sweeping to spread the loading and puffing of gas to
%often'' the ion impact have been used to reduce the particle flux and energy.
Regardless
of
whether the limiter or divertor design is employed, the majority of
the particle and heat
flux
is intercepted by these components (Table
1).
However,
a
sigmficant
flux
also impacts the balance of the torus lining (generally referred to
as the fmt wall). Because of cross field difhsion and other mechanisms (Table
1)
the thermal loading and resulting thennomechanical requirements for the fist wall
are not
as
severe.
A
convenient comparison for the heat loadings given in Table
1
is the maximum output from a conventional propane torch, which
is
approximately
10
MW/mz, or about the maximum heat flux seen in current fusion devices.
w
\o
h)
Table
1.
Materials and heat loads for the major fusion machines world wide (see Section 1.3 for definitions
of
divertor and first wall)
Divertor or
First Wall Limiter
Heat Load
First
Wall Heat Load Divertor of Limiter
Fusion Machine Country Fuel System
(MW/m2)
Material (MW/m2) Material
ITER (proposed) International DID
&
D/T
0.6
TBD
15-30
TBD
DIII-D U.S.A. D/D 0.6 Poco ATJ 5.3 Poco ATJ
JT-60U Japan
Dunlop
DMS704
Hitachi HCB-18s
Ibiden ETP- 1
0
Showa-Denko
CC3 12
JET European D/D Negligible Dunlop
DMS-704
18 Dunlop DMS-704
Community Sepcarb
N
1
1
(located
in
Sepcarb N11-s(3D)
England)
FMI 4-D
TFTR
U.S.A.
D/D
&
D/T POCO
AXF-5Q
393
I.
4
Particle/matter interactions
The particles which collide with the plasma-facing components will be highly
energetic and capable of inflicting severe damage to the bulk and near surface layer
of the PFM. The greatest
flux
of particles in a steady state system will be from the
plasma fuel. The energies
of
the impacting hydrogen depends on many variables,
though will most likely be
in
the range of hundreds of electron volts (eV), which
corresponds to ion speeds of hundreds
of
kilometers per second. Helium ash (burnt
fuel) will likewise have high surface impact energies. Electrons, which are
in
number density equilibrium with the plasma ions, also travel along the plasma field
lines, albeit in the opposite direction, and are lost to impacts with the PFMs. The
high energy neutrons present in the D+T reaction
(14.1
MeV), or those
of
the D+D
reaction
(2.4
MeV), have mean free paths
of
several centimeters
in
graphite, and
so
will typically not interact strongly with the first wall. However, these neutrons
will be back scattered and slowed down behind the Fist wall resulting
in
a
nearly
isotropic
flux
of high energy neutrons throughout the
fist
wall and first wall
structure. The reaction of the plasma neutrons, ions, and electrons with graphite
PFMs (which are discussed in some detail in the following sections) can cause a
wide range of effects. Assuming that the
PFM
is capable of handling the heat loads
generated by the plasma, these effects include physical and chemical erosion of the
first wall and thermomechanical property degradation of the bulk and surface
material.
The &cussion thus far has been limited
to
the operation of tokamaks in the quasi-
steady state (long pulse.) All present-day large tokamaks are pulsed machines with
pulse lengths of no more than a few seconds, where the plasma discharge consists
of
a rapid heating phase, a steady state, and a cool down phase. In this case the
heat flux is approximately uniform around the circumference of the machine and
scales with the machine power. However, a significant number
of
these plasma
shots end
in
an abrupt and somewhat violent fashion, referred to as a disruption.
When this occurs the plasma becomes rapidly unstable and instantaneously
"dumps" its entire energy onto the
PFC.
Disruptions cause significantly larger heat
loads than normal operation, and in many cases defines the design limits for these
components. In the ITER it is assumed that the plasma conditions can be
controlled such that of the
10,000
or so
400
second pulses expected
in
the physics
phase of the machine
[
11,
the number of disruptions can be limited to about
500.
In ITER a second assumption has been made regarding the disruption electrons.
These electrons will have energies approximately the same as the plasma ions
during normal operation, but because of their extremely fast reaction times can
reach energies
in
the GeV range during disruptions. During such disruptive
situations the electrons reach relativistic velocities and may focus
on
small areas
of the tokamak which are totally incapable of handling the localized heat load. In
some cases melting (or sublimation) of the PFC, as well as the underlying structure,
has occurred.
For
ITER,
rather restrictive limits on the energy and energy
deposition from these "runaway" electrons have been assumed.
2
The Advantages
of
Carbon
as
a Plasma-Facing Component
2.
I
Plasma-facing materials
as
plasma impurities
A
fusion reactor must
first
heat and confine the plasma. However, it must
additionally maintain the plasma
in
an impurity free condition. Fusion plasmas are
heated both internally by the fusion reaction products
(Le.,
the
3.5
MeV
helium
nucleus from the D+T reaction) and externally, by means such as induction, radio
frequency waves,
or
neutral particle injection.
Plasma heating is balanced by
plasma cooling mechanisms, of which electromagnetic radiation dominates. In a
fully ionized plasma the radiative cooling comes from the Bremsstrahlung,
or
breaking, radiation which occurs when the energetic ions interact with the plasma
electrons.
A
fraction of the electromagnetic radiation released
fkom
this
interaction
is
lost from the plasma. The energy lost fkom the plasma in
this
ma.nner
is
significantly increased by low concentrations of impurities.
The
plasma power loss
due to Bremsstrahlung radiation,
P,,
may be written
:
P,,
(MW/m3)
4.8
x
Z:NiN,T,1/2
=
Z;Ni
where
Zi,
N,, N,
and
T
are the atomic number of the radiating species, their
density, the electron density, and the plasma temperature, respectively.
It
is
apparent from
Eq.
2
that low plasma impurity
mass
and density are beneficial.
Because
of
the
ZZi
dependence, plasma impurities greatly impact the amount
of
cooling.
The
choice of plasma-facing material, which
is
the source of many of the
plasma impurities,
is
limited by the product
ZiWi.
Ideally, plasma-facing materials
should be light elements
and
have a low tendency to migrate into the plasma.
Carbon and beryllium are
two
low atomic number elements which are commonly
used in tokamaks. The next suitable element is aluminum, which would have
almost a factor
of
five higher radiative loss on an atom per atom basis compared
to carbon. On the same basis molybdenum, which has been
used
in
many
tokamak
experiments, has a
loss
factor
of
49
times that
of
carbon, and tungsten
150
times
the radiative
loss
of
carbon. However, this assumes that the same number of
impurity atoms
find
their way into the plasma
(i.e.,
Ni)
which, as
is
discussed later,
is
material dependent.
2.2
Normal
thermomechanical loading
Under normal operating conditions the fist wall must handle high plasma surface
heat
fluxes
(Table
l),
as well
as
volumetric heat loadings due to the penetrating
neutron and electromagnetic radiation. The volumetric heat loading
is
dependent
395
on
line-of-sight distance from the plasma, and can be as high as several MW/m2.
These surface and volumetric heat loadings
will
induce a temperature gradient, and
corresponding thermal stress, across the PFC, and stresses at the interface between
the plasma-facing material and the heat
sink.
For example, if one assumes an ideal
case of a 2.5-cm thick, infinitely wide graphite plate which is perfectly bonded to
a 50°C copper heat
sink,
the thermal stress at the graphite-copper interface for a
heat flux of
5
MW/m2 has been shown to be 200 MPa
[l].
The ability of the PFC
to withstand
this
heat flux and thermal stress will depend both
on
the material
properties and the component design. The two most significant design parameters
are the thickness of the PFM and how it is attached to the heat
sink.
The material
properties (which to some extent can be engineered to optimize thermal conduction
to the heat
sink,
strength, and thermal expansion transverse to the interface) are
strong functions of temperature.
As
discussed later in Section
3,
these properties
are also dependent on radiation displacement damage.
A
candidate design for the
ITER
divertor is shown in Fig.
1.
In this design, the heat flux strikes the surface
of carbon-fiber composite or graphite blocks and the heat flows into a water cooled
copper tube which has been brazed inside the block. The PFC is bolted to a
stainless steel support structure. This configuration of PFC is called the monoblock
structure, as compared to the flat plate and saddle types inset into Fig.
1.
Fig.
1.
Schematic diagram of the proposed first wall for the
ITER
reactor.
396
To
provide a quantitative comparison
of
candidate PFMs, a number
of
figures
of
merit
(A)
have been derived. One
of
which
may
be written:
=
aE(1
-v)
(3)
where
K
is
the thermal conductivity,
ay
the yield strength,
a
the thermal expansion
coefficient,
E
the Young's modulus, and
v
the Poisson's ratio. High values
of
A*
indicate the best candidate material. Figure
2
shows a comparison
of
the three
primary candidate PFMs: graphite, beryllium, and tungsten. Graphite has been
further broken down into fine- and coarse-grained graphites (POCO and
H451
respectively) as well
as
a high quality
1-D (MKC-1PH)
and balanced
3-D
(FMI-
222)
carbon-fiber composites (CFC). In Fig.
2
it
has
been assumed that the high
thermal conductivity direction
for
the
1-D
CFC is oriented normal to the surface
of
the PFC. From Fig.
2
it is apparent that the high quality graphites and
composites, which possess high strength and thermal conductivity, edubit
A,
considerably higher than either beryllium
or
tungsten.
106
Mitnubish>
Kain
hlKMPH
ID-UC
FMI-PZ.
3D.CK
io5
AXT-59
Cmphitc
104
1000
200
300
400
500
600
700
800
900
1000
Application
Temperature
(C)
Fig.2.
Thermal stress figure
of
merit for selected plasma facing materials
397
2.3
nemal
shock
As
discussed in the introduction, disruptions cause the most severe
thermomechanical loading experienced in a tokamak. In each of the
500
or
so
disruptions expected in ITER, approximately 10-20 MJ/m2 will be deposited onto
the frst wall in
0.01
to
3
seconds. Such a disruption will cause very high thermal
stresses and significant material erosion (Section 4).
As
these events are transient
in
nature, the ability of the PFC to withstand the disruption depends on the
material's ability to both conduct and to absorb the deposited heat, before reaching
a temperature or stress limit. For comparative purposes, a disruption figure
of
merit takes this
into
account
:
where
ou
is
the ultimate tensile strength, C, the specific heat,
p
the density,
K
the
thermal conductivity,
a
the thermal expansion coefficient, and
E
is the Young's
Modulus.
Figure
3
reports th~s disruption figure of merit to the materials
in
Fig.
2.
Consistent
with the results of the thermal
A,,,,
high-quality, high-thermal conductivity
composites and fine-grained graphites perform better than standard and larger
grained graphtes, and exhlbit an order of magnitude better
Ad
than beryllium and
tungsten.
As
discussed later
in
Section 4, the erosion of graphite and beryllium are
very hgh and dictate the use of thck tiles in high
flux
areas. This is
in
contrast to
tungsten, which has a relatively low erosion yield, allowing an armor thickness of
only
a few millimeters. Because the
A
are essentially calculated on a per unit tile
thickness, it is somewhat misleading to compare tungsten with graphite. However,
because graphite and beryllium are erosion-limited, the
A
and the melting
temperatures are useful evaluation tools. While the sublimation temperature
of
graphite
(-3350
"C)
is
comparable to the melting point of tungsten (-34OO"C), it
is clear that beryllium, which has a melting point
of
-13OO0C, is at a dutinct
disadvantage. Removal of beryllium, as well
as
other metallic PFCs, by melting
has been seen in several large experimental devices.
Performance evaluations
of
graphite and CFCs have been conducted in both
laboratory test stands and
in
operating tokamaks. Some experimental data
generated using an electron beam facility are given in Fig. 4. The power is
deposited by a rastered electron beam for approximately one second up to surface
heat loads of 11
MWlm2.
The samples were
2.5
x
2.5-cm tiles facing the beam and
were
1
cm in thickness. Each sample had a large notch machined into one edge
(the highest stress area) to serve as a stress intensifier. It was noted that without the
notch, the graphites did not crack. Figure
4
gives the maximum heat flux at which
each material was tested, and whether cracking
of
the tile occurred. The data
indicate that CFC materials and higher thermal conductivity, high-density graphites
are superior. Cracking did not occur in the three composites studled, nor in the
two
FMI
graphites, to the
maximum
power density applied. The superior performance
of the composite materials agrees with the performance
of
CFCs
in
the large
tokamaks
such as
TFTR
and
JT-60U.
The superior performance of the CFCs and
the graphites is most likely because of their low thermal expansion coefficient and
high strength. Also, the presence
of
the fibers in the CFCs may serve to blunt and
arrest cracks, thus increasing toughness. All monolithic graphites shown in Fig.
4,
with the exception
of
the two FMI-HDFG materials, cracked. It is interesting to
note that this graphite possessed the highest
A,,
even higher than that of the
composites. However, strict correlation of improved performance with increased
Ad
was not seen, although a loose correlation was noted. As pointed out by Watson
[2],
the CTE
may
be the most dominant property, with the lowest
CTE
graphites
showing the best resistance
to
thermal shock.
31hL
Stainless
Std
10'
MKC-IPH
:lD-UC
Mitsubishi Kabei
Fiber Materialb
FMI.222
'
w-CIC
Unoca1,Poca
AXF-SQ:
Graphite
BNsh
WeUrnan
S65C:
Wrought
Ee
200
300
400
500
600
700
800
900
1000
Application
Temperature
(C)
Fig.
3.
Thermal shock figure
of
merit
for
selected plasma facing materials.
399
Finally, it should be noted that there are many issues regarding the selection of
carbon materials as PFCs other than their thermal shock behavior. For example,
the issues of radiation damage, erosion, and hydrogen retention are three leading
drawbacks to the use of graphite as a PFC, and are discussed in the following
sections. One issue, which will not be addressed in this chapter, is that of the
attachment of the PFC to the heat
sink.
For most present day machines bolting or
similar mechanical fastening is used. However, for next generation machines the
anticipated heat loads are much higher, and physical bonding
(e.g.,
brazing) of
PFMs to a water-cooled substrate will be required. One may appreciate the
magnitude of this issue from the initial
ITER
design, which calls for many
thousands of graphite or CFC tiles to be brazed to the heat
smks.
When
considering
this
large number of tiles, the anticipated large thermal and disruption
loading, and the long repair time required if any one tile becomes detached, it is
obvious that the robustness of the attachment is a critical issue.
CRACKISG RANGE
FAILURE
KANGE
1
NOCRACKING
0
2
4
6
8
10
‘12
POWER
DENSITY
(kW/crn’)
Fig.
4.
The performance
of
several grades
of
graphite and graphite composites subjected to
thermal shock loading.
400
3
Irradiation Effects on Thermophysical Properties
of
Graphite and Carbon
Fiber Composites
3.1
Radiation
displacement
of
atoms
Radiation effects
in
the graphite PFM can be categorized as near surface damage
caused by interaction with the plasma, andlor bulk displacements caused by
neutrons emanating from the plasma or back scattered by the surrounding structure.
Amongst present day machines, only the
TFTR
has significant
D+T
fusion
reactions and, therefore, experiences a damaging
flux
of
fusion neutrons (see
Eq.
1).
However, because
TFTR
will undergo only a limited number of low power
plasma
"shots,7'
the neutron dose will not be high enough for the
PFCs
and
structural materials to experience appreciable neutron damage. In contrast,
however, machines such as the
ITER
will experience significant neutron doses.
Moreover, the next generation
D+D
machines such as the proposed
TPX,
will yield
enough tritium to produce
(D+T
and
D+D)
fusion neutrons at levels sufficient to
alter graphite properties.
High energy particles which travel through matter can interact with their
surroundings.
As
the particles interact with matter they lose energy (per unit path
length)
in
three ways: elastic collisions, electron excitations,
and
nuclear
interactions. The interaction which is of primary interest from the materials point
of view are the elastic collisions. If an ion or a neutron
imparts
Sufficient energy
to overcome
an
atom's binding energy
(Ed
carbon
=
20
-
30
ev), the carbon is
displaced
from
its original lattice position. If the energy transferred to the
displaced atom (less
its
binding energy) is sufficient to displace
further
atoms, a
series
of
displacement events or a "cascade" occurs.
In
the simplest interpretation,
the Kinchin-Pease
[3]
model is used to calculate the total number of atoms
displaced. For example, if a carbon atom were ejected by the plasma and re-
impacted onto
the
carbon tile with a kinetic energy
E
of
1
KeV, the estimated
number of atoms displaced
(n)
is estimated as follows
:
n
=
(E/2*Ed)
=
25
atoms
(5)
The interaction of high energy neutrons with matter is very similar to that of ions.
The primary difference between the
two
being the amount of energy transferred in
a single collision, and the distance over which the interactions take place. An ion,
which has a relatively large radius and interacts coulombically, loses its energy
over a short path length (typically less than a micron).
In
contrast, the
comparatively small uncharged
14.1
MeV fusion neutron which undergoes only
simple elastic
or
"billiard baU" collisions,
has
a
mean free path of
-
10
cm.
So,
on
average, a fusion neutron will have
an
elastic collision with a carbon atom once
in
10
cm
of
graphite. The amount of energy transferred to the carbon
in
this
fifst
collision
(Ec)
is calculated by simple elastic theory as:
4x6~1
(6
+
1)'
3
Eocos'a
=
[
]
(14.1
MeV)cos'a
(6)
4momn
Eo
=
[
(me
+
",)'
where
m,
and
rn,,
are the carbon and neutron
mass
(in
mu),
respectively,
E,
is the
neutron energy, and
a
is the angle between neutxon path before and after the
collision. For a totally back scattered neutron (the maximum imparted energy) the
energy transferred to the displaced carbon
is
4
MeV. From Eq. 5, the number of
hsplaced carbon atoms resulting from this
4
MeV neutron displacement event is
approximately
80,000.
The vast majority of these atoms do not stay "displaced,"
but diffuse back into the graphitic structure within a few picoseconds.
To
assess
the effects such collision events have on a material, a convention has been adopted
to compare irradiation doses. The displacement per atom, dpa, is the average
number of times an atom
has
been knocked from
its
original lattice position. The
dpa is an integrated average quantity and takes into account the density, the
interaction cross section, and neutron energy spectrum. It has been estimated that
lifetime displacement levels in
TPX
PFCs
will be about
0.005
dpa, while the
physics phase of
ITER
will
accumulate approximately
1
dpa. In the second phase
of
ITER,
which more closely represents a power producing system, as much as
30
dpa is expected.
3.2 Suglace
efects
In certain areas of a fusion machine
the
PFMs
receive displacement levels much
greater than
100
dpa, but only within the limited collisional range of the plasma
ions,
typically less than a few microns. The effect of
this
high damage level
will
be to reduce a well graphitized structure into one which appears
amorphous.
However, these near surface regions are subjected to erosion either by physical
sputtering (caused by elastic collisions), or by chemical interactions. Both of these
effects are addressed
in
Section
4.
A second surface radiation damage issue
(i.e.,
the ability of the thin damaged surface layer to retain and transport hydrogen) is
discussed in Section
5.
3.3
Effects
of
neutron
displacements
on
graphite
apld
carbon
fiber
composites
As
discussed earlier, the first wall materials in next generation machines will
receive from
0.005
to
30
displacements per atom. At the lower end of this range
(<0.01
dpa) there are essentially
no
mechanical property changes expected
in
graphite materials. However, even at these low doses thermal conductivity and
stored energy are
of
concern. For displacement levels
>0.01
dpa other property
402
changes are sigaificant: strength, elastic modulus, specific heat
(Cp),
CTE,
Poisson's
ratio
(v),
and thermal conductivity.
In
addition, the dimensional stability
under
irradiation
is
important because the induced stresses may be significant, and
because of the need for very tight dimensional tolerances at the plasma edge. It has
been shown in fission neutron experiments that Cp
[4]
and
v
[5]
are not greatly
affected by irradiation. Moreover, only moderate changes in the
CTE
occur, but
the magnitude and nature of the CTE change
is
highly dependent on the type of
graphite
[4,6-81.
The irradiation-induced graphite and CFC property changes which have received
the most study by the fusion community are the dimensions, strength, elastic
modulus, thermal conductivity, and hydrogen retention. A large body of
data
exists
on the thermophysical changes in graphites, coming mainly from graphite
moderated fission reactor development program.
A
smaller body of data exists on
CFCs, mainly from the same source, but with some additional data from fusion
research.
These data suggest that CFCs have similar irradiation behavior to
graphite. In Chapter
13,
Burchell discusses radiation damage mechanisms in
graphite, and some of the specific property changes which
occur.
Because
of
their
special signikance to fusion energy, the remainder of
this
section
will
focus on the
radiation effects in CFCs and on radiation-induced degradation in thermal
conductivity in graphite and CFCs.
3.3.1 Dimensional changes in carbon fiber composites
A
discussed
in
Chapter 13, irradiation-induced dimensional changes
in
graphite are
highly anisotropic, and
a
strong function of irradiation temperature and neutron
dose (dpa). The temperature range of interest for fusion applications varies from
100°C in areas well removed from the plasma, to over 1000°C for the surface of
PFCs which experience appreciable plasma
flux.
The mechanism of graphite
irradiation-induced dimensional change is descriied
in
detail in Chapter 13, and
is
a combination of intra- and inter-crystallite effects. Within the crystallites,
displacement damage causes
an
a-axis shrinkage (within the basal plane) and a
c-
axis growth (perpendicular to the basal plane).
Similar dimensional change behavior has been observed in CFCs
[9].
Figure
5
shows the dimensional change behavior
of
one-,
two-,
and three-directional
composites.
In
this
example, solid cylinders were irradiated at
60OOC
to
doses
ranging from
0-5
dpa and the resulting diameter and length measured. The
behavior of each material can be explained by the accepted theory for dimensional
change
in
graphite (Chapter 13) after taking
into
account the individual fiber
architectures, and by observing that a graphite fiber, PAN-based in this example,
is
basically a filament of circumferential or radial basal planes running pardlel to
the fiber axis. The irradiation-induced dimensional change of such a fiber
is
therefore to
shrink
in length and grow in diameter, as observed for the
403
unidirectional composite
of
Fig.
5.
At doses less than 1 dpa the dimensional
change is relatively minor. As the dose is increased, the direction perpendicular to
the fiber axis is more or less unchanged while a significant shrinkage along the
direction parallel to the fiber axis occurs. At about
2
to 3 dpa swelling in the
composite occurs in the perpendicdar direction. The random fiber composite
of
Fig.
5
has a random orientation of chopped
PAN
fibers in the plane
of
the
composite. The specimen diameter shows practically no change perpendicular
to
the fiber
axis
to about
4.5
dpa, though exhibits
-2%
shrinkage parallel to the fiber
axis. The
3-D balanced PAN-weave fiber
has
essentially isotropic shrinkage to a
dose of
-2
dpa, at which point the diameter
of
the fibers, and hence the sample,
begin to swell.
Also
given in the 3-D composite plot in Fig.
5
is the radiation-induced dimensional
change behavior parallel to the fiber axis
of
an Amoco
P55
pitch fiber composite.
This
material was processed in an identical manner to the PAN fiber composite.
From the plot it appears that the pitch fibers, and thus the composite, undergo
slightly less shrinkage than the
PAN
fiber composite, possibly due to the higher
fiber crystallinity.
This
hypothesis is also supported by the observation that fibers
with hgher final heat treatment temperatures tend to e~bit less dimension change
[
101
and
is
also consistent with the observation that elevating the heat treatment
temperature of graphite reduces the irradiation-induced shrinkage
[
1
11.
3.3.2
Changes
in
strength and modulus
A
marked increase in both strength and elastic modulus occurs in graphite and
CFCs
at dose levels as low as
0.01
dpa
[6].
These increases continue to high
hsplacement levels until volumetric expansion and extensive micro-cracking occur
and the material begins to degrade. Structural degradation typically occurs at
several
to
tens of dpa depending on the graphite type and irradiation temperature.
The initial increase in modulus
is
a result of dislocation pinning by lattice defects
produced by neutron irradiation. The magnitude
of
the increase
is
dependent on
the perfection
of
the graphites. For most graphites a modulus increase
of
2
to
2.5
times the unirradiated value
is
typical for irradiation temperatures less than
300"C,
with the change becoming less pronounced at higher irradiation temperatures.
Irrahation-induced increase in strength occurs
in
a similar fashion as the elastic
modulus. The irradiated and unirradiated mechanical properties of some candidate
ITER
PFC
materials are shown in Table
2.
These materials were irradiated at
approximately
1000°C to a dose
of
about
2
dpa
[12J
The change in properties
is
relatively small because
of
the high irradiation temperature.
3.3.3
Thermal conductivity degradation
The irradiation-induced thermal conductivity degradation
of
graphites and
CFCs
will cause serious problems
in
fusion system
PFCs.
As with ceramics, the thermal
conductivity of graphite
is
dominated by phonon transport and is therefore greatly
404
affected by lattice defects, such as those caused by neutron irradiation. The extent
of the thermal conductivity reduction is therefore controlled by the efficiency of
creating and annealing lattice defects and is, therefore, related to the irradiation
temperature.
1
I , , ,
~'
UNIIXRGCTIONM.
WEER
COMPOSITE
(VFC)
-1
-
-2
0
1
2
3
4
5
0.5
RANDOM
FIBER
(RPC)
MMPOSlTE
-0.5
OPT
0
1
2
3
4
5
0
1
2
3
4
5
Neutron
Dove
(dpaf
Fig.
5.
Neutron irradiation induced dimensional changes in graphite composites.