02 bioprocess scale up
Bạn đang xem bản rút gọn của tài liệu. Xem và tải ngay bản đầy đủ của tài liệu tại đây (144.88 KB, 17 trang )
Published by Woodhead Publishing Limited, 2013
171
1
1
2
3
4
5
6
7
8
9
10
10
1
1
2
3
4
5
6
7
8
9
20
20
1
1
2
3
4
5
6
7
8
9
30
30
1
1
2
3
34R
34R
9
Bioprocess scale up
DOI: 10.1533/9781782421689.171
Abstract: Bioprocesses development is generally initiated
on the laboratory scale and progressively scaled up to
larger volumes at the pilot plant level, and fi nally,
production scale. Transport phenomena are especially
dependent on scale up, with phenomena such as oxygen
transfer, mixing and shear stress altering with the process
scale. Changes in these parameters invariably alter the
microbial metabolism, thereby compromising kinetic
parameters such as yields and productivities. The challenge
of successful scale up is then to retain the optimum kinetics
that were developed at the smaller scale.
To maintain the optimum physiological state of the
microorganism on scale up, all physical and mechanical
variables should ideally remain the same at the larger
scale. Unfortunately, this is not possible and in practice,
the operating ranges of the physical and mechanical
variables that defi ne the preferred physiological state are
maintained on scale up.
Some scale up procedures tend to be largely unsystematic.
At its simplest, scale up procedures rely on trial and error,
using historical data of similar equipment from an existing
plant, or alternatively, multiplication of elements of an
existing process. The former is time consuming and
neither guarantees optimum results. On the other hand,
fundamental models of momentum, mass and heat transfer
Bioprocess engineering
Published by Woodhead Publishing Limited, 2013
172
have been developed to predict performance on scale up.
However, these may be complicated and in some cases not
necessarily reliable for complex turbulent fl ows.
There are scale up methodologies which are considerably
less complex than the transfer models, but nevertheless
provide a systematic approach. One such approach is
based on evaluating the differences in the characteristic
time constants for each phenomenon which has the
potential to control the performance on scale up.
1
For
example, time constants of the same order of magnitude
for oxygen transfer and oxygen consumption suggest that
oxygen transfer limitation is likely to be problematic. If, in
addition, the time constant for liquid circulation is
similarly of the same order, then oxygen gradients are
likely to occur, and so on.
Another methodology of scale up, and arguably the
most well documented, is that in which the specifi c physical
or mechanical property which is most critical to process
performance is identifi ed (termed the scale up criterion)
and maintained constant on scale up. The scale up criteria
most commonly identifi ed are oxygen transfer rate,
mixing, shear stress and, to a lesser extent, fl ow regime.
The scale up criterion of choice depends on the specifi c
circumstances and the Bioprocess Engineer will be required
to use professional experience in judging the optimum
criterion. For instance, a bioprocess with a high oxygen
demand would likely be scaled up to maintain the oxygen
transfer rate established as optimum on the small scale,
while scale up of a bioprocess using shear sensitive
fi lamentous fungi may need to maintain the shear stress at
the threshold value determined on the small scale.
When using a scale up criterion, the scale up is carried
out according to the principle of geometric similarity
between the large and small scales. Geometric similarity
implies identical aspect ratios of the vessel and internals
on both scales, i.e. the ratios of vessel height to vessel
Bioprocess scale up
Published by Woodhead Publishing Limited, 2013
173
diameter, vessel height to impeller diameter, etc., remain
constant on scale up. In this way the effect of different
scales can be evaluated by comparing a characteristic
length, say the impeller diameter (D).
While geometric similarity is a relatively simple and
systematic approach, it is axiomatic that, if geometric
similarity is to be maintained, parameters other than the
scale up criterion will not remain constant on scale up.
The potential exists for the changes in these parameters to
adversely affect the microbial physiology on the large
scale. Cognisance must be taken of the magnitude of the
effect of the altered parameters before the scale up criterion
can be implemented.
In Chapter 9 , the scale up methodology based on the
maintenance of selected scale up criteria according to
geometrical similarity is developed. The scale up criteria
will include: oxygen transfer rate, mixing, shear stress and
fl ow regime. The increases in energy input to maintain the
desired criterion on the larger scale is calculated in each
case and further, the effect of maintaining the specifi c
criterion constant on the other parameters is calculated
and quantitatively and qualitatively assessed. By way of
quantifying the effect of the distinct scale up criteria on
the varying parameters on scale up, the example of scale
up from a 10 L scale to a 10 m
3
scale will be examined.
Key words: geometric similarity, scale up criteria, power
requirement, mixing, shear stress, fl ow regime.
9.1 Scale up with constant oxygen
transfer rate
Frequently scale up of aerobic bioprocesses is executed on
the basis of maintaining a constant OTR (Section 8.1) so
Bioprocess engineering
Published by Woodhead Publishing Limited, 2013
174
that the process does not become limited by oxygen transport
to the cells. Typically the K
L
a rather than the OTR is used as
the design parameter, solubility being a constant in the
system under consideration.
Several empirical relationships relate K
L
a to agitation (in
terms of power per unit volume, P/V) and aeration (in terms
of superfi cial air velocity, V
s
) similar to Equation 9.1.
K
L
a = (P/V)
_
(V
s
)
`
[9.1]
The values of the empirical constants
_
and
`
will differ
depending on the fl uid dynamics, fl uid properties and scale
under which the experiment was conducted so the absolute
values are of little relevance here. Nevertheless, it has
generally been demonstrated that the dependence of K
L
a on
P/V is considerably more pronounced than that on V
s
. In
fact, a threshold V
s
value of 0.6 to 0.8 vvm
2
exists, above
which an increase in V
s
will achieve a negligible increase in
K
L
a and serve only to waste air and/or to generate foaming.
This not only predisposes the wetting and contamination of
air fi lters, but also has the potential to adversely affect the
production kinetics. K
L
a is, therefore, often related
empirically to P/V alone and, as a consequence, maintaining
a constant OTR is equated to maintaining a constant P/V.
P/V is then defi ned as the scale up criterion that needs to be
maintained constant if the small scale OTR is to be maintained
on the large scale.
9.1.1 Effect on power requirements
To maintain oxygen transfer characteristics, it is self-
evident that the power input on the larger scale (designated
2) would be greater than that on the smaller scale (designated
1). To quantify the increase in power input required on
Bioprocess scale up
Published by Woodhead Publishing Limited, 2013
175
the larger scale, P/V on each scale is equated, leading to
Equation 9.2.
[9.2]
The increased power is frequently defi ned in terms of the
increase in impeller diameter. To calculate this, the
relationship between the volume ratio and impeller diameter
of geometrically similar vessels fi rst needs to be determined.
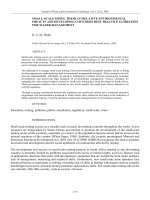
The volume ratio of the two geometrically similar vessels
in Figure 9.1 is given by Equation 9.3. And, since geometric
similarity implies Equation 9.4, Equation 9.3 can be written
as Equation 9.5.
3
[9.3]
[9.4]
Geometrically similar vessels: H
2
/T
2
= H
1
/T
1
;
H
2
/D
2
= H
1
/D
1
Figure 9.1
Bioprocess engineering
Published by Woodhead Publishing Limited, 2013
176
[9.5]
The volume ratio in Equation 9.2 can then be substituted
with the equivalent impeller diameter ratio in Equation 9.5
to yield the increase in power required on the large scale in
terms of the impeller diameter ratio (Equation 9.6).
[9.6]
So, for example, an increase in volume from 10 L to 10 m
3
represents a 10-fold increase in impeller diameter (Equation
9.5). A 10-fold increase in impeller diameter will, according
to Equation 9.6, require a 1000-fold increase in energy input
to maintain the oxygen transfer characteristics on the large
scale.
When oxygen transfer characteristics remain constant on
scale up, such an increase in energy input on scale up will
obviously affect other parameters. The effect on the
parameters most commonly of concern on scale up with
constant oxygen transfer are quantifi ed below for mixing
(Section 9.1.2), shear stress (Section 9.1.3) and fl ow regime
(Section 9.1.4).
9.1.2 Effect on mixing
Mixing performance is characterised by mixing times, where
the mixing time is the time taken to reach a specifi ed degree
of homogeneity after a system change. Consequently, the
effect of mixing on scale up can be quantifi ed by examining
the ratio of mixing times on the two scales.
Mixing time (t
m
) is defi ned as the ratio of the liquid volume
to the liquid volumetric fl ow (or pump) rate of the impeller
Bioprocess scale up
Published by Woodhead Publishing Limited, 2013
177
(V/Q). To defi ne Q in terms of physical and/or mechanical
parameters, use is made of the dimensionless pumping
number (Q/(ND
3
)). In common with all dimensionless
numbers, the pumping number comprises variables which,
when grouped together, form a new variable which has no
dimensional units and which is insensitive to scale.
The pumping number has been correlated with another
dimensionless number, the Reynolds number (D
2
N
l
/
+
)
4
the
value of which defi nes the fl ow regime (laminar, turbulent or
intermediate), where D refers to the impeller diameter. The
pumping number has been shown to be constant at Reynolds
numbers associated with a fully turbulent fl ow regime. Since
turbulent fl ow is invariably experienced in agitated
bioreactors, it can be assumed that the pumping number is
constant and hence, that Q is proportional to ND
3
. Using
this proportionality, the ratio of the mixing times on the
small to large scales can be written as Equation 9.7.
[9.7]
For geometric similarity, the volume ratio equals the
corresponding ratio of the cube of the impeller diameters
(Equation 9.5), and so Equation 9.7 becomes Equation 9.8.
Thus, the mixing times, and hence mixing performance, can
be quantifi ed directly in terms of the inverse ratio of the
rotational speeds at the two scales.
[9.8]
The ratio of the rotational speeds is obtained from another
dimensionless number, the power number (P/N
3
D
5
l
) which,
similar to the pumping number, is constant during turbulent
Bioprocess engineering
Published by Woodhead Publishing Limited, 2013
178
fl ow. A constant power number implies that P is proportional
to N
3
D
5
such that Equation 9.9 applies. Since under constant
oxygen transfer conditions, the ratio of cube of the impeller
diameters equals the ratio of the power input (Equation
9.6),
5
Equation 9.9 can be rearranged to give Equation 9.10.
[9.9]
[9.10]
This expression predicts that when oxygen transfer is used as
the scale up criterion, the same mixing characteristics cannot
be maintained. As the impeller diameter is increased, mixing
effi ciency will decrease according to 1/D
2/3
, or phrased
another way, mixing time will increase by D
2/3
. As an
illustration, a 10-fold increase in impeller diameter would
result in a 4.6-fold increase in mixing time.
During scale up operations, the rotational speed is often
reduced, regardless of the scale up criterion. This is in part
due to the overmixing typical at the small scale. So the lower
rotational speed of the larger reactor does not necessarily
compromise the mixing effi ciency as adequate mixing may
still be provided, despite the increase in mixing time.
However, in viscous or non-Newtonian fl uids, or where solid
substrates need to be kept in suspension (e.g. slurry reactors),
a decrease in mixing capacity may well affect performance.
9.1.3 Effect on shear stress
Since maximum shear is experienced at the highest velocities,
and the highest velocities are associated with those at the tip
of the impeller, the impeller tip speed (ND) is assumed
Bioprocess scale up
Published by Woodhead Publishing Limited, 2013
179
proportional to the shear stress exerted on the cells. So the
ratio of shear stress at the different scales can be quantifi ed
by the corresponding ratio of ND. The ratio of ND can be
determined from the proportionality of P to N
3
D
5
according
to Equation 9.9, which can be rearranged to Equation 9.11.
[9.11]
Since under constant oxygen transfer conditions, the ratio of
cube of the impeller diameters equals the ratio of the power
input (Equation 9.6), Equation 9.11 can be rearranged to
Equation 9.12.
[9.12]
This means that when oxygen transfer is used as the scale up
criterion, as the impeller diameter is increased, shear stress
will increase according to D
1/3
. As an illustration, a 10-fold
increase in impeller diameter would result in a 2.2-fold
increase in shear stress. For shear sensitive cells, this may
well be problematic. However, for more robust cells, it may
not be, and every individual case needs to be assessed
according to the particular circumstances.
9.1.4 Effect on fl ow regime
The impact of change of fl ow regime can be assessed via the
impact of the change of the Reynolds number. Since the
Reynolds number is proportional to ND
2
, the effect of a
change in fl ow regime can be quantifi ed in terms of the ratio
of ND
2
on the two scales. Using this proportionality, the
ratio of the fl ow regimes on the small to large scales can be
written as Equation 9.13. Finally, substitution of the
Bioprocess engineering
Published by Woodhead Publishing Limited, 2013
180
relationship between the ratio of rotational speed and
impeller diameters (Equation 9.10) yields Equation 9.14.
Consequently, as D increases on scale up, turbulence increases
despite a concomitant decrease in N. According to Equation
9.14, a 10-fold increase in D, for example, will result in a
21.5-fold increase in the Reynolds number.
[9.13]
[9.14]
9.2 Scale up with constant mixing
Adequate mixing is another key parameter in bioprocesses
and as such is also commonly identifi ed as the scale up
criterion. Since mixing effi ciency is proportional to the
rotational speed during turbulent fl ow (Equation 9.8), a
constant mixing time on scale up is analogous to a constant
rotational speed (N
1
= N
2
).
9.2.1 Effect on power requirements
The relationship between rotational speed and power input
in turbulent fl ow is given by Equation 9.9 which, when
N
1
= N
2
, reduces to Equation 9.15. This predicts that to
maintain the mixing characteristics on scale up, an extremely
large increase in power input is required, namely D
5
. This
means that a 10-fold increase in impeller diameter would
require a 10
5
-fold increase in power input in order to
maintain the same mixing times. This exceptionally large
increase in power consumption suggests that a formal
Bioprocess scale up
Published by Woodhead Publishing Limited, 2013
181
application of maintaining constant mixing in geometrically
similar systems may be unrealistic.
[9.15]
9.2.2 Effect on oxygen transfer
Oxygen transfer would be expected to increase if mixing
time is used as the scale up criterion. This can easily be seen
with the relative increase in power of D
5
with constant
mixing compared with only D
3
with constant oxygen transfer.
The ratio of the power input under constant mixing
conditions (Equation 9.15) can be written in terms of oxygen
transfer characteristics or P/V (Equation 9.16). Geometric
similarity implies a relationship between V and D
3
(Equation
9.5) which, when substituted into Equation 9.16, yields
Equation 9.17. Thus an increase of oxygen transfer with D
2
on scale up is confi rmed. So a hypothetical 10-fold increase
in impeller diameter would result in a 10
2
-fold increase in
oxygen transfer should the mixing characteristics remain
constant on scale up.
[9.16]
[9.17]
9.2.3 Effect on shear stress
There will certainly be an increased shear when D is increased
under conditions of constant N. Considering the ratio of
Bioprocess engineering
Published by Woodhead Publishing Limited, 2013
182
shear stress, or ND, at the different scales (Equation 9.11)
and incorporating the relationship between the power ratio
and the impeller diameter ratio under constant mixing
conditions (Equation 9.15) results in Equation 9.18. Shear
stress thus increases with D with constant mixing, indicating
a 10-fold increase in shear stress coordinating with a 10-fold
increase in D.
[9.18]
9.2.4 Effect on fl ow regime
The change in fl ow regime is represented by the change in the
Reynolds number according to Equation 9.13. With constant
mixing, this reduces to Equation 9.19 which predicts a 10
2
-
fold increase in the Reynolds number for a hypothetical
10-fold increase in D.
[9.19]
9.3 Scale up with constant
shear stress
For shear sensitive cells, scale up with constant shear stress
may well be preferred. ND is then defi ned as the scale up
criterion that needs to be maintained constant if the shear
stress is to be maintained on the large scale.
Bioprocess scale up
Published by Woodhead Publishing Limited, 2013
183
9.3.1 Effect on power requirements
With ND constant, the power correlation of Equation 9.9
reduces to Equation 9.20 indicating that the power increases
with the square of the impeller diameter when shear stress is
used as the scale up criterion. So a 10-fold increase in impeller
diameter, for example, will require a 10
2
-fold increase in
energy input.
[9.20]
9.3.2 Effect on oxygen transfer
The effect on oxygen transfer when shear stress is kept
constant can be quantifi ed through manipulation of
Equation 9.20 from a power to a power per unit volume
ratio, followed by substitution of the ratio between the
volume and diameter for geometrically similar vessels
(Equation 9.5). This gives the ratio of the oxygen transfer
characteristics in terms of the ratios of the power per unit
volume (Equation 9.21).
This expression predicts a decrease in oxygen transfer
when shear stress is maintained constant on scale up. (This is
to be expected since shear stress increases with constant
oxygen transfer.) The oxygen transfer decreases with 1/D
such that a 10-fold increase in D would result in an oxygen
transfer on the large scale of only 0.1 of the oxygen transfer
on the small scale. This could be a real problem for shear
sensitive microorganisms with a high oxygen demand and
calls for innovative approaches to enhance the oxygen
transfer without increasing the shear. One such solution
would simply to sparge oxygen- enriched air; another would
be to introduce an immiscible liquid which has a high affi nity
Bioprocess engineering
Published by Woodhead Publishing Limited, 2013
184
for oxygen (e.g. oil) as a dispersed phase to provide reservoirs
of oxygen amongst the microorganisms.
[9.21]
9.3.3 Effect on mixing
The effect on mixing can be very simply calculated as ND is
constant. Therefore, N is proportional to 1/D and Equation
9.22 follows. Thus, mixing is compromised to the same extent
as is the oxygen transfer, i.e. reduced to 0.1 of its effi ciency at
the small scale for a 10-fold increase in impeller diameter.
Effectively, this means that the mixing time would be increased
10-fold. Depending on the particular circumstances, this may
have severe consequences. For instance, high concentrations
of fi lamentous fungi are comparatively viscous and may suffer
from inadequate mixing and oxygen transfer limitations yet
are sensitive to shear stress through breakage of the hyphae.
Scale up of these and similar bioprocesses is challenging
and needs to be carried out with insight.
[9.22]
9.3.4 Effect on fl ow regime
The effect of shear stress as the scale up criterion on fl ow
regime can be quantifi ed from Equation 9.13 with ND
constant. This results in Equation 9.23 which predicts an
increase in the Reynolds number proportional to the increase
in impeller diameter, e.g. a 10-fold increase in impeller
diameter on scale up would result in a similar 10-fold increase
Bioprocess scale up
Published by Woodhead Publishing Limited, 2013
185
in the Reynolds number. So a turbulent fl ow regime would
remain during scale up with constant shear.
[9.23]
9.4 Scale up with constant
fl ow regime
The fl ow regime can be maintained constant on scale up by
maintaining a constant Reynolds number (although this
scale up criterion has been used less frequently than other
parameters).
9.4.1 Effect of scale up on power
requirements
The power ratio (Equation 9.9) with ND
2
constant can be
manipulated into Equation 9.24 which predicts a decrease in
power on scale up with the inverse of the impeller diameter.
For a hypothetical 10-fold increase in impeller diameter, then,
only 0.1 of the small scale power input would be required.
[9.24]
9.4.2 Effect of scale up on oxygen transfer
This decrease in power requirement with fl ow regime as the
scale up criterion would certainly have an adverse effect on
the oxygen transfer. To calculate its effect, the power ratio
with ND
2
constant (Equation 9.24) needs to be written in
Bioprocess engineering
Published by Woodhead Publishing Limited, 2013
186
terms of the power per unit volume ratio (Equation 9.25).
So, as expected, the oxygen transfer is extremely low on the
large scale, being only 1/D
4
of that on the small scale.
Quantifying the oxygen transfer on scale up in terms of a
10-fold increase in impeller diameter, shows that the oxygen
transfer is only 10
−4
of that on the small scale. This is a red
fl ag to warn that scale up with constant fl ow regime should
not be considered for an aerobic bioprocess.
[9.25]
9.4.3 Effect of scale up on mixing
Under conditions of constant fl ow regime on scale up, ND
2
is constant and N is proportional to 1/D
2
, so Equation 9.26
applies. This predicts a decrease in mixing. Here the decrease
is considerable with mixing on the large scale decreased 10
2
-
fold with a 10-fold increase in impeller diameter. This
decrease is an order of magnitude larger than that experienced
during scale up with either oxygen transfer or constant shear
as the scale up criterion. Thus, the mixing on the large scale
may not be suffi cient for adequate substrate transfer, or for
proper suspension of particles and unmixed pockets of solids
and fl uid may occur.
[9.26]
9.4.4 Effect of scale up on sheer stress
The effect on shear stress is readily evaluated from multiplying
Equation 9.26 by the impeller diameter ratio to yield
Bioprocess scale up
Published by Woodhead Publishing Limited, 2013
187
Equation 9.27. This shows a decrease in the shear stress on
scale up; for instance a 10-fold increase in impeller diameter
results in a 10-fold decrease in the shear stress.
[9.27]
Considering shear stress alone, maintenance of fl ow regime
on scale up appears advantageous. But it should be
remembered that this advantage is achieved at the expense of
serious compromises in the mixing and oxygen transfer
characteristics. In general, scale up using the Reynolds
number as the scale up criteron is not considered a viable
proposition.
9.5 Notes
1. A time constant is defi ned as the time taken after a step change
for the concentration to reach 0.63 (1 − e
−1
) of its initial value.
For example, a fi rst order change in oxygen concentration has
a time constant equal to the reciprocal K
L
a. (The derivation is
left to the reader.)
2. vvm = volume of air per volume of liquid per minute. A range
of vvm is given because a lower vvm applies at a lower agitation
rate.
3. In geometrically similar systems, volume is proportional to D
3
whereas area is proportional to D
2
. Thus the surface/volume
ratio decreases on scale up. This may affect bioprocesses where
wall growth is signifi cant, especially if cells adhering to surfaces
have an altered metabolism to that of submerged cells.
4. Developed by Osborne Reynolds (1843–1912).
5. Remembering that under constant oxygen transfer conditions,
P/V is constant.