Tài liệu Adaptive WCDMA (P13) pptx
Bạn đang xem bản rút gọn của tài liệu. Xem và tải ngay bản đầy đủ của tài liệu tại đây (1016.32 KB, 35 trang )
13
Multiuser CDMA receivers
In this chapter we present a number of methods for multiple-access interference (MAI)
cancelation. MAI is produced by the presence of the other users in the network, which are
located in the same bandwidth as our own signal. The common characteristic of all these
schemes is some form of joint signal and parameter estimation for all signals present
in the same bandwidth. It makes sense to implement this in a Base Station (BS) of a
cellular system because all these signals are available there anyway. At the same time
this concept will considerably increase the complexity of the receiver. Although very
complex, these schemes are being standardized already because they offer significantly
better performance. Details can be seen in Chapter 17. Much simpler but less effective
solutions feasible for implementations in mobile units are also considered [minimum mean
square error (MMSE) type of algorithms].
13.1 OPTIMAL RECEIVER
If user k transmits bit stream b
k
, with bit interval T , using spreading sequence s
k
,then
the low-pass equivalent of the overall signal received in the BS can be represented as
[1,2]
dr
t
= S
t
(b) dt +σ dω
t
,t∈ R(13.1)
S
t
(b) =
M
i=−M
K
k=1
b
k
(i)s
k
(t − iT − τ
k
)(13.2)
where K is the number of users, b = (b
1
,b
2
, ,b
K
)
T
is the vector of bits of all users and
the signal is observed in time interval [−MT,MT ]. The noise component is represented
by the second term of equation (13.1) and τ
k
is the delay of signal from user k.Onthe
basis of the likelihood principle described in Chapter 3, the detector selects the vector of
bits b that maximizes
P [{r
t
,t ∈ R}|b] = C exp[(b)/2σ
2
] (13.3)
Adaptive WCDMA: Theory And Practice.
Savo G. Glisic
Copyright
¶ 2003 John Wiley & Sons, Ltd.
ISBN: 0-470-84825-1
456 MULTIUSER CDMA RECEIVERS
where C is a positive scalar independent of b and
(b) = 2
∞
−∞
S
t
(b) dr
t
−
∞
−∞
S
2
t
(b) dt(13.4)
So, the joint maximum likelihood (ML) decision (estimate) for vector b is obtained as
ˆ
b = max (b)
all b ∈ (+1, −1)
(13.4a)
In other words, vector b that jointly gives the maximum of equation ( 13.4) is chosen as a
joint estimate of bits for all users. The first term in equation ( 13.4) can be represented as
∞
−∞
S
t
(b) dr
t
=
M
i=−M
b
T
(i)y(i) (13.5)
where y(i) is a vector with elements y
k
(i) representing the output of a matched filter for
the ith symbol of the kth user, that is,
y
k
(i) =
τ
k
+iT +T
τ
k
+iT
s
k
(t − iT − τ
k
) dr
t
(13.6)
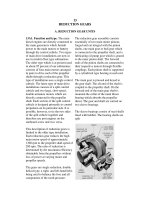
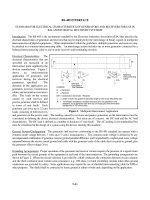
The block diagrams of conventional and optimal (ML) detectors are shown in Figures 13.1
and 13.2, respectively.
Without going into the details of evaluating bit error rate (BER) for these detectors,
some results are shown in Figures 13.3 to 13.5 [1,2]. To simplify the numerical eval-
uation, trivial codes shown in Figure 13.3 are used. Such codes also have high (1/3)
correlation function so that the effect of optimum detectors are better emphasized. From
Figure 13.3 one can see how much optimum (sequence) detector outperforms the con-
ventional detector.
Matched
filter
User 1
Sync
K
b
1
(
j
)
r
(
t
)
Matched
filter
User 2
Matched
filter
User
K
•
•
•
•
•
•
•
•
•
•
•
•
Sync 2
•
•
•
Sync 1
•
•
•
^
b
2
(
j
)
^
b
K
(
j
)
^
Figure 13.1 Conventional multiuser detector.
OPTIMAL RECEIVER 457
Matched
filter
User 1
r
(
t
)
y
1
(
i
)
y
2
(
i
)
y
K
(
i
)
Decision
algorithm
Matched
filter
User 2
Matched
filter
User
K
•
•
•
•
•
•
•
•
•
Sync 1
•
•
•
Sync 2
•
•
•
Sync
K
•
•
•
b
1
(
j
)
^
b
2
(
j
)
^
b
K
(
j
)
^
Figure 13.2 Optimum K-user detector for asynchronous multiple-access Gaussian channel.
Figure 13.4 represents the same results for more realistic code, m-sequence of length
31. One can see that the sequence detector performs almost a s though only one user is
present in the network (single user).
Worst-case conventional detector
Best-case conventional detector
Upper bound sequence detector
Single user
User 1
User 2
10
−8
468101214
10
−6
10
−4
10
−2
10
0
Probability of error
1
SNR (dB)
Figure 13.3 Best and worst cases of error probability of User 1 achieved by conventional and
optimum detectors.
458 MULTIUSER CDMA RECEIVERS
Conventional
Worst-case User 1
Worst-case Users 2, 3
Average user 1
Upper bound worst case
sequence detector
Upper bound average
sequence detector
Single user
10
0
10
−2
10
−4
10
−6
10
−8
Probability of error
1
5 6 7 10 1211
SNR
1
(dB)
8 9
Figure 13.4 Wo rst-case and average error probabilities achieved by conventional and optimum
multiuser detectors with three active users employing m-sequences of length 31.
(a)
SNR
2
/SNR
1
= −10 dB
Conventional detector
Upper bound sequence detector
Lower bound minimum distance
Single user
10
0
Probability of error
1
4 6 8 10 12 14
SNR
1
(dB)
10
−2
10
−4
10
−6
10
−8
Figure 13.5 Bounds on minimum error probability of User 1. Worst-case delays and two active
users: (a) E
2
/E
1
=−10 dB, (b) −5dB, (c) 0dB.
OPTIMAL RECEIVER 459
10
0
10
−2
10
−4
10
−6
10
−8
46810
SNR
1
(dB)
(c)
Probability of error
1
12 14
Conventional detector
Upper bound sequence detector
Single user
SNR
2
/SNR
2
= 0 dB
Upper bound sequence detector
4 6 8 10 12 14
(b)
SNR
2
/SNR
1
= −5 dB
Conventional detector
Lower bound minimum distance
Single user
Probability of error
1
SNR
1
(dB)
10
−2
10
0
10
−4
10
−6
10
−8
Figure 13.5 (Continued).
460 MULTIUSER CDMA RECEIVERS
Figure 13.5(a) to 13.5(c) presents the same results for different near far ratio (NFR)
defined as SNR
2
/SNR
1
. From these figures one can see that the impact of using optimal
detector is more evident for larger NFR.
13.2 LINEAR MULTIUSER CDMA DETECTORS
13.2.1 Synchronous CDMA channels
If the signals from different users are received synchronously, equation (13.1) becomes
r(t) =
K
k=1
b
k
(j )s
k
(t − jT) + σn(t)
t ∈ [jT,jT + T ] (13.7)
If we use notation y
k
for the output of the matched filter of user k, equation (13.6) becomes
y
k
=
T
0
r(t)s
k
(t) dt, k = 1, ,K (13.8)
and we can write
y
1
=
j
b
k
R
1j
+ n,
y
2
=
j
b
k
R
2j
+ n
2
.
.
.
y
k
=
j
b
k
R
kj
+ n
k
(13.9)
The vector of these outputs can be presented as
y = Rb + n (13.10)
where R is the nonnegative definite matrix of cross-correlations between the assigned
waveforms:
R
ij
=
T
0
s
i
(t)s
j
(t) dt(13.11)
Conventional single-user detection can be represented as
ˆ
b
c
k
= sgn y
k
(13.12)
LINEAR MULTIUSER CDMA DETECTORS 461
The optimum multiuser detector becomes
ˆ
b ∈ arg min
b ∈{−1, 1}
K
T
0
r(t) −
K
k=1
b
k
s
k
(t)
2
dt
= arg max
b ∈{−1, 1}
K
2y
T
b − b
T
Rb (13.13)
13.2.2 The decorrelating detector
In the absence of noise, the matched filter output vector is y = Rb. The detector will
perform the following operation
ˆ
b = sgn R
−1
y. Note that the noise components in R
−1
y
are correlated, and therefore sgn R
−1
y does not result in optimum decisions. It is inter-
esting to point out that this detector does not require knowledge of the energies of any
of the active users. To see this, let ˜y
k
= y
k
/
√
E
k
,thatis, ˜y
k
is the result of correlat-
ing the received process with the normalized (unit-energy) signal of the kth user. Then,
we have
sgn R
−1
y = sgn E
−1/2
R
−1
E
−1/2
y
= sgn W
−1/2
R
−1
˜y
= sgn R
−1
˜y (13.14)
where R
is the cross-correlation matrix of normalized signals and therefore, the same
decisions are obtained by multiplying the vector of normalized matched filter outputs by
the inverse of the normalized cross-correlation matrix. For an iterative solution of the
problem, see Reference [3].
13.2.3 The optimum linear multiuser detector
Linear detector [4] that minimizes the probability of bit error will be referred to as
optimum linear multiuser detector. Its operation can be represented as
ˆ
b = sgn(Ty ) = sgn(TRb + Tn)(13.15)
We will consider the set I(R) of generalized inverses of the cross-correlation matrix R
and analyze the properties of the detector
ˆ
b = sgn R
I
y (13.16)
in the next chapter. The special case I(R) = R
−1
is referred to as a decorrelating
detector.
462 MULTIUSER CDMA RECEIVERS
13.3 MULTISTAGE DETECTION IN ASYNCHRONOUS
CDMA
If the indexing of users is arranged in increasing order of their delays, then the output of
the correlator of user k can be represented as
z
(i)
k
(0) =
∞
−∞
r(t)s
k
(t + iT −τ
k
) dt
= η
(i)
k
+
K
l=k+1
R
kl
(1)b
(i−1)
l
+
K
l=1
R
kl
(0)b
(i)
l
+
k−1
l=1
R
kl
(−1)b
(i+1)
l
(13.17)
η
(i)
k
is the component of the statistic due to the additive channel noise. In vector notation,
letting z
(i)
(0) =z
(i)
1
(0), z
(i)
2
(0), ,z
(k)
K
(0)
T
,wehave
z
(i)
(0) = η
(i)
+ R(1)b
(i−1)
+ R(0)b
(i)
+ R(−1)b
(i+1)
(13.18)
13.3.1 The multistage detector
The multistage detector [5] recreates the interfering term for each user on the basis of bit
estimations in the previous stage (iteration), subtracts the estimated MAI and then makes
the new estimate of data that can be represented as
ˆ
b
(i)
k
(m +1) = sgn[z
(i)
k
(m)] (13.19)
where
z
(i)
k
(m) = z
(i)
k
(0) −
K
l=k+1
h
kl
(1)
ˆ
b
(i−1)
l
(m) −
l=k
h
kl
(0)
ˆ
b
(i)
l
(m)
−
k−1
l=1
h
kl
(−1)
ˆ
b
(i+1)
l
(m) (13.20)
The block diagram of multistage multiuser detector (MSMUD) is shown in Figure 13.6.
A detailed implementation of the kth M-stage processor where for each m = 1, 2, ,
M − 1,
ˆ
I
(i−2m+1)
k
(m) denotes the estimate of the MAI reconstructed in the mth stage on
the basis of bit estimates
ˆ
b
(i−2m)
j
(m − 1),
ˆ
b
(i−2m+1)
j
(m −1) and
ˆ
b
(i−2m+2)
j
(m − 1)∀j = k
obtained from the other K − 1 processors is shown in Figure 13.7.
An example of probability of error curves is shown in Figure 13.8. All parameters are
shown in the figure itself. One can see that even two-stage detector may significantly
improve the system performance.
MULTISTAGE DETECTION IN ASYNCHRONOUS CDMA 463
Sync 1
Sync 2
Sync
K
b
1
(
M
)
b
2
(
M
)
b
K
(
M
)
Matched
filter
User 1
Matched
filter
User 2
r
(
t
)
(13.19)
z
1
(i)
(0)
z
2
(i)
(0)
z
K
(i)
(0)
M
-stage
processor
User 1
M
-stage
processor
User 2
M
-stage
processor
User
K
Multistage algorithm
Matched
filter
User
K
ˆ
ˆ
ˆ
Figure 13.6 The multistage multiuser detector (MSMUD) for the BPSK-CDMA system.
Delay
T
−t
k
Delay
T
Store
b
k
(
i
−4)
(3)
b
k
(
i
−5)
(3)
b
k
(
i
−6)
(3)
Store
b
k
(
i
−2)
(2)
b
k
(
i
−3)
(2)
b
k
(
i
−4)
(2)
Store
b
k
(
i
)
(1)
b
k
(
i
−1)
(1)
b
k
(
i
−2)
(1)
z
k
(
i
)
(0)
z
k
(
i
−1)
(0)
I
k
(
i
−1)
(1)
I
k
(
i
−3)
(2)
z
k
(
i
−3)
(0)
z
k
(
i
−2
M
+ 2)
(
M
−1)
b
k
(
i
−2
M
+ 2)
(
M
)
b
k
(
i
−4)
(3)
b
k
(
i
−2)
(2)
b
k
(
i
)
(1)
z
k
(
i
−2
M
+ 3)
(0)
I
k
(
i
−2
M
+ 3)
(
M
−1)
z
k
(
i
−4)
(2)
z
k
(
i
−2)
(1)
–
–
–
Delay
2
T
Delay
2
T
Figure 13.7 A detailed implementation of MSMUD.
464 MULTIUSER CDMA RECEIVERS
In order to further emphasize the role of multiuser detection (MUD) in the presence of
near far effect, Figure 13.9 presents BER for the case when the cross-correlation is very
high r
12
= 1/3. One can see that when the second user becomes stronger and stronger the
improvement compared with a conventional detector is more significant.
This conclusion becomes more and more relevant if either r
12
is increased, as in
Figure 13.10, or SNR is increased, as in F igure 13.11.
Figure 13.12 demonstrates the same results for five users in the network.
N
= 31
K
= 2
E
2
/
E
1
= −3 dB
N
= 31
K
= 2
E
2
/
E
1
= 0 dB
One-stage U.B.
One-stage AV. U.
Two-stage U.B.
Two-stage AV. U.
Single user
One-stage U.B.
One-stage AV. U.
Two-stage U.B.
Two-stage AV. U.
Single user
4 5
6 7
8 9
10 11 12
10
−1
10
−2
10
−3
10
−4
10
−5
10
−6
10
−7
SNR (dB)
Probability of error (User 1)
10
−1
10
−2
10
−3
10
−4
10
−5
10
−6
10
−7
Probability of error (User 1)
(a)
4 5
6 7
8 9
10 11 12
SNR
1
(dB)
(b)
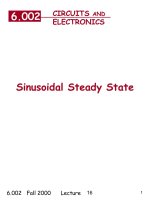
Figure 13.8 A comparison between the worst case and the upper bound of the average error
probability of a two-user direct-sequence spread-spectrum system with N = 31, for the
conventional receiver (CR) and the two-stage receiver and the single-user bit error probability:
(a) E
2
/E
1
=−3dB, (b) E
2
/E
1
= 0dB, (c) E
2
/E
1
= 3 dB [5]. Reproduced from Varanasi, M. and
Aazhang, B. (1990) Multistage detection in asynchronous code division multiple access
communications. IEEE Trans. Commun., 38, 509 –519, by permission of IEEE.
NONCOHERENT DETECTOR 465
N
= 31
K
= 2
E
2
/
E
1
= 3 dB
One-stage U.B.
One-stage AV. U.
Two-stage U.B.
Two-stage AV. U.
Single user
10
−2
10
−3
10
−4
10
−5
10
−6
Probability of error (User 1)
10
−1
10
−7
SNR
1
(dB)
(c)
54 6 7 8 9 10 11 12
Figure 13.8 (Continued).
Conventional
Decorrelator
Optimum linear
Two-stage (conv)
Two-stage (dec)
Optimum
r = 1/3
SNR
1
= 8 dB
SNR
2
− SNR
1
(dB)
s
1
(
t
)
s
2
(
t
)
0
T
10
−1
10
0
10
−4
10
−2
10
−3
Probability of error (User 1)
−8−10 −6 −4 −202 46810
Figure 13.9 Error probability comparison of the linear, two-stage and optimum detectors for a
two-user channel with r
12
= 1/3 and SNR of User 1 fixed at 8 dB [6]. Reproduced from Varanasi,
M. and Aazhang, B. (1991) Near optimum detection in synchronous code division multiple access
systems. IEEE Trans. Commun., 39, 725–736, by permission of IEEE.
13.4 NONCOHERENT DETECTOR
13.4.1 Conventional noncoherent single-user detector – DPSK
A conventional detector for differential phase keying signals is defined by the following
equation
ˆ
b
m
= sgn[Re{z
m
(−1)z
m
(0)}]
z
m
(i) =
1
2
(i+1)T
iT
r(t)f
m
(t −iT )dt (13.21)
466 MULTIUSER CDMA RECEIVERS
Conventional
Decorrelator
Optimum linear
Two-stage (conv)
Two-stage (dec)
Three-stage (dec)
Optimum
r = 0.7
SNR
1
= 8 dB
SNR
2
− SNR
1
(dB)
10
−1
10
0
10
−2
10
−3
10
−4
Probability of error (User 1)
−10 −8 −6 −4 −20246810
Figure 13.10 Error probability comparison of the linear, three-stage and optimum detectors for
a two-user channel with r
12
= 0.7 and SNR of User 1 fixed at 8 dB [6]. Reproduced from
Varanasi, M. and Aazhang, B. (1991) Near optimum detection in synchronous code division
multiple access systems. IEEE Trans. Commun., 39, 725 –736, by permission of IEEE.
r = 0.7
SNR
1
= 8 dB
Conventional
Decorrelator
Optimum linear
Two-stage (conv)
Two-stage (dec)
Optimum
SNR
2
− SNR
1
(dB)
10
−1
10
0
10
−2
10
−3
10
−4
10
−5
10
−6
10
−7
10
−8
10
−9
−10 −8 −6 −4 −20246810
Probability of error (User 1)
Figure 13.11 Error probability comparison of the linear, two-stage and optimum detectors for a
two-user channel with r
12
= 0.7 and SNR of User 1 fixed at 12 dB.
NONCOHERENT DETECTOR 467
SNR
1
= 8 dB
Active Users: 1,2,3,4,5
Conventional
Decorrelator
Two-stage (dec)
Three-stage (dec)
Four-stage (dec)
SNR
i
− SNR
1
(dB)
10
−1
10
0
10
−2
10
−3
10
−4
Probability of error (User 1)
−10 −8 −6 −4 −20246810
Figure 13.12 Probability of error for five users in the network [6]. Reproduced from Varanasi,
M. and Aazhang, B. (1991) Near optimum detection in synchronous code division multiple access
systems. IEEE Trans. Commun., 39, 725–736, by permission of IEEE.
Delay
T
Matched filter 1
Re(·)
Re(·)
Re(·)
(·)
Delay
T
(·)
Delay
T
(·)
t
=
i
t
=
i
t
=
i
r
(
t
)
b
1
b
2
b
K
f
1
(
T
–
t
)
Matched filter 2
f
2
(
T
–
t
)
Matched filter
K
f
K
(
T
–
t
)
ˆ
ˆ
ˆ
Figure 13.13 Conventional detection: a bank of K single-user DPSK detectors.
where f
m
(t) is the signal matched filter function. In the trivial case it is the signal
spreading code only. The block diagram is shown in Figure 13.13.
13.4.2 Noncoherent linear multiuser detectors – DPSK
In general, a noncoherent linear multiuser detector for the mth user, denoted by a nonzero
transformation h
(m)
∈ C
K
, is defined by the decision
468 MULTIUSER CDMA RECEIVERS
ˆ
b
m
= sgn
Re
K
k=1
h
(m)
k
z
k
(−1)
K
l=1
h
(m)
l
z
l
(0)
(13.22)
where K is the length of the code.
13.4.3 Decorrelating detectors
A noncoherent decorrelating detector for user m is defined by the decision with the linear
transformation h = d where d denotes the complex conjugate of the mth column of a
generalized inverse R
I
of R.Ifthemth user is linearly independent, it can be shown that
R
d = u
m
is the mth unit vector. If all the signature signals are linearly independent, R
−1
exists and the decorrelating transformation d is uniquely characterized as the complex
conjugate of the mth column of the inverse of R. The receiver block diagram is shown
in Figure 13.14.
For illustration purposes, four users, using Gold sequences from Figure 13.15(a), are
considered. Performance results with MU detector are shown in Figure 13.15(b) [7].
13.4.4 Noncoherent detection in asynchronous multiuser channel
The z-transform of equation (13.18) gives
Z (z) = S (z) ·
ˆ
D(z) + N (z) (13.23)
(·)
(·)
(·)
Re(·)
Re(·)
Re(·)
t
=
iT
t
=
iT
t
=
iT
r
(
t
)
b
ˆ
1
b
ˆ
2
b
ˆ
k
Matched filter 2
f
2
(
T
–
t
)
Matched filter 1
f
1
(
T
–
t
)
Matched filter
K
f
K
(
T
–
t
)
Delay
T
Delay
T
Delay
T
〈
z
(
i
),
h
(1)
〉
〈
z
(
i
),
h
(2)
〉
〈
z
(
i
),
h
(
K
)
〉
Figure 13.14 Linear multiuser DPSK detector.
NONCOHERENT DETECTOR 469
+1
−1
+1
−1
+1
−1
+1
−1
40812
f
1
(
t
)
f
2
(
t
)
f
3
(
t
)
f
4
(
t
)
(a)
10
0
10
−2
10
−4
10
−6
10
−8
Probability of error (User 1)
4 Users
3 Users
2 Users
1 User
SNR
1
(dB)
(b)
Figure 13.15 (a) Direct-sequence signature signals derived from Gold sequences of length 7
assigned to the four users of a four-user DS-SSMA system. (b) Bit-error rate of first user as a
function of the first user’s signal-to-noise ratio. These error rates are independent of interfering
signal energies and phases.
470 MULTIUSER CDMA RECEIVERS
1
1
)Re(
.
)Re(
Differential
encoder
[
b
(
i
)]
Equivalent communication system.
A
(
i
)
S
(
z
)
DPSK decorrelating detector
Decision
algorith
Differential
encoder
[
b
(
i
)]
^
[
n
(
i
)]
[
b
(
i
)]
^
d
(
i
)
~
d
(
i
)
~
d
(
i
)
z
(
i
)
d
(
i
−1)
~
adj
S
(
z
)
det
S
(
z
)
det
S
(
z
)
z
−1
z
−1
)(
_
.
)(
_
.
.
Figure 13.16 Noncoherent decorrelating detector [8].
where
S (z) = R(−1)z +R(0) +R(1)z
−1
(13.24)
and Z (z),
ˆ
D(z) and N (z) are the vector-valued z-transforms of the matched-filter output
sequence, the sequence {
ˆ
d(l) = A(l)d(l)} and the noise sequence {n(l)} at the output of
the matched filters. If we define
G(z) = [S (z)]
−1
=
adj S (z)
det S (z)
(13.25)
then we have
ˆ
d(z) = G(z)Z (z) (13.26)
and
ˆ
b(i) = sgn Re[
˜
d(i − 1) ⊗
˜
d
∗
(i)] (13.27)
The system block diagram is shown in Figure 13.16.
13.5 MULTIUSER DETECTION IN FREQUENCY
NONSELECTIVE RAYLEIGH FADING CHANNEL
Topics covered in the previous chapter are now repeated for the fading channel. Previously
described algorithms are extended to the fading channel by using as much analogy as
MULTIUSER DETECTION IN FREQUENCY NONSELECTIVE RAYLEIGH FADING CHANNEL 471
b
2
(
i
)
u
1
(
t
−
iT
−t
1
)
u
2
(
t
−
iT
−t
2
)
u
K
(
t
−
iT
−t
K
)
n
(
t
)
r
(
t
)
c
K
(
i
)
c
2
(
i
)
c
1
(
i
)
b
K
(
i
)
b
1
(
i
)
Figure 13.17 Asynchronous CDMA flat Rayleigh fading channel model.
possible in the process of deriving the system transfer functions. In frequency-selective
channels, decorrelators are combined with the RAKE type receiver in order to further
improve the system performance. A number of simulation results are presented in order
to illustrate the effectiveness of these schemes. The concept of this chapter is based on
proper understanding of the channel model, which is covered in Chapter 8. The overall
system model, including the channel model for frequency-nonselective fading, is shown
in Figure 13.17.
Parameters c
k
(i) are, for fi xed i, independent, zero-mean, complex-valued Gaussian
random variables, with variances
|c
k
|
2
with independent quadrature components. The
time-varying nature of the channel is described via the spaced-time correlation function
of the kth channel
k
(t)
E{c
∗
k
(i)c
k
(j )}=
k
[(j − i)T ] (13.28)
The received signal at the central receiver can be expressed as
r(t) = S(t, b) + n(t)
S(t, b) =
M
i=−M
K
k=1
b
k
(i)c
k
(i)u
k
(t −iT −τ
k
)
u
k
(t) =
E
k
s
k
(t)e
jφ
k
(13.29)
where u
k
(t) is referred to as user k signature sequence including signal amplitude (square
root of signal e nergy), code itself and signal phase. By using proper notation, r(t) can be
represented as
r(t) = b
T
Cu
t
+ n(t) (13.30)
472 MULTIUSER CDMA RECEIVERS
where
b
T
[b
1
(−M)b
2
(−M)···b
K
(−M)···b
1
(M)b
2
(M) ···b
K
(M)]
u
t
= [u
T
(t +MT)···u
T
(t −MT)]
T
u(t) = [u
1
(t − τ
1
) ···u
K
(t − τ
K
)]
T
C = diag [C (−M)···C (M)]
C (i) = diag [c
1
(i) ···c
K
(i)] (13.31)
13.5.1 Multiuser maximum likelihood sequence detection
By using analogy from the previous section, the likelihood function in this case can be
represented as
L(b) = 2Re{b
H
y}−b
H
C
H
R
u
Cb (13.32)
Upper index ()
H
denotes conjugate transpose a nd
y =
+∞
−∞
r(t)C
H
u
∗
t
dt(13.33)
represents vector of matched filters outputs. The correlation matrix R
u
can be repre-
sented as
R
u
=
+∞
−∞
u
∗
t
u
T
t
dt =
R
u
(0) R
u
(−1) 0 ···
R
u
(1) R
u
(0) R
u
(−1) ···
.
.
.
.
.
.
··· R
u
(1) R
u
(0) R
u
(−1)
··· 0 R
u
(1) R
u
(0)
(13.34)
with block elements of dimension K × K
R
u
(i − j) =
+∞
−∞
u
∗
(t − iT )u
T
(t − jT)dt(13.35)
and scalar elements
[R
u
(i − j)]
mn
=
+∞
−∞
u
∗
m
(t − iT − τ
m
)u
n
(t − jT − τ
n
) dt(13.36)
13.5.2 Decorrelating detector
If we slightly modify the vector notation, equation (13.30) becomes
r(t) =
M
i=−M
s
T
(t −iT )EC (i)b(i) + n(t) (13.37)
MULTIUSER DETECTION IN FREQUENCY NONSELECTIVE RAYLEIGH FADING CHANNEL 473
with normalized signature waveform vector
s(t) = [s
1
(t −τ
1
)s
2
(t − τ
2
) ···s
K
(t −τ
K
)]
T
(13.38)
K × K multichannel matrix
C (i) = diag[c
1
(i)c
2
(i) ···c
K
(i)]
E = diag
E
1
E
2
···
E
K
(13.39)
and matrix of carrier phases
= diag (e
jφ
1
e
jφ
2
···e
jφ
K
)(13.40)
K × K cross-correlation matrices of normalized signature waveforms becomes
R() =
+∞
−∞
s
∗
(t)s
T
(t +T ) dt(13.41)
The asynchronous nature of the c hannel is evident from the matrix elements
R
mn
() =
(+1)T +τ
m
T +τ
m
s
∗
m
(t − τ
m
)s
n
(t + T −τ
n
) dt(13.42)
Since there is no intersymbol interference (ISI), R() = 0, ∀|| > 1andR(−1) = R
H
(1).
Because of the ordering of the user, R
H
(1) is an upper triangular matrix with zero elements
on the diagonal. The decorrelating detector front end consists of K filters matched to the
normalized signature waveforms of the users. The output of this filter bank, sampled at
the th bit epoch is
y() =
+∞
−∞
r(t)s(t −T ) dt(13.43)
The vector of sufficient statistics can also be represented as
y() = R(−1)E C( + 1)b( +1) + R(0)E C()b()
+ R(1)E C( −1)b( −1) + n
y
() (13.44)
The covariance matrix of the matched filter output noise vector sequence, {n
y
()},is
given by
E{n
∗
y
(i)n
T
y
(j )}=σ
2
R
∗
(i − j) (13.45)
As in equation (13.25), the decorrelator is a K-input K-output linear time-invariant (LTI)
filter with transfer function matrix
G(z) = [R(−1)z +R(0) + R(1)z
−1
]
−1
= S
−1
(z) (13.46)
The z-transform of the decorrelator output vector is
P(z) = E (Cb)(z) +N
p
(z) (13.47)
474 MULTIUSER CDMA RECEIVERS
N
p
(z) is the z-transform of the output noise vector sequence having power spectral density
σ
2
S
−1
(z) = σ
2
∞
m=−∞
D(m)z
−m
(13.48)
The receiver block diagram is shown in Figure 13.18 for coherent reception and in
Figure 13.19 for differential modulation.
Performance results for the two detectors are shown in Figures 13.20 and 13.21. Sig-
nificant improvement in BER is evident in both fi gures.
1
1
1
Matched
filter
User 1
Matched
filter
User 2
Matched
filter
User
K
Decorrelating filter
Decision
for User 1
iT
+t
1
iT
+t
2
iT
+t
K
Adj
S
(
z
)
det
S
(
z
)
det
S
(
z
)
det
S
(
z
)
e
_
j
f
1
^
e
_
j
f
2
^
e
_
j
f
K
^
Re(·)
Re(·)
Re(·)
r
(
t
)
Figure 13.18 Coherent decorrelating multiuser detector.
1
1
1
T
(·)
T
(·)
T
(·)
Decision
for User 1
Decision
for User
K
Decorrelating filter
r
(
t
)
Matched
filter
User 1
Matched
filter
User 2
Matched
filter
User
K
jT
+t
1
jT
+t
2
jT
+t
K
Adj
S
(
z
)
det
S
(
z
)
det
S
(
z
)
det
S
(
z
)
Re(·)
Re(·)
Re(·)
Figure 13.19 Differentially coherent decorrelating multiuser detector.
MULTIUSER DETECTION IN FREQUENCY-SELECTIVE RAYLEIGH FADING CHANNEL 475
Conventional detector
Decorrelator detector
MLS detector upper bound
Isolated transmission
BER for User 1
Gold sequence
J
= 127
SNR (dB)
10
−1
10
0
10
−3
10
−4
10
−2
10 20 30 40 50 60
Figure 13.20 Bit error rate of User 1 for the two-user case with Rayleigh-faded paths (same
average path strength) and Gold sequences of period J = 127 [9]. Reproduced from Zvonar, Z.
(1993) Multiuser Detection for Rayleigh Fading Channel. Ph.D. Thesis, Department of Electrical
and Computer Engineering, Northeastern University, Boston, MA, by permission of IEEE.
10
0
10
−1
10
−3
10
−4
10
−5
10
−6
10
−2
10 20 30 40 50
60
Conventional BPSK detector
BPSK isloated
DPSK isolated
BPSK multiuser detector
DPSK multiuser detector
SNR (dB)
BER for User 1
Figure 13.21 Bit error rate of User 1 for two active users with Rayleigh-faded paths (same
average path strength) and Gold sequences of period J = 127 [9]. Reproduced from Zvonar, Z.
(1993) Multiuser Detection for Rayleigh Fading Channel. Ph.D. Thesis, Department of Electrical
and Computer Engineering, Northeastern University, Boston, MA, by permission of IEEE.
476 MULTIUSER CDMA RECEIVERS
13.6 MULTIUSER DETECTION
IN FREQUENCY-SELECTIVE RAYLEIGH
FADING CHANNEL
By using an analogy with equation (13.29), the received signal in this case can be repre-
sented as
r(t) = S(t, b) + n(t)
S(t, b) =
M
i=−M
K
k=1
b
k
(i)h
k
(t −iT − τ
k
)
h
k
(t) = c
k
(t)
∗
u
k
(t) (13.49)
In equation ( 13.49), h
k
(t) is the equivalent received symbol waveform of finite duration
[0, T
k
] [convolution of equivalent low-pass signature waveform u
k
(t) and the channel
impulse response c
k
(t)]. We define the memory of this channel as v, the smallest integer
such that h
k
(t) = 0fort>(v+ 1)T, and all k = 1, ,K. The impulse response of the
kth user channel is given by
c
k
(t) =
L−1
=0
c
k,l
(t)δ(t − τ
k,
)(13.50)
When the signaling interval T is much smaller than the coherence time of the channel,
the channel is characterized as slow fading, implying that the channel characteristics can
be measured accurately. Since the channel is assumed to be Rayleigh fading, the coef-
ficients c
k,
(t) are modeled as independent zero-mean complex-valued Gaussian random
processes. In the sequel w e use the following notation
h
k
(t) =
L−1
=0
c
k,l
(t)u
k
(t − τ
k,l
) = c
T
k
(t)u
k
(t) (13.51)
For the single-user vector of channel coefficients we use
c
k
(t) = [c
k,0
(t)c
k,1
(t), ,c
k,L−1
(t)]
T
(13.52)
and for the signal vector of the delayed signature waveform we use
u
k
(t) = [u
k
(t −τ
k,0
)u
k
(t − τ
k,1
) ···u
k
(t − τ
k,L−1
)]
T
(13.53)
The equivalent low-pass signature waveform is represented as
u
k
(t) =
E
k
s
k
(t)e
jφ
k
(13.54)
MULTIUSER DETECTION IN FREQUENCY-SELECTIVE RAYLEIGH FADING CHANNEL 477
where E
k
is the energy, s
k
(t) is the real-valued, unit-energy signature waveform with
period T and φ
k
is the carrier phase. In this case the received signal given by
equation (13.49) becomes
r(t) = S(t,b) + n(t) = b
T
h
t
+ n(t) (13.55)
The equivalent data sequence is as in equation (13.31)
b = [b
1
(−M)···b
K
(−M)···b
1
(M) ···b
K
(M)]
T
(13.56)
The equivalent waveform vector of NK elements is
h
t
= [h
T
(t +MT)···h
T
(t −MT)]
T
(13.57)
with
h(t) = [h
1
(t − τ
1
) ···h
K
(t −τ
K
)]
T
= C
T
(t)u(t) (13.58)
where
C(t) =
c
1
(t) 00···
c
2
(t) 0 ···
.
.
.
··· 00c
K
(t)
(13.59)
is a KL × K multichannel matrix. KL is the total number of fading paths for all K
users and
u(t) = [u
1
(t − τ
1
) ···u
K
(t −τ
K
)]
T
(13.60)
is the e quivalent signature vector of KL elements.
13.6.1 Multiuser maximum likelihood sequence detection
Log likelihood function in this case becomes
L(b) = 2Re{b
H
y}−b
H
H b (13.61)
where superscript ‘H ’ denotes conjugate transpose.
y =
+∞
−∞
r(t)h
∗
t
dt(13.62)
is the output of the bank of matched filters sampled at the bit epoch of the users.
Matrix H is an N ×N block-Toeplitz cross-correlation waveform matrix with K × K
block elements.
H (i − j) =
+∞
−∞
h
∗
(t −iT )h
T
(t −jT)dt(13.63)
478 MULTIUSER CDMA RECEIVERS
13.6.2 Viterbi algorithm
Since every waveform h
k
(t) is time-limited to [0, T
k
], T
k
<(v+ 1)T , it follows that
H(l) = 0, ∀|l| >v+1andH(j) = H
H
(j ) for j = 1, ,v+ 1.
Because of the ordering of the users, H
H
(v + 1) is an upper triangular matrix with zero
elements on the diagonal. Provided that knowledge of a channel is available, the MLS
detector may be implemented as a dynamic programming algorithm of the Viterbi type.
The vector Viterbi algorithm is the modification of the one introduced for M-input M-
output linear channels where the dimensionality of the state space is 2
(v+1)K
.Asinthecase
of the additive white Gaussian noise (AWGN) channel, a more efficient decomposition of
the likelihood function results in an algorithm with a state space of dimension 2
(v+1)K−1
.
Frequency-selective fading is described by the wide-sense stationary uncorrelated-
scattering model. The bandwidth of each signature waveform is much larger than the
coherence bandwidth of the channel, B
w
(f )
c
. The time-varying frequency-selective
channel for each user can be represented as a tapped delay line with tap spacing 1/B
w
,
so that equation (13.51) becomes
h
k
(t) =
L−1
i=0
c
k,i
(t)u
k
t −
i
B
w
= s
T
k
(t)E
k
k
c
k
(t) (13.64)
Signature waveform vector may be described as
s
k
(t) =
s
k
(t)s
k
t −
i
B
w
···s
k
t −
L − i
B
w
T
(13.65)
and
E
k
=
E
k
I
L
k
= e
jφ
k
I
L
(13.66)
For a data symbol duration much longer than the multipath delay spread, T T
m
,any
ISI due to channel dispersion can be neglected. On the basis of the above discussion, the
channel model is presented in Figure 13.22.
So, the received signal from Figure 13.22 can be represented as
r(t) =
M
i=−M
K
k=1
b
k
(i)h
k
(t −iT − τ
k
) + n(t) (13.67)
In addition, if we use notation
b(i) = [b
1
(i)b
2
(i) ···b
K
(i)]
T
,i=−M, ,M
s(t) = [s
T
1
(t − τ
1
)s
T
2
(t − τ
2
) ···s
T
K
(t −τ
K
)]
T
E = diag(E
1
, E
2
, ,E
K
)
= diag(
1
,
2
, ,
K
)
h
T
(t) = [h
1
(t −τ
1
) ···h
K
(t − τ
K
)] = s
T
(t)E C (t) (13.68)
MULTIUSER DETECTION IN FREQUENCY-SELECTIVE RAYLEIGH FADING CHANNEL 479
1
1
1
1
1
1
b
1
(
i
)
s
1
(
t
−
iT
− t
1
)
c
1,0
(
t
)
c
1,1
(
t
)
n
(
t
)
r
(
t
)
c
K
,
L
−1
(
t
)
c
1,
L
−1
(
t
)
c
K
,1
(
t
)
c
K
,0
(
t
)
b
K
(
i
)
s
K
(
t
−
iT
− t
K
)
h
K
(
t
−
iT
− t
K
)
h
1
(
t
−
iT
− t
1
)
B
w
B
w
B
w
B
w
B
w
B
w
Figure 13.22 A synchronous CDMA frequency-selective Rayleigh fading channel model.
Equation (13.67) becomes
r(t) =
M
i=−M
h
T
(t −iT )b(i) +n(t) =
M
i=−M
s
T
(t)WC(t)b(i) + n(t) (13.69)
We define KL × KL cross-correlation matrices of normalized signature waveforms,
R(l) =
+∞
−∞
s(t)s
T
(t +lT )dt(13.70)
The asynchronous mode is evident from the structure of L × L cross-correlation matrix
between the users m and n,
R
mn
(l) =
(l+1)T +τ
m
lT +τ
m
s
m
(t −τ
m
)s
T
n
(t +lT −τ
n
) dt(13.71)
Since there is no ISI, R(l) = 0, ∀|l| > 1andR(−1) = R
H
(1). Because of the ordering
of the users, R
H
(1) is the upper triangular matrix with zero elements on the diagonal.
The front end of the multiuser detector consists of KL filters matched to the normalized
properly delayed signature waveforms of the users as shown in Figure 13.23. The output
of this filter bank sampled at the bit epochs is given by the vector:
y(l) =
+∞
−∞
r(t)s(t − lT)dt(13.72)