Float Analysis - Powerful Technical Indicators Using Price and Volume
Bạn đang xem bản rút gọn của tài liệu. Xem và tải ngay bản đầy đủ của tài liệu tại đây (1.84 MB, 251 trang )
z
Float Analysis - Powerful Technical
Indicators Using Price and Volume
Float Analysis
Powerful Technical Indicators
Using Price and Volume
TEAMFLY
Team-Fly
®
Founded in 1807, John Wiley & Sons is the oldest independent publishing company in
the United States.With offices in North America, Europe, Australia and Asia, Wiley is
globally committed to developing and marketing print and electronic products and ser-
vices for our customers’ professional and personal knowledge and understanding.
The Wiley Trading series features books by traders who have survived the market’s ever
changing temperament and have prospered—some by reinventing systems, others by
getting back to basics.Whether a novice trader, professional or somewhere in-between,
these books will provide the advice and strategies needed to prosper today and well into
the future.
For a list of available titles, please visit our Web site at www.WileyFinance.com.
A Marketplace Book
Float Analysis
Powerful Technical Indicators
Using Price and Volume
Steve Woods
John Wiley & Sons, Inc.
Copyright © 2002 by Steve Woods, Marketplace Books. All rights reserved.
Published by John Wiley & Sons, Inc., New York.
No part of this publication may be reproduced, stored in a retrieval system or transmitted in
any form or by any means, electronic, mechanical, photocopying, recording, scanning
or otherwise, except as permitted under Sections 107 or 108 of the 1976 United States
Copyright Act, without either the prior written permission of the publisher, or authorization
through payment of the appropriate per-copy fee to the Copyright Clearance Center,
222 Rosewood Drive, Danvers, MA 01923, (978) 750-8400, fax (978) 750-4744. Requests to
the publisher for permission should be addressed to the Permissions Department, John
Wiley & Sons, Inc., 605 Third Avenue, New York, NY 10158-0012, (212) 850-6011, fax (212)
850-6008, E-Mail:
This publication is designed to provide accurate and authoritative information in regard to
the subject matter covered. It is sold with the understanding that the publisher is not
engaged in rendering professional services. If professional advice or other expert assistance
is required, the services of a competent professional person should be sought.
This title is also available in print as ISBN 0-471-21553-8 [print version ISBN/s—include cloth
and paper ISBNs, if both are available]. Some content that appears in the print version of this
book may not be available in this electronic edition.
For more information about Wiley products, visit our web site at www.Wiley.com
To the woman who lit up my life and convinced me that
anything was possible, my wife, Martha. And to the two
beautiful daughters she gave me, Catherine and Toby.
“Most good ideas sparkle in simplicity.”
— Estée Lauder
ix
Table of Contents
Acknowledgments . . . . . . . . . . . . . . . . . . . . . . . . . . . . . . . . . . . . . . . . . . . .xi
Introduction — W. D. Gann: The Inspiration for Float Analysis . . . . . xiii
CHAPTER ONE — Watching the Float: The New Look of
Price and Volume Charts and Their Relationship to a
Stock’s Future Price Direction . . . . . . . . . . . . . . . . . . . . . . . . . . . . . . . . 1
The Float . . . . . . . . . . . . . . . . . . . . . . . . . . . . . . . . . . . . . . . . . . . . . . . . . 2
A Float Turnover . . . . . . . . . . . . . . . . . . . . . . . . . . . . . . . . . . . . . . . . . . 2
The First Discovery . . . . . . . . . . . . . . . . . . . . . . . . . . . . . . . . . . . . . . . . 4
Scenario One — The Smart Money and the Losing Money . . . . . . . 5
Scenario Two — The Yin and Yang of Float Analysis . . . . . . . . . . . . . 9
The Importance of the Discovery of Float Turnovers
at Bottoms and Tops. . . . . . . . . . . . . . . . . . . . . . . . . . . . . . . . . . . . . 14
In Search of a Breakout Buy Point:
A Case History of Xicor. . . . . . . . . . . . . . . . . . . . . . . . . . . . . . . . . . 14
A Simple Random Sample Experiment . . . . . . . . . . . . . . . . . . . . . . . 29
CHAPTER TWO — Ten Breakthrough Discoveries
That Will Change the Way You Analyze Stock Charts . . . . . . . . . . . . 47
The Multiple Float Turnover Formation . . . . . . . . . . . . . . . . . . . . . . 49
The Bottom Formation and the Top Formation . . . . . . . . . . . . . . . . 51
The Base of Support within a Correction Formation. . . . . . . . . . . . 53
The Strong Sideways Base of Support in an
Up-Trend Formation . . . . . . . . . . . . . . . . . . . . . . . . . . . . . . . . . . . . 55
The Overhead Base of Support Formation . . . . . . . . . . . . . . . . . . . . 57
The Slow Extension Formation. . . . . . . . . . . . . . . . . . . . . . . . . . . . . . 59
The Fast Extension Formation . . . . . . . . . . . . . . . . . . . . . . . . . . . . . . 61
The Upright Flag Formation . . . . . . . . . . . . . . . . . . . . . . . . . . . . . . . . 65
The Inverted Flag Formation . . . . . . . . . . . . . . . . . . . . . . . . . . . . . . . 67
The Weak Base of Support Formation . . . . . . . . . . . . . . . . . . . . . . . . 69
CHAPTER THREE — Technicals 101:
How to Understand—and Profit from—the Indicators . . . . . . . 73
The Cumulative-Volume Float Indicators . . . . . . . . . . . . . . . . . . . . . 73
The Common Characteristics of Float Turnovers . . . . . . . . . . . . . . 81
CHAPTER FOUR — Support and Resistance Redefined:
Creating a Model of Stock Behavior That Brings Results . . . . . . . 93
The Rising Base of Support. . . . . . . . . . . . . . . . . . . . . . . . . . . . . . . . . 93
The Descending Ceiling of Resistance. . . . . . . . . . . . . . . . . . . . . . . . 96
The Changing Nature of Float Turnovers from Support
to Resistance, and Vice Versa . . . . . . . . . . . . . . . . . . . . . . . . . . . . . . 99
Unique Points of Support and Resistance in Up-Trends
and Down-Trends. . . . . . . . . . . . . . . . . . . . . . . . . . . . . . . . . . . . . . . 99
Support and Resistance in Multiple Turnover Sideways Bases . . . 106
Valid Breakouts. . . . . . . . . . . . . . . . . . . . . . . . . . . . . . . . . . . . . . . . . . 109
A Strategic Challenge. . . . . . . . . . . . . . . . . . . . . . . . . . . . . . . . . . . . . 119
CHAPTER FIVE — Successful Strategies That Made
My Stock Portfolio Grow Tenfold in Sixteen Months . . . . . . . . . . 121
The Mirror Image Dilemma and Its Solutions . . . . . . . . . . . . . . . . 121
Playing the Upside . . . . . . . . . . . . . . . . . . . . . . . . . . . . . . . . . . . . . . . 125
Playing the Downside . . . . . . . . . . . . . . . . . . . . . . . . . . . . . . . . . . . . 128
Final Strategies . . . . . . . . . . . . . . . . . . . . . . . . . . . . . . . . . . . . . . . . . . 131
Summary. . . . . . . . . . . . . . . . . . . . . . . . . . . . . . . . . . . . . . . . . . . . . . . 132
Appendix A—A Compendium of Float Analysis Formations. . . . . 135
Appendix B—The Dilemma of Differing Results Resolved. . . . . . . 197
Bibliography . . . . . . . . . . . . . . . . . . . . . . . . . . . . . . . . . . . . . . . . . . . . . . . 201
Glossary. . . . . . . . . . . . . . . . . . . . . . . . . . . . . . . . . . . . . . . . . . . . . . . . . . . 203
Trading Resource Guide—Tools for Success in Trading. . . . . . . . . . 217
Suggested Reading List . . . . . . . . . . . . . . . . . . . . . . . . . . . . . . . . . . . 219
Internet Sites . . . . . . . . . . . . . . . . . . . . . . . . . . . . . . . . . . . . . . . . . . . . 223
Newsletters of Interest to Traders . . . . . . . . . . . . . . . . . . . . . . . . . . . 224
Index . . . . . . . . . . . . . . . . . . . . . . . . . . . . . . . . . . . . . . . . . . . . . . . . . . . . . 225
Float Analysisx
Acknowledgments
My heartfelt thanks to Jean and Kenneth Wentworth who encouraged and
supported my market efforts.
Also a special thanks goes to Jan Arps — my mentor, business partner, and
friend—who encouraged me to document my discoveries and place a
high value on them.
I especially thank Peter Seitel whose clarity of thinking helped me con-
front the most pertinent ideas in this book. In addition,I thank Janice Fain
Dean, Cheryl Morden, Mary Leonard, Gordon Rothrock, Bill Fix, and
David Wentworth, who helped in the editing process.A special thanks also
goes to Rich Doyle,who was always there to listen and support me in what-
ever I did.
I would also like to thank my publishing attorney, Nina Graybill, as well as
Chris Myers and Jean Eske at Marketplace Books for making the publish-
ing process a smooth and easy one. Also, I would like to thank proofread-
er Joan E. Gordon and book designer Mary Ann Stavros-Lanning for such
excellent work.
In addition, a special thanks for making the stock market come alive goes
to William O’Neil, who founded Investor’s Business Daily and wrote How
to Make Money in Stocks. Mr. O’Neil,you are a great light to the investment
world.
Thanks also to all my market teachers who took the time to write down
their ideas — Ted Warren, Nicolas Darvas, Jesse Livermore, Robert Ed-
wards,John Magee, Benjamin Graham, David Dodd, Gustave Le Bon,Ber-
nard Baruch, Peter Lynch, Martin Zweig, Martin Pring, Gerald Loeb, Stan
Weinstein, Victor Sperandeo, and especially to W.D. Gann, whose ideas
truly made float analysis possible.
xi
TEAMFLY
Team-Fly
®
xiii
Introduction
W. D. Gann: The Inspiration for Float Analysis
When I first studied the stock market in earnest, two short passages in
W.D. Gann’s Truth of the Stock Tape
1
had a profound impact on the way I
looked at price and volume charts. In the first passage, Gann talked about
the amount of volume it took for a stock to make a 23-point move to the
upside. He said that 1.6 million shares traded hands, which was “five or six
times the floating supply.” In the second passage, he talked of a stock in
which the shares were “changing hands about twice each week.”From these
passages, I realized that Gann had a unique way of looking at a stock’s
trading volume. He was treating a company’s tradable shares as a whole
unit, and he was tracking them as they changed hands one or more times.
The moment I read these ideas,I had an epiphany that developed into what
I call float analysis.
The insight seemed simple. I had seen and was fascinated by many high-
flying stocks that rose in price to amazing heights only to come crashing
down to earth. Using Gann’s idea, I imagined a company’s shares as a
changing unit in time — a distance on a chart in which all the shares trad-
ed once. Now I imagined that what probably happened to those high-
flying stocks was that a less-than-savvy group of investors bought the
shares right at the top. With no one else to sell to — they were stuck. Next
I pictured the price dropping below this float turnover at the top. With
overhead supply above the price, this would be a great time to sell.
__________________
1 Gann, W.D. (1976). Truth of the Stock Tape, Lambert-Gann Publishing, Pomeroy, WA.
Float Analysisxiv
To test my idea, I hired Jan Arps to write what is now known as the Woods
Cumulative-Volume Float Indicator. Jan, a successful 30-year veteran of
the commodity and stock markets,develops trading software as an Omega
Research solution provider. Using the software that we developed, I could
hardly contain myself with the results of my studies. My insight was entire-
ly accurate. Every stock that made a top had a float turnover right at the
peak, followed by a sell signal as the price dropped below those who were
“stuck at the top.”
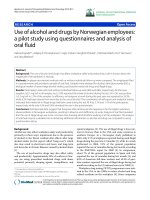
As an introductory example, Cyprus Semiconductor (CY),is shown in fig-
ure i-1. During the nine weeks at the top, the cumulative trading volume
equaled the number of shares in the float. (The nine-week period is
framed by two lines and a dot which will be explained in chapter 1.)
As I continued my research, I made a second discovery of equal importance
to the first: every stock making a bottom always has a float turnover right at
the base (also discussed in chapter 1). These discoveries seemed so pro-
found and yet so elementary that they demanded to be documented. So Jan
and I co-authored an article titled “Float Analysis” for the magazine
During the nine-week top, 73.2 million
shares traded hands. This cumulative
trading volume equals the number of
shares in the float.
Cyprus Semiconductor (CY)
Float = 73.2 million shares
Weekly Chart
28
26
24
22
20
18
16
14
12
24000000
18000000
12000000
6000000
1995 Feb Mar Apr May Jun Jul Aug Sep Oct Nov Dec 1996
Cumulative Trading Volume Equals the
Number of Shares in the Float
Chart created with SuperCharts® by Omega Research, Inc.
Figure i-1
Technical Analysis of Stocks and Commodities (December 1996). In the
months that followed its publication, my phone was constantly ringing. I
talked with brokers, floor traders, fund managers, and investors from all
over the globe who wanted to know more about my discoveries. This book
is the response to all of their inquiries and my attempt to clarify and
expand the ideas that originally appeared in that Stocks and Commodities
article. It is my contention that these ideas are not only of major signifi-
cance in the history of technical stock analysis but that they will change the
way technicians look at price and volume charts.When viewed without the
float,a price and volume chart is an incomplete picture showing only two-
thirds of what one is actually looking at. This book is my attempt to show
the whole picture. I believe that anyone who takes the time to study these
ideas will benefit from them greatly.
I know I have benefited from these ideas. As I will discuss at the end of
Chapter One, in the 16 months from September 1998 to January 2000, I
took a small account of a few thousand dollars and grew it tenfold.My pri-
mary methods and tools are found in this book. To everyone who loves to
study stock charts, I hope this new approach will be as exciting and prof-
itable for you as it has been for me.
— Steve Woods
xvIntroduction