Characterization of longitudinal transformation of T2-hyperintensity in oligodendroglioma
Bạn đang xem bản rút gọn của tài liệu. Xem và tải ngay bản đầy đủ của tài liệu tại đây (1.35 MB, 9 trang )
Heiland et al. BMC Cancer
(2020) 20:818
/>
RESEARCH ARTICLE
Open Access
Characterization of longitudinal
transformation of T2-hyperintensity in
oligodendroglioma
Dieter H. Heiland1,2,3* , Robin Ohle1,2,3, Debora Cipriani1,2,3, Pamela Franco1,2,3, Daniel Delev4,
Simon P. Behriger1,2,3, Elias Kellner5, Gergana Petrova1,2,3, Nicolas Neidert1,2,3, Irina Mader6, Mateo Fariña Nuñez1,2,3,
Horst Urbach3,7, Roman Sankowski3,8,9, Jürgen Beck2,3 and Oliver Schnell1,2,3
Abstract
Background: Oligodendroglioma (ODG) are CNS resistant tumors characterized by their unique molecular
signature, namely a combined deletion of 1p and 19q simultaneously to an IDH1/2 mutation. These tumors have a
more favorable clinical outcome compared to other gliomas and a long-time survival that ranges between 10 and
20 years. However, during the course of the disease, multiple recurrences occur and the optimal treatment at each
stage of the disease remains unclear. Here we report a retrospective longitudinal observation study of 836 MRI
examinations in 44 ODG patients.
Methods: We quantified the volume of T2-hyperintensity to compute growth behavior in dependence of different
treatment modalities, using various computational models.
Results: The identified growth pattern revealed dynamic changes, which were found to be patient-specific an did
not correlate with clinical parameter or therapeutic interventions. Further, we showed that, surgical resection is
beneficial for overall survival regardless the WHO grad or timepoint of surgery. To improve overall survival, an
extent of resection above 50% is required. Multiple resections do not generally improve overall survival, except a
greater extent of resection than in previous surgeries was achieved.
Conclusions: Our data aids to improve the interpretation of MRI images in clinical practice.
Keywords: Oligodendroglioma, MR-imaging, Segmentation
Background
Oligodendroglioma is the third most common type of
diffusely infiltrative glioma, with an annual incidence of
about 0.6 cases per 100,000 people [1] and accounts for
4–15% of all gliomas [2]. In the revised version of the
WHO classification of tumors of the central nervous system of 2016, both histological and molecular parameters
* Correspondence:
1
Translational NeuroOncology Research Group, Medical Center, University of
Freiburg, Freiburg, Germany
2
Department of Neurosurgery, Medical Center, University of Freiburg,
Breisacher Straße 64, 79106 Freiburg, Germany
Full list of author information is available at the end of the article
were included for the first time to define several glioma
entities [3]. Since then, oligodendrogliomas are now characterized by a distinct molecular genotype namely the
1p19q co-deletion along with the simultaneous presence
of an IDH1/2 mutation and are further graded according
to their histopathological degree of malignancy [3].
Although oligodendrogliomas show highly variable clinical courses with overall survival rates ranging between 6
months and more than 20 years [4], the prognosis is relatively favorable with an average long-term survival of
about 15 years. The treatment of oligodendroglioma includes surgical resection, radiotherapy and chemotherapy.
© The Author(s). 2020 Open Access This article is licensed under a Creative Commons Attribution 4.0 International License,
which permits use, sharing, adaptation, distribution and reproduction in any medium or format, as long as you give
appropriate credit to the original author(s) and the source, provide a link to the Creative Commons licence, and indicate if
changes were made. The images or other third party material in this article are included in the article's Creative Commons
licence, unless indicated otherwise in a credit line to the material. If material is not included in the article's Creative Commons
licence and your intended use is not permitted by statutory regulation or exceeds the permitted use, you will need to obtain
permission directly from the copyright holder. To view a copy of this licence, visit />The Creative Commons Public Domain Dedication waiver ( applies to the
data made available in this article, unless otherwise stated in a credit line to the data.
Heiland et al. BMC Cancer
(2020) 20:818
Regarding first line treatment, recently, a prospective randomized trial revealed an improved overall survival for an
initial sequential radio- and chemotherapy with Procarbazine, Lomustine and Vincristine [5]. However, over the
course of the disease, recurrences invariably occur which
require further treatment planning. Against the backdrop
of the relatively low incidence and the usually long course
of the disease, the effects of primary applied therapy overlap
with those of relapse treatment regimens and it becomes
difficult to determine the particular effect of each therapy.
On this basis it can be concluded that there are currently
no specific therapeutic strategies with sufficient evidence
for the recurrent stage of oligodendroglioma. Furthermore,
the direct effects of the therapies, such as radio- and
chemotherapy have only been insufficiently investigated.
For example, the volume reduction of the tumor mass after
surgical removal has been described by other authors [6],
but the knowledge about volume reduction and growth behavior after radio- or different chemotherapies is poor.
This study aims to investigate the longitudinal growth behavior based on changes of T2-hyperintensity, to quantify
the effects of different therapies on tumor growth and to
identify similarities of oligodendroglioma growth patterns.
Page 2 of 9
Tumor segmentation
Tumor growth was analyzed by tumor segmentation
performed using the “NORA” software tool, a web-based
framework for medical image analysis developed by the
Department of Radiology, Medical Physics, University of
Freiburg (). T1-weighted
images with contrast-enhancement as well as T2- and
T2-FLAIR-weighted images were analyzed. Since part of
the patients, in particular in the early follow-up years
(from 2000 to 2008), had not received 3D datasets, a reconstruction of the given axial, coronal and sagittal images was necessary to achieve the best possible
segmentation. We performed tumor segmentation of
contrast-enhanced regions if existing, as well as FLAIR
hyperintense regions. All segmentations were performed
by trained specialists in an in-silico-assisted manual
manner, which means that the tumor areas were supervised, and the algorithm calculated the boundaries according to the supervised markings. The temporal
course of the disease regarding tumor resection and
treatment modalities was reconstructed by accessing
clinical documentation and aligned to the time-points of
follow-up images resulting in a table containing all clinical and image information (Supplementary Table 1).
Methods
Study design and patient cohort
We conducted a retrospective analysis of patients contained on an institutional database of WHO-grades II and
III gliomas. All histological confirmed diagnosis oligodendroglioma (OG) and oligoastrocytoma (OA) were selected and re-classified in accordance to the revised WHO
classification of 2016, including a molecular analysis of
IDH 1/2 mutation and 1p19q co-deletion. We subsequently selected patients with a minimum follow-up of 5
years and a total number of at least 15 follow-up MRI
scans. Then, a reconfirmation of the IDH mutation status
and the 1p19q co-deletion was performed, resulting in 44
patients who were finally enrolled in the study. All patients received a neurosurgical intervention at the Department of Neurosurgery, University Hospital Freiburg,
Germany between 2000 to 2018. An informed consent for
the scientific exploration of clinical and biological data
consistent with the local ethical standards and the Declaration of Helsinki was available from all patients. The study
was approved by the ethic committee University of Freiburg (protocol 472/15_160880). The methods were carried out in accordance with the approved guidelines.
Histopathological and molecular diagnostics
Tissue samples were fixed using 4% phosphate buffered
formaldehyde and paraffin-embedded according to standard procedures. Analysis were performed in the Institute
of Neuropathology, Medical-Center University of Freiburg
as detailed described in our previous works [7, 8].
Normalization and fitting
We started the model by normalization of all patients
into a time-dependent multidimensional matrix containing tumor volume in the T2-weighted as well as in the
T1-weighted contrast enhancing images, time point of
surgical procedures and time interval for radio- and different chemotherapies. We centered an z-scored (1) each
individual volumina and fitted the growth curves by
loess-fit (2) from the stats-package (R-software) to extrapolate the gaps between follow-up timepoints.
n
A expi − minðAexp Þ
b ðn expi Þ ¼ 1 P K h
(1) n expi ¼ maxðA
(2)
f
h
Þ
−
minðA
Þ
n
exp
exp
i¼1
ðnexp − n expi Þ
K is the kernel and 0.8 > h > 0.2 is used to adjust the
estimator. The model is used for further evaluation of
therapy modalities.
Model extent of resection
The extent of resection was defined based on the presurgical volume: MRI(ts-1) (ts is timepoint of surgery) and
the postsurgical MRI within 3 months: mean (MRI(ts + 1…
n)) (n contained all MRI within 3 months). In some
cases, direct postoperative images or early postoperative
MRI showed more frequently unspecific T2hyperintensity artefacts. In order to overcome this bias,
we used the mean of all MRIs within 3 months postoperative. Differences in extent of resection was tested by
Heiland et al. BMC Cancer
(2020) 20:818
Mann-Whitney-U-Test, significant was determined by
p < 0.05.
Model of therapy responses
Therapy response was computed by the dynamic changes
during a period of 1.5 year after initial treatment. We used
the loess-fit model described above to compare dynamic
changes as response of a treatment. A “Partitioning
Around Medoids” (PAM) cluster was used to group all responses based on their similarity. We used gap-statistics
to compute the optimal number of clusters.
Cox-regression model
We performed a Cox proportional-hazards regression
model using the “survival” package in R-software in
order to estimate overall survival and log-rank tests to
compare our cohort or cluster groups. Hazard ratios and
95% confidence intervals were estimated performing a
Cox proportional-hazards regression model including a
10-fold cross-validation such as reported recently [9].
We determine the alpha-level at 5% to achieve statistical
significance with a power of > 80%. Patients who continue to live or whose survival is not evident are censored in the analysis, a detailed description is given in a
recent publication [9].
Cox-regression model with time-dependent covariates
As detailed described in our recent work [9], we were
challenging the meaningfulness of a classical Cox
proportional-hazards regression model. This model is
biased due to the fact that only patients who reach a certain survival may receive an additional therapy at a later
stage. Another bias is caused by the fact that some patients were censored but showed multiple recurrences in
their history. To overcome the limitations of a classical
Cox regression model, we included all recurrences and
added a time-depended-covariates to the model [9]. We
binned the variable ‘recurrences’ into its individual time
intervals and were thus able to individually analyze
therapeutic responses within the duration of the whole
course of the disease [9]. Further, multivariate regression
was performed including outcome-dependent variables,
a detailed description is given in a recent publication [9].
Results
Patient cohort and molecular reclassification
We started our investigation by screening the MedicalDatabase Freiburg, resulting in 212 patients who
matched the diagnosis of oligodendroglioma (OG) and
oligoastrocytoma (OA), from which 96 were correctly
re-classified as true OG according to the 2016 revised
WHO classification of tumors of the central nervous system. In order to warrant consistent data quality, we
sorted out all patients who were not able to reach the
Page 3 of 9
quality criteria we defined (methods part). For further
analysis, we enrolled 44 patients, which reflected the low
incidence of molecular defined Oligodendroglioma.
Most frequently the tumor was observed in the frontal
lobe (n = 35), here also localizations with multi-lobular
extension were counted. Less often were temporal (n =
11), parietal (n = 8) or occipital (n = 2) localizations,
Fig. 1a. In our cohort, gender and age was well balanced
similar to previous works [8].
T2-Hyperintensitivity reflect longitudinal tumor growth
In order to investigate longitudinal changes of tumor
growth we aimed to identify an MRI surrogate parameter, which on the one hand should be widely available
and on the other hand be contained in MRI recordings
at the early stages of some long-term survivors (year ~
2000). Due to the large heterogeneity of available images
with regard to image quality, various MR scanners and
multiple MR-protocols, only a limited number of MR sequences could be considered for further analyses. We
measured the T2-hyperintensity, FLAIR-hyperintensity,
T1 +/− contrast and found an expectable correlation between FLAIR and T2 hyperintensity whereby, the T2hyperintensity was measurable within 96.2% of all
imaging records while FLAIR imaging was in less than
80% available (no sagittal FLAIR sequences). Although
the T2 hyperintensity does not allow for a doubtless determination of the tumor volume, the error within the
entire cohort is relativized. Our data contained an expectable low frequency of T1-contrastenrichment of the
ODG (34%) which clearly indicate active tumor regions
(pre-treatment), in contrast, changes of the T2 hyperintensity are susceptible to non-specific changes and not
indicate active parts of the tumor. When comparing volume from T1 contrast-enrichment and T2 hyperintensity, a relatively high correlation was obtained (R2 = 0.34,
p < 0.001), Fig. 1b. We assume that based on our available data, T2 hyperintensity volume can be sufficiently
used to determine the volume of OGD in a longitudinal
observation study.
Diversity of tumor size and longitudinal volume
transformation
In a next step, we mapped minimal and maximal tumor
volume of our patients and found a strong variance
ranged between 10.16 ml and 141.06 ml (maximal tumor
size), Fig. 1c. No significant difference was found between WHO grad II and III patients (WHO grade II:
54.13 ml vs. WHO grade III: 51.65 ml p = 0.79). By comparison of the individual growth curves, determined by
the longitudinal changes of T2-hyperintensity volume,
we observed a pronounced heterogeneity of growth behavior, Fig. 1d. In order to find similarities in the behavior, we performed clustering, which resulted in 4
Heiland et al. BMC Cancer
(2020) 20:818
Page 4 of 9
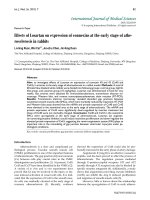
Fig. 1 a Overview of major characteristics of the cohort, distribution of age, gender and tumor localization (b) A scatter plot indicate the
correlation between T1 contrast enriched volume and T2-hyperintensity volume. c A waterfall plot illustrates the minimal and maximal volume
(T2-hyperintensity) and the volume at first diagnosis, colors indicate the determined WHO grade. d Line plots show individual growth curves
based on T2-hyperintensity changes over the course of the disease. Each patient is colored differently. Time marked the individual course of the
disease, Timpoint:0; Day of initial diagnosis. e Heatmap of loess fitted growth curved (Time ~ T2-hyperintensity changes), darker colors show less
growth, brighter colors indicate timepoints of increased growing. At the left side, clinical characteristics are aligned to each patient (as rows). On
the right side, an example of one patient was shown in order to improve understanding of the heatmap, including the heatmap, growth curve
and corresponding T2-MRI images. At the right bottom, the color code for clinical parameters is given
clusters reflecting 3 different patterns, Fig. 1e. As expected, the growth peak (measured as maximum volume) can be found either at the beginning (cluster 1
early maximum, and cluster 2 prolonged time to maximum), during or at the end of the disease. We were not
able to identify any significant accumulation of clinical
parameters in these clusters, nor was there any difference between WHO grade II or III tumors. Hence, we
suspect that these differences are due to various response to the received treatments and intend to investigate this in greater detail in the following sections.
Extent of resection and surgical treatment
The surgical treatment of OGD is undisputed and associated with a significant increase in overall survival.
However, it remains unclear when is the best time for
resection and how effective is resection at the recurrent
stage? Is prior chemotherapy or radiotherapy beneficial?
In order to address these questions, we analyzed 61 resections from 38 patients (6 patients underwent only biopsy before adjuvant treatment). The number of
surgeries per patient ranged between a single to 4 resections over the course of the disease. We observed a
Heiland et al. BMC Cancer
(2020) 20:818
median reduction of the T2-hyperintensity volume from
57.8 ml to 24.4 ml (57.78%, p = 0.0018) and a reduction
of T1-contrast enriched volume from 3.54 ml to 0.564
ml (84.06%, p = 0.0051), Fig. 2a-b. Four patients showed
a pronounced volume after resection due to unspecific
T2-hyperintensity increase in early postoperative imaging. From a surgical point of view, not all tumor locations are equally accessible, some localizations are more
approachable than others. In our cohort 64.4% of the resections were performed at the frontal lobe which is
relatively easily accessible. In comparison to other localizations, however, there is no improved extent of resection (measured in volume reduction) compared to
frontal tumors (reduction frontal 58.23% vs. non-frontal
52.5%, p = n.s.), Fig. 2c. In our cohort, only 17.85% of
the patients (n = 10) received a resection at first diagnosis, Fig. 2d, the extent of resection did not differ between
initial resection or resection at a later time point with
previously received treatments (p = n.s.), Fig. 2e. Further,
we observed an expected significant difference between
primary and recurrent resections (p = 0.013) with lower
extent of resection in the recurrent stage of the disease,
Fig. 2f. No difference regarding the extent of resection
Page 5 of 9
was observed between WHO grad II and III ODG (p =
n.s.), Fig. 2g. In summary, resection can be performed
without significant differences of extent of resection at
multiple timepoints during the disease, the extent of resection measured by T2 hyperintensity is lower than reported for malignant tumors, which is expectable due to
the infiltrative nature of the disease. A conclusion on
how patients benefit from resections at varying timepoints is not possible without considering the other
therapy modalities and will be examined in the following
in a multivariate analysis.
Adjuvant and neo-adjuvant treatment of OGD
In addition to surgical treatment, radio- and chemotherapy represent the second pillar of OGD therapy. The
large variance of chemotherapies in use substantially
complicates the accurate evaluation of individual effects
of chemotherapy. So far, the standard chemotherapeutic
agent is a combination of Procarbazine, Lomustine
(CCNU) and Vincristine (PCV), due to toxic effects, especially neurotoxic effects of vincristine, often only PC
(Procarbazine, Lomustine) was used. Temozolomide
Fig. 2 a Scatter plot of T2-hyperintensity volume. b Scatter plot of T1-contrast enrichment volume pre- and postsurgery of ODG. Colors indicate
the WHO grade and black lines illustrate median difference between pre- and postsurgery. Significance was tested by Wilcoxon Rank Sum test. c
Connected lines illustrate the difference between pre- and postsurgery volume in frontal (n = 45) surgeries and non-frontal (n = 16) surgeries,
significance was tested by Wilcoxon Rank Sum test. d Scatter plot of time-dependent (x-axis) differences of extent of resection (y-axis percentage
of resected tumor). Shapes indicate the number of surgeries and colors indicate WHO grade (upper plot) or localizations (bottom plot). e Density
of percentage of resection (x-axis) between initial or late onset resection as indicated by the colors. f Density of percentage of resection (x-axis)
between primary and recurrent tumor as indicated by the colors. g Density of percentage of resection (x-axis) between WHO grade II and III as
indicated by the colors
Heiland et al. BMC Cancer
(2020) 20:818
(TMZ) has also been widely used for therapy, especially
in later stages of therapy and in recurrent tumors. In
order to obtain an overview of the therapeutic effects of
different treatment modalities, we used a similar approach as applied above, and analyzed the T2hyperintensity dynamics from the timepoint of chemotherapy initiation to a follow-up timepoint (2 years) (79
adjuvant treatments of 44 patients). We found three distinct temporal T2-pattern using unsupervised clustering,
Fig. 3a. In order to obtain a more accurate impression of
the T2 changes within the clusters, we have traced the
mean growth-curves indicating that cluster 1 (n = 47
treatments, 59%) demonstrates a constant growth in T2hyperintensity volume after therapy (PC 34%, Radiotherapy (RT), 23%, TMZ + RT 23%, TMZ 14%, PCV 2%).
However, in addition to this most anticipated growth behavior, two additional clusters appeared, which reflect
the complexity of MRI interpretation in the treatment of
ODG. Approximately 40% of the administrated therapies
do not fit into the expected response and showed an
early “pseudo”-progress (early T2-hyperintensity increase) followed by an agitated high dynamic response
(generally lower volume compared to initial, pretherapeutic volume, cluster 2) or a likely linear decrease
of volume (cluster 3), Fig. 3b. Across all clusters, no significant enrichment of clusters or clinical features was
obtained, Fig. 3c. In summary, here we described the
Page 6 of 9
different responses to adjuvant- and neoadjuvant treatment, showed that volume changes are highly dynamic
and only approximately half of the patient showed the
expected response pattern.
Adjuvant and neo-adjuvant treatment of OGD
Based on our gained information regarding the heterogenous
response in general growth behavior and to different treatment modalities, we finally aimed to identify parameter that
have impact on the course of the disease. We used a multivariate Cox proportional-hazards regression model with
tumor relapse as a time-depended-covariates, which allowed
us a more precise prediction of survival relevant parameters.
First, we analyzed to what extent different growth properties
as described in the first part of the analysis impact overall survival. We were not able to identify a growth pattern which
was associated with beneficial clinical outcome, Fig. 4a. Additionally, WHO grade, numbers of resection (more or less
than 2), gender did not change outcome of the patients, Fig. 4
b-d. Next, we validated the extent of resection and found a
significant improvement of survival in patients with less residual tumor than 25 and 10%, Fig. 4e. All other parameters
(including chemo- or radiotherapy) did not reach significance.
Further, we used the overall survival and the extent of resection (maximal extent in patients that receive multiple resections) to create a prediction model. By use of this model, we
Fig. 3 a Heatmap of loess fitted growth curve of a 2 years interval after initiation of radio- or chemotherapies (Time ~ T2-hyperintensity changes),
darker colors show less growth, brighter colors indicate timepoints of increased growing. At the left side, clinical characteristics are aligned to
each therapy (as rows). At the right bottom, the color code for clinical parameters is given. b) Mean fitted curve of patients with similar growth
behavior merged into cluster 1–3. c) Percentage of therapies or clinical features in each cluster, illustrated as dots (colored according to
percentage) with size according to percentage, larger dots indicate higher percentage
Heiland et al. BMC Cancer
(2020) 20:818
Page 7 of 9
Fig. 4 a-d Survival curves based on Kaplan-Meier statistics for growth pattern of T2-Hyperintensity clusters (a) number of resections (b), WHO
grade (c) and Gender (d). e Cox-Regression of multiple clinical features, *p < 0.05, **p < 0.01, (f) Loess model of overall survival ~percentage of
residual tumor
demonstrated that increased overall survival was obtained in
patients with less than 50% of residual tumor, Fig. 4f.
Discussion
The proper oncological treatment of oligodendroglioma
represents a challenge due to the highly variable clinical
course of the disease with survival rates between few
years and more than two decades [4]. Two crucial prospective trials over the past few years showed a favorable
response to combined radio- and chemotherapy in
WHO grade III oligodendroglioma and oligoastrocytoma
[10, 11]. One drawback of these important studies is the
lack of detailed molecular information, which hampers
the result interpretation into the spotlight of the revised
version of the WHO classification. Furthermore, there is
still an ongoing debate to which extent WHO grade II
tumors should be treated, especially in young patients.
In this case, the maintenance of quality of life should be
one of the highest priorities and needs to be weighed
against the risks and benefits of treatment [12]. Here we
report a relatively small cohort of 44 molecular defined
oligodendroglioma, reflecting the rarity of this tumor entity. Although the limited number of patients in our analysis, we were able to achieve a total number of 836 MRI
images which allowed us to map the transformation of
tumor volume over time. Based on these findings we observed a strong variability regarding time-depended
changes of tumor volume without significant association
to clinical features. This reflects daily practice, whereas
dynamic changes of tumor volume difficult to interpretative and severely hamper clinical decisions. We identified that this dynamic pattern could be also observed
after different therapies without correlations to a specific
therapy.
Although recent trials investigated specific treatment
regimens, such as initial sequential radio- and chemotherapy with Procarbazine, Lomustine and Vincristine
[5] or the role of surgery [6, 8], the impact of those therapies in the recurrent stages of the disease remains questionable. In the recurrent stage of advanced disease,
there is a lack of evidence of which therapies provide the
greatest benefit, and there are no valid instruments for
monitoring the success of therapy.
We were not able to identify different responses of
chemo- or radiotherapy when administrated initially or
during the disease. However, we did not observe a benefit of a single chemo reagent likely due to multiple therapies which strongly bias the effect of a single treatment.
Heiland et al. BMC Cancer
(2020) 20:818
Our cohort, each patient was at least treated with two
treatment modalities, therefore the evaluations regarding
individual therapies could not to be used.
Surgery of oligodendroglioma are also controversy discussed, especially in the later stage of the disease and if
only a small amount of the tumor is respectable due to
eloquent localization. Recent studies showed a clear significant improvement of overall survival in resected patients [13–15], but recurrent surgeries, however,
multiple resections in OGD revealed no additional benefit for the patient [8]. Our work can largely confirm these
obtained results. Further, in contrast to different chemotherapy regimens, resection is able to stand out with significant survival improvement although the data are
relatively fuzzy and biased through multiple therapies. In
contrast to published data [8, 16, 17], we found that patients benefit from a resection if the residual tumor is less
than 50%. Based on our results we would like to
emphasize that the success of a resection is not binary but
rather a function that reflects a negative correlation between survival and residual tumor. From this perspective
it seems to be more important to perform safe resections
to ensure maximum preservation of neurological function,
but if less than 50% can be resected the patient does not
seem to have any benefit.
The study contains numerous limitations starting with
the small number of patients due to the overall low incidence of oligodendrogliomas and the monocentric character of the study. To better characterize the results,
molecular data would be essential to explain the underlying mechanisms of the different growth behavior. Another bias are different surgical treatments of temporal,
frontal or parietal localized tumors. In general, we were
not able to find a relationship between the extent of resection and the overall survival of the patients due to multiple
resections in the course of the disease. On the basis of our
findings, we plan to further investigate the molecular
architecture that could explain the difference of temporal
and frontal oligodendrogliomas. The comparison of a
newly established classification with the current WHO
classification is not straightforward due to the fact that patients received grade-dependent therapy, a correct comparison is impossible. Nevertheless, there aren’t any more
accurate methods available to provide an unbiased comparison in these rare tumors.de dependent therapy makes
a correct comparison impossible.
Conclusions
We conclude with two major findings:
1.) OGD are rare tumors which demonstrate a highly
dynamic growth pattern with variable changes of T2
MRI imaging. Changes are individual and do not correlate with clinical parameter of therapeutic interventions.
Page 8 of 9
2.) Surgical resection is beneficial for overall survival,
but the time point of resection (initial vs. late onset) is
not important. For each resection, “the more the better”,
but at least 50% of the tumor needs be resected to
achieve an improvement for the patient. Multiple resections do not improve the patient survival, except it is
possible to achieve a greater extent of resection than in
previous surgeries.
Supplementary information
Supplementary information accompanies this paper at />1186/s12885-020-07290-6.
Additional file 1 Supplementary Table 1. Clinical baseline data of the
cohort.
Abbreviations
GBM: Glioblastoma; ODG: Oligodendroglioma; OA : Oligoastrocytoma;
CNS: Central Nervous System; WHO: World Health Organization;
TMZ: Temozolomide; PC: Procarbazine + Lomustine; PCV: Procarbazine +
Lomustine + Vincristin
Acknowledgements
No
Authors’ contributions
All authors have read and approved the manuscript. Collection of data,
performing of tumor volumetry, writing of portion of the manuscript: RO;
writing of portion of the manuscript: DC, PF; conception and study design,
analysis and interpretation of data, writing of portion of the manuscript:
DHH; submitting of manuscript: PF; development of the software for tumor
volumetry: EK; providing of imaging, interpretation of imaging, contribution
to editing of the manuscript: IM, HU; analysis of neuropathology: R.S.;
contribution to editing of the manuscript: O.S., D.D., S.P.B, G.P., N.N., J.W.,
M.T.F.-N., J.B.;
Funding
The authors didn’t receive any funding for this conduction of this study.
Open Access funding provided by Projekt DEAL.
Availability of data and materials
The datasets used and analyzed during the current study are available from
the corresponding author on reasonable request.
Ethics approval and consent to participate
An informed consent for the scientific exploration of clinical and biological
data consistent with the local ethical standards and the Declaration of
Helsinki was available from all patients. Written informed consent was
obtained from all patients. The study was approved by the ethic committee
University of Freiburg (protocol 472/15_160880). The methods were carried
out in accordance with the approved guidelines.
Consent for publication
Not applicable
Competing interests
No potential conflicts of interest were disclosed by the authors.
Author details
1
Translational NeuroOncology Research Group, Medical Center, University of
Freiburg, Freiburg, Germany. 2Department of Neurosurgery, Medical Center,
University of Freiburg, Breisacher Straße 64, 79106 Freiburg, Germany.
3
Medical Faculty, Freiburg University, Freiburg, Germany. 4Department of
Neurosurgery, University of Aachen, Aachen, Germany. 5Medical Physics,
Department of Radiology, Medical Centre - University of Freiburg, Freiburg,
Germany. 6Clinic for Neuropediatrics and Neurorehabilitation, Epilepsy Center
for Children and Adolescents, Schön Klinik, Vogtareuth, Germany.
Heiland et al. BMC Cancer
(2020) 20:818
7
Department of Neuroradiology, Medical Center - University of Freiburg,
Freiburg, Germany. 8Institute of Neuropathology, Medical Center - University
of Freiburg, Freiburg, Germany. 9Berta-Ottenstein-Programme for Clinician
Scientists Medical Center, University of Freiburg, Freiburg, Germany.
Received: 28 April 2020 Accepted: 11 August 2020
Page 9 of 9
17. Snyder LA, Wolf AB, Oppenlander ME, Bina R, Wilson JR, Ashby L, et al. The
impact of extent of resection on malignant transformation of pure
oligodendrogliomas. J Neurosurg. 2014;120:309–14. />2013.10.JNS13368.
Publisher’s Note
Springer Nature remains neutral with regard to jurisdictional claims in
published maps and institutional affiliations.
References
1. Ho VKY, Reijneveld JC, Enting RH, Bienfait HP, Robe P, Baumert BG, et al.
Changing incidence and improved survival of gliomas. Eur J Cancer. 2014;
50:2309–18. />2. Simonetti G, Gaviani P, Botturi A, Innocenti A, Lamperti E, Silvani A. Clinical
management of grade III oligodendroglioma. Cancer Manag Res. 2015;7:
213–23. />3. Louis DN, Perry A, Reifenberger G, von Deimling A, Figarella-Branger D,
Cavenee WK, et al. The 2016 World Health Organization classification of
tumors of the central nervous system: a summary. Acta Neuropathol. 2016;
131:803–20. />4. Halani SH, Yousefi S, Velazquez Vega J, Rossi MR, Zhao Z, Amrollahi F, et al.
Multi-faceted computational assessment of risk and progression in
oligodendroglioma implicates NOTCH and PI3K pathways. npj Precision
Onc. 2018;2:24. />5. van den Bent MJ, Brandes AA, Taphoorn MJB, Kros JM, Kouwenhoven MCM,
Delattre J-Y, et al. Adjuvant procarbazine, lomustine, and vincristine
chemotherapy in newly diagnosed anaplastic oligodendroglioma: long-term
follow-up of EORTC brain tumor group study 26951. J Clin Oncol. 2013;31:
344–50. />6. Aghi MK, Nahed BV, Sloan AE, Ryken TC, Kalkanis SN, Olson JJ. The role of
surgery in the management of patients with diffuse low grade glioma: a
systematic review and evidence-based clinical practice guideline. J NeuroOncol. 2015;125:503–30. />7. Diamandis E, Gabriel CPS, Würtemberger U, Guggenberger K, Urbach H,
Staszewski O, et al. MR-spectroscopic imaging of glial tumors in the
spotlight of the 2016 WHO classification. J Neuro-Oncol. 2018;139:431–40.
/>8. Delev D, Heiland DH, Franco P, Reinacher P, Mader I, Staszewski O, et al.
Surgical management of lower-grade glioma in the spotlight of the 2016
WHO classification system. J Neuro-Oncol. 2019;141:223–33. />10.1007/s11060-018-03030-w.
9. Fariña Nuñez MT, Franco P, Cipriani D, Neidert N, Behringer SP, Mader I,
et al. Resection of recurrent glioblastoma multiforme in elderly patients: a
pseudo-randomized analysis revealed clinical benefit. J Neuro-Oncol. 2020.
/>10. Buckner JC, Shaw EG, Pugh SL, Chakravarti A, Gilbert MR, Barger GR, et al.
Radiation plus Procarbazine, CCNU, and vincristine in low-grade Glioma. N
Engl J Med. 2016;374:1344–55. />11. Wick W, Hartmann C, Engel C, Stoffels M, Felsberg J, Stockhammer F, et al.
NOA-04 randomized phase III trial of sequential radiochemotherapy of
anaplastic glioma with procarbazine, lomustine, and vincristine or
temozolomide. J Clin Oncol. 2009;27:5874–80. />2009.23.6497.
12. Torensma R. The Dilemma of Cure and Damage in Oligodendroglioma:
Ways to Tip the Balance Away from the Damage. Cancers (Basel). 2018;10.
/>13. Roelz R, Strohmaier D, Jabbarli R, Kraeutle R, Egger K, Coenen VA, et al.
Residual tumor volume as best outcome predictor in low grade Glioma - a
nine-years near-randomized survey of surgery vs. Biopsy Sci Rep. 2016;6:
32286. />14. Jakola AS, Skjulsvik AJ, Myrmel KS, Sjåvik K, Unsgård G, Torp SH, et al.
Surgical resection versus watchful waiting in low-grade gliomas. Ann Oncol.
2017;28:1942–8. />15. Jakola AS, Myrmel KS, Kloster R, Torp SH, Lindal S, Unsgård G, et al.
Comparison of a strategy favoring early surgical resection vs a strategy
favoring watchful waiting in low-grade gliomas. JAMA. 2012;308:1881–8.
/>16. Kinslow CJ, Garton ALA, Rae AI, Marcus LP, Adams CM, McKhann GM, et al.
Extent of resection and survival for oligodendroglioma: a U.S. populationbased study. J Neuro-Oncol. 2019;144:591–601. />s11060-019-03261-5.