General Troubleshooting
Bạn đang xem bản rút gọn của tài liệu. Xem và tải ngay bản đầy đủ của tài liệu tại đây (460.38 KB, 30 trang )
Chapter 9. General Troubleshooting
It is a common experience amongst all of us that from
time to time our computers don't always work as we
expect and we need to hunt down and resolve
problems with them. Troubleshooting can be time
consuming especially if you have limited experience
with the software or system you are using. This
chapter is a guide on how to solve problems with your
FreeNAS server. It covers where to look for
information about the problem as well as how to hunt
down problems by being methodical. It also looks at
the common problems people have with their
FreeNAS servers including networking problems and
problems with RAID.
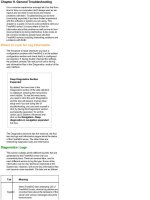
Where to Look for Log Information
The first place to head whenever you have a
configuration problem with FreeNAS is to the related
configuration section and check that it is configured
as expected. If, having double checked the settings,
the problem persists, the next port of call is the log
and information files in the Diagnostics: section of the
web interface.
Keep Diagnostics Section
Expanded
By default, the menu tree in the
Diagnostics section of the web interface
is collapsed, meaning the menu items
aren't visible. To see the menu items,
you need to click the word Diagnostics
and the tree will expand. During initial
setup and if you are doing lots of
troubleshooting, you can save yourself a
click by having the Diagnostics section
permanently expanded. To set this
option, go to System: Advanced and
click on the Navigation - Keep
diagnostics in navigation expanded
tick box.
The Diagnostics sections has five sections, the first
two are logs and information pages about the status
of the FreeNAS server. The other three are
networking diagnostic tools and information.
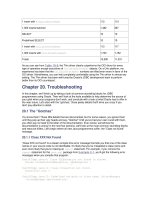
Diagnostics: Logs
This section collates all the different log files that are
generated by the FreeNAS server into one
convenient place. There are several tabs, one for
each different service to log file type. Some of the
information can be very technical, especially in the
System tab. However, with some key information they
can become more readable. The tabs are as follows:
Tab Meaning
System
When FreeBSD (the underlying OS of
FreeNAS) boots, various log entries are
recorded here about the hardware of the
server and various messages about the
boot process.
FTP
This shows the activity on the FTP
server including successful logins and
failed logins.
RSYNC
The log information for the RSYNC
server (see chapter 7) is divided into
three sections: Server, Client, and
Local. Depending on which type of
RSYNC operation you are interested,
click the appropriate tab.
SSHD
Here you will find log entries from the
SSH server including some limited
startup information and records of logins
and failed login attempts.
SMARTD
This tab logs the output of the S.M.A.R.T
daemon. See chapter 8 for more details
on S.M.A.R.T.
Daemon
Any other minor system service like the
built-in HTTP server, the Apple Filing
Protocol server and Windows
networking server (Samab) will log
information to this page.
UPnP
The log information from the FreeNAS
UPnP server called "MediaTomb" is
displayed here. The logging can be
quite verbose so careful attention is
needed when reading it. Don't be
distracted by entires such as "INFO:
Config: option not found:" as this is just
the server logging that it will be using a
default value for that particular attribute.
Settings
The settings tab allows you to change
how the log information is displayed
including the sort order and the number
of entries shown.
What is a Daemon?
In UNIX speak, a Daemon is a system
service. It is a program that runs in the
background performing certain tasks.
The Daemons in FreeNAS don't work
with the users in an interactive mode
(via the monitor, mouse, and keyboard)
and as such need a place to log the
results (or problems) of their actives.
The FreeNAS Daemons are launched
automatically by FreeBSD when it boots
and some are dependent on being
enabled in the web interface.
Understanding Diagnostics—Logs:
System
The most complicated of all the log pages is the
System log page. Here, FreeBSD logs information
about the system, its hardware, and the startup
process. At first, this page can seem intimidating but
with a little help, this page can be very helpful
particularly in tracking down hardware or driver
related problems.
50 Log Entries Might Not be Enough
The default number of log entries shown
on the Diagnostics: Logs page is 50.
For most situations, this will be sufficient
but there can be times when it is not
enough. For example in the Diagnostics:
Logs: System tab, the total number of
log entries made during the boot up
process is more than 50. If you want to
see how much system memory has
been recognized by FreeBSD, you won't
find it within the standard 50 entries. The
solution is to increase the Number of
log entries to show parameter on the
Diagnostics: Logs: Setting tab.
The best way to learn to read the Diagnostics: Logs:
System page is by example, below are several
different log entry examples including logs about the
CPU, memory, disks, and disk controllers:
kernel: FreeBSD 6.2-RELEASE-p11 #0: Wed Mar 12 18:17:49 CET 2008
This first entry shows the heritage of the FreeNAS
server. It is based on FreeBSD and in this particular
case, we see that this version of FreeNAS is using
FreeBSD 6.2. There are plans (which may have
already become reality) to use FreeBSD version 7.0
as the base for FreeNAS.
kernel: CPU: Intel(R) Xeon(TM) CPU 1.70GHz (1680.52-MHz 686-class CPU)
Here, the type of CPU that was detected by the
FreeBSD is displayed. In this case, it is an Intel Xeon
CPU running at 1.7GHz.
kernel: FreeBSD/SMP: Multiprocessor System Detected: 2 CPUs
If your system has more than one CPU or is a dual
core machine then you will see an entry in the log file
(like the one above) recognizing the second CPU. If
your machine has Hyper-threading technology, then
the second logical processor will be reported like
this: Logical CPUs per core: 2
Apr 1 11:06:00 kernel: real memory = 268435456 (256 MB)
Apr 1 11:06:00 kernel: avail memory = 252907520 (241 MB)
These log entries show how much memory the
system has detected. The difference in size between
real memory and available memory is the difference
between the amount of RAM physically installed in the
computer and the amount of memory left over after
the FreeBSD kernel is loaded.
kernel: atapci0: <Intel PIIX4 UDMA33 controller> port 0x1f0-0x1f7,0x3f6,0x170-0x177,0x376,0x1050-0x105f at device 7.1 on pci0
kernel: ata0: <ATA channel 0> on atapci0
kernel: ata1: <ATA channel 1> on atapci0
For disks to work on your FreeNAS server, a disk
controller is needed and it will be either a standard
ATA/IDE controller, a SATA controller or a SCSI
controller. Above are the log entries for a standard
ATA controller built into the motherboard. You can
see that it is an Intel controller and that two channels
have been seen (the primary and the secondary).
kernel: atapci1: <SiS 181 SATA150 controller> irq 17 at device 5.0 on pci0
kernel: ata2: <ATA channel 0> on atapci1
kernel: ata3: <ATA channel 1> on atapci1
Like the ATA controller listed a moment ago, SATA
controllers are all recognized at boot up. Here is a
SiS 181 SATA 150 controller with two channels. They
are listed as devices ata2 and ata3—as ata0 and
ata1 are used by the standard ATA/IDE controller.
kernel: mpt0: <LSILogic 1030 Ultra4 Adapter> irq 17 at device 16.0 on pci0
Like IDE and SATA controllers, all recognized SCSI
drivers are listed in the boot up system log. Here, the
controller is an LSILogic 1030 Ultra4.
kernel: ad0: 476940MB <WDC WD5000AAJB-00YRA0 12.01C02> at ata0-master UDMA100
kernel: ad4: 476940MB <Seagate ST3500320AS SD04> at ata2-master SATA150
Once the disk controllers are recognized by the
system, FreeBSD can search to see which disks are
attached. Above is an example of a Western Digital
500GB hard drive using the standard ATA100
interface at 100MB/s. There is also a 500GB
Seagate drive connected using the SATA interface.
acd0: CDROM <TOSHIBA CD-ROM XM-7002B/1005> at ata1 as master UDMA33
When the CDROM (which is normally attached to an
ATA/IDE controller) is recognized, it will look like the
above.
kernel: da0 at ahd0 bus 0 target 0 lun 0
kernel: da0: <MAXTOR ATLAS10K4_73WLS DFL0> Fixed Direct Access SCSI-3 device
kernel: da0: 320.000MB/s transfers (160.000MHz, offset 127, 16bit), Tagged Queueing Enabled
kernel: da0: 70149MB (143666192 512 byte sectors: 255H 63S/T 8942C)
SCSI addressing is a little more complicated than
that of ATA/IDE. In SCSI land, you have a controller, a
channel (bus), a disk (target), and the Logical Unit
Number (LUN). The example above shows that a disk
(which has been assigned the device name da0) is
found on the controller ahd0 on bus 0, as target 0
with the LUN 0. SCSI controllers can have multiple
buses and multiple targets. Further down, you can
see that the disk is a MAXTOR 73GB SCSI-3 disk.
kernel: da0 at umass-sim0 bus 0 target 0 lun 0
kernel: da0: <Verbatim Store 'n' Go 1.30> Removable Direct Access SCSI-2 device
kernel: da0: 40.000MB/s transfers
kernel: da0: 963MB (1974271 512 byte sectors: 64H 32S/T 963C)
If you are using a USB flash disk for storing the
configuration information, it will most likely appear in
the log file as a type of SCSI disk. The above
example shows a 1GB Verbatim Store 'n' Go disk.
kernel: lnc0: <PCNet/PCI Ethernet adapter> irq 18 at device 17.0 on pci0
kernel: lnc0: Ethernet address: 00:0c:29:a5:9a:28
Another important device that needs to work correctly
on your system is the network interface card. Like
disk controllers and disks, it will be logged in the log
file when FreeBSD recognizes it. Above is an
example of an AMD Lance/PCNet-based Ethernet
adapter. Each Ethernet card has a unique address
know as the Ethernet address or the MAC address. It
is made up of 6 numbers specified using a colon
notation. Once found, FreeBSD queries the card to
find its MAC address and logs the result. In the above
example, it is "00:0c:29:a5:9a:28".
Converting between Device Names and
the Real World
In the SCSI example above, the SCSI controller listed
is ahd0. The trick to understanding these log entries
better is to know how to interpret the device name
ahd0. First of all ahd0 means it is a device using the
ahd driver and it is the first one in the system (with
numbering starting from 0).
So what is a ahd? The first place to look is further up
in the log file. There should be an entry like:
kernel: ahd0: <Adaptec 39320 Ultra320 SCSI adapter> irq 11 at device 1.0 on pci2
This shows that the particular device is an Adaptec
39320 SCSI 3 controller. You can also find out more
about the the ahd driver (and all FreeBSD drivers) at:
/>i386.html
Search for ahd and you will find which controllers this
driver supports (in this case, they are all controllers
from Adaptec. If you click on the link provided, you will
be taken to a specific help page about this driver.
When FreeNAS moves to FreeBSD 7, then the
relevant web page will be:
/>Networking Problems
Having reliable networking with Network Attached
Storage is, of course, essential. This section is
aimed at those who are having networking problems.
In general, networking problems can be categorized
into two: Physical problems and software problems.
In the physical category are such problems as broken
cables and faulty hardware and in the software
category problems range from device driver
problems to network configuration errors.
On the surface, most network problems appear the
same, the network doesn't work, you can't connect.
To hunt down the problem there are different things
you can try.
General Connection Problems
Having booted your FreeNAS server, the first step is
to configure the networking. This is covered in detail
in chapter 2. Assuming you have configured the
networking, the next step is to connect to the
FreeNAS server using a web browser. If the web
browser connection fails, the web browser (Firefox in
this case) will show something like this:
There are two machines involved in this operation,
one is the FreeNAS server and the other is the
computer with the web browser. First, test that the
machine with the web browser is working normally.
Make sure it can access the Internet as well as other
machines or devices on your network. If it can't, you
need to start there!
If the web browser machine is working then the
problem could be with the FreeNAS server, it is time
to find the problem. Use this checklist to make sure
everything is as it should be:
Check that the cable is plugged into the
network card of the FreeNAS server. It
might sound simple, but I have had cases
where the cable didn't click in quite correct
and so the networking didn't work.
Assuming that the other end of the cable is
also plugged in correctly, check that the link
LED lights on the FreeNAS server and also
lights on the switch or hub where it is
connected. If you get green lights all round
then things are good.
Check that the network was recognized
during the boot up of FreeNAS server. As
you can't access the web interface you will
need to check this on the console. You are
looking for something like this:
What If My Network Card Isn't
Found?
This probably means that the network
card in your machine isn't supported by
FreeNAS or more specifically by
FreeBSD. Check the FreeBSD
hardware compatibility page for more
information:
/>i386.html
If the cabling is right and the network is
found, it is time to double check the network
settings. The most common mistake is in
setting the subnet mask. The subnet mask
determines which network a machine is on.
When you set the subnet mask using the
console menu system, if the subnet mask
isn't the same as the machine with the web
browser, then connectivity can be lost. Also,
incorrect subnet masks can cause odd
behavior, for example the machine with web
browser might be able to connect to the
FreeNAS server but the server may not be
able to reply. A typo of 25 (instead of the
desired 24) can cause connection
problems.
Is the IP address unique? If you have set a
static IP address, have you set the right
one? If two machines are assigned the
same IP address, strange things can
happen. With packets of data destined for
one machine arriving at the other and so on.
Ensure the IP address is correct and that it
is unique.
If you are using DHCP, ensure that the
DHCP server is up and running and it has
free addresses to issue. If you see that the
FreeNAS server has the address 0.0.0.0, it
means that it was unable to get an IP
address from the DHCP server.
Using Ping
Most operating systems (including Windows, Linux,
and OS X) have a tool called ping that allows you to
test the low level connectivity between two machines.
To test the connection to the FreeNAS machine, you
can ping it and also you can get the FreeNAS server
to ping other machines.
On Windows XP to run ping, click Run... and then
type cmd in the dialog box. Press Enter and a black
command prompt will appear. The command to ping
is simply ping followed by the IP address. So to ping
the FreeNAS server on its standard address of
192.168.1.250 you would type:
ping 192.168.1.250
If all is well, then the FreeNAS server will reply. The
output should look something like this:
If the PC can't contact the FreeNAS server then it will
report "Request timed out" errors.
You can also use the FreeNAS server to ping other
machines on the network. From the console choose
option 5. You will then be asked to enter an IP
address. The IP address this time won't be that of the
FreeNAS server, as this command is running from
the FreeNAS server, but rather of another machine on
the network. Enter the address and press enter. The
output should be something like this: