Báo cáo y học: "Efficiency of vibration exercise for glycemic control in type 2 diabetes patients."
Bạn đang xem bản rút gọn của tài liệu. Xem và tải ngay bản đầy đủ của tài liệu tại đây (660.59 KB, 5 trang )
Int. J. Med. Sci. 2007, 4
159
International Journal of Medical Sciences
ISSN 1449-1907 www.medsci.org 2007 4(3):159-163
© Ivyspring International Publisher. All rights reserved
Research Paper
Efficiency of vibration exercise for glycemic control in type 2 diabetes pa-
tients
Klaus Baum
1
, Tim Votteler
2
, Jürgen Schiab
2
1. Institut für Physiologie und Anatomie, Deutsche Sporthochschule Köln, Germany and Trainingsinstitut Prof. Dr. Baum
GmbH, Köln, Germany
2. Trainingsinstitut Prof. Dr. Baum GmbH, Köln, Germany
Correspondence to: Klaus Baum, Prof. Dr., Trainingsinstitut, Wilhelm-Schlombs-Allee 1, 50858 Köln, Germany. Telephone (0049) 221
28558550 Fax 285585525 E-mail
Received: 2007.02.28; Accepted: 2007.05.29; Published: 2007.05.31
Although it is well documented that persons suffering from diabetes type 2 profit from muscular activities, just a
negligible amount of patients take advantage of physical exercises. During the last decade, vibration exercise (VE)
could be established as an effective measure to prevent muscular atrophy and osteoporosis with low expenditure
of overall exercise-time. Unfortunately, little is known about the metabolic effects of VE. In the present study we
compared VE with the influence of strength training and a control group (flexibility training) on glycemic control
in type 2 diabetes patients. Forty adult non-insulin dependent patients participated in the intervention. Fasting
glucose concentration, an oral glucose tolerance test (OGTT), haemoglobin A1c (HbA1c), the isometric maximal
torque of quadriceps muscles, and endurance capacity were evaluated at baseline and after 12 weeks of training
with three training sessions per week. The main findings are: Fasting glucose concentrations remind unchanged
after training. The area under curve and maximal glucose concentration of OGTT were reduced in the vibration
and strength training group. HbA1c values tended to decrease below baseline date in the vibration training
group while it increased in the two other intervention groups. Theses findings suggest that vibration exercise
may be an effective and low time consuming tool to enhance glycemic control in type 2 diabetes patients.
Key words: diabetes, vibration exercise, strength training, HbA1c, glycemic control
1. Introduction
Since some decades it is known that beside
pharmacological treatments and body weight reduc-
tion endurance related exercises are able to enhance
glycemic control in type II diabetes patients [13,18,22].
More recently, strength training also became an estab-
lished treatment in that world-wide spreading meta-
bolic disease [2,3,4,9]. However, till today only a neg-
ligible amount of patients take advantage of any sport
activity. There are some reasons to explain that phe-
nomenon, one of the most important may be that
nearly all patients are obese and follow a lifelong
sedentary life style. Obviously, these patients can
hardly be motivated for longer lasting physical activi-
ties.
Vibration exercise is a new and effective measure
to prevent muscular atrophy and osteoporosis
[14,15,19,21]. It is assumed that vibrations with an
amplitude of 2 to 6 mm and a frequency of 20 to 30 Hz
evoke muscle contractions probably induced via the
monosynaptic stretch reflex [17]. Compared to tradi-
tional training regimes, VE needs significant less time
and, therefore, can be expected to reach a higher com-
pliance in previously inactive patients. Unfortunately,
rare information exists about the metabolic conse-
quences of VE. It is just known that oxygen consump-
tion increases with body weight as well as frequency
and amplitude of VE [14]. In the present study we in-
vestigated the influence of a three month vibra-
tion-exercise period on parameters of glucose metabo-
lism in type II diabetes patients. The results were
compared to a control group (FT-group) and a group
performing strength training (ST).
2. Research Design and Methods
Subjects characteristics and general experimental
design
Prior to recruitment of subjects the study protocol
was approved by the ethic committee of the German
Sports University. Volunteers were included if they
met three conditions: A diagnosed type II diabetes, not
insulin depending, and not regularly involved in sport
activities. All patients were under oral medication.
Subjects were excluded if they suffered from reti-
nopathy or other medical problems which did not al-
low for participating in vibration exercises or strength
training.
Patients were encouraged to follow their habitual
life style including medication throughout the whole
investigation period. After verbal introduction of the
study 40 subjects (24 male, 16 female) gave their writ-
ten consent and participated in the study (Table 1).
Subjects were randomly divided into three groups: A
flexibility training group, a strength training group
Int. J. Med. Sci. 2007, 4
160
and a vibration training group. They trained for 12
weeks at three days per week. All sessions were su-
pervised and participation assessed. Training volume
and intensity were stepwise increased after 6 and 9
weeks. The detailed training regimen was as follows:
Flexibility training
Each FT session consisted of eight static exercises
which involved main muscles of the upper and lower
body. During the initial six weeks, one set was per-
formed with the positions kept for 20 s each. From
week 7 to 9 volume was increased by one more set.
During the last three weeks two sets with exercise du-
rations of 30 s were applied. The total training duration
did not exceed 15 minutes per session.
Strength training
Commercially available weight machines
(Conex
©
multiform) were used for strengthening mus-
cle groups of the upper and lower body. Eight stations
were included in each session, e.g. leg extension,
seated leg flexion, leg press, seated calf raise, lat pulley,
horizontal chest press, butterfly, and rowing. Subjects
performed dynamic contractions with intermittent
relaxations after each concentric-eccentric phase in
order avoid critical blood pressure responses [1]. After
familiarization with the correct movements, the one
repetition maximum (1RM) was established prior to
the training period. During the first six weeks of
training, 1 set with 12 repetitions at 70 % of 1 RM was
performed. From week 7 to 9 volume was increased by
an additional set. In weeks 10 to 12, 3 sets with 10
repetitions at 80 % of 1 RM were realized. About 45
minutes was needed for a training session of the last
three weeks.
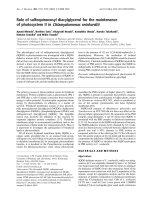
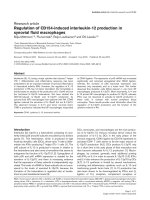
Vibration exercise
Subjects exercised on a horizontal swinging plat-
form with an amplitude of 2 mm (Vibrogym Profes-
sional
©
). Vibration frequency was set to 30 Hz from
weeks 1 to 9 and to 35 Hz during the last three weeks.
The duration of a single exercise bout was constant
throughout the training period and amounted to 30 s.
A training session consisted of 8 different exercises
including muscles of the whole body (Fig. 1). Subjects
were encouraged to work isometricaly against the
swinging platform.The number of sets was identical
with the strength training regimen. It took about 20
minutes to fulfill a training session of the last three
weeks.
Table 1: Baseline subjects characteristics. Mean ± SD
Intervention
group
(number of
subjects)
Age
(years)
Weight
(kp)
Height
(cm)
Systolic
blood
pressure
(mm
Hg)
Diastolic
blood
pressure
(mm Hg)
Stretching
(13)
63,3 ±
5,9
88,6 ±
24,1
173 ±
14,2
136 ±
13,8
83 ±
7,0
Strength (13) 62,9 ±
7,3
86,5 ±
14,7
172 ±
6,7
142 ±
16,2
87 ±
10,4
Vibration
(14)
62,2 ±
4,0
83,3 ±
13,4
177 ±
7,2
137 ±
15,1
79 ±
7,3
Figure 1: Images of the eight exercises during vibration train-
ing.
Test procedure and Outcome Measures
Before and three to four days after the training
period, subjects entered the laboratory after 12 h fast-
ing and an oral glucose tolerance test was performed.
Time of drug ingestion was individually kept constant
prior to both tests. Micro-blood samples were taken
from an ear lobe before and for 2,5 h every 30 min after
administering a 75 g glucose drink (Dextro
©
O.G-T.,
Roche Diagnostics Ltd). Blood samples were analyzed
by means of HemoCue
©
Glucose 201+ (HemoCue Ltd).
HbA
1C
levels were determined by a HPLC-System
(Tosoh G7, Eurogenics) from a blood sample taken
from the antecubital vein.
On separate days, maximal torque of quadriceps
muscles and endurance capacity were tested. Maximal
torque was detected isometrically with participants in
an upright sitting posture and the hip and knee joint
flexed to 90
o
. A force transducer (Digimax
©
, Mecha-
tronic Ltd) was used and the lever arm calculated as
the distance between knee joint space and contact
point of force transduction. The best of three trials of
each leg were taken for further computation.
Endurance capacity was determined by an in-
cremental cycle ergometry (Ergoline Ergoscript 2012
EL). Load was increased every 3 min for 25 w until
lactic acid concentration exceeded 4 mmol/l. Heart
rate (ECG leads) and lactic acid concentration (Accu-
trend
©
Lactate, Roche Mannheim) were measured at
rest and within the last 30 s of each load.
In addition, body weight and blood pressure
were measured before each training session. The mean
values of the initial and last five sessions were taken
for further computations.
Statistical analysis
Statistical analysis was conducted using SPSS
version 12.0 for Windows. If not otherwise stated data
are expressed as mean and standard deviation. The
data were analyzed by analysis of variance for re-
peated measurements (factors: time and training form).
In case that the two-factorial analysis yielded a sig-
nificant result (p < 0,05), a Newman-Keuls test was
performed as a posteriori test.
3. Results
Subjects characteristics
Body weight did not significantly change during
Int. J. Med. Sci. 2007, 4
161
the 3-month intervention. A mean reduction of 1,68 kp
± 4,57, 1,30 kp ± 2,36, and 0,86 kp ± 1,77 could be ob-
tained for FT, ST, and VT, respectively. Systolic blood
pressure decreased significantly (p < 0,05) in all inter-
vention groups to 126 mm Hg ± 7,4, 133 mm Hg ± 16,4,
and 123 mm Hg ± 12,5 for FT, ST, and VT, respectively.
Diastolic blood pressure did not change significantly.
Three subjects decreased their oral hypoglycemic
medication dosage (two persons in ST and one person
in VT group). No major complications or injuries were
reported from either stretching, strength, or vibration
training.
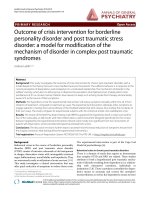
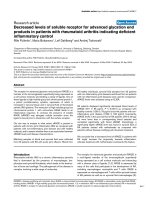
Endurance performance parameters
No significant differences in endurance capacity
could be detected between pre and post-training in
any group. Subjects reached 4 mmol [lactate] at loads
of 89 w ± 8,2 (pre) and 86 w ± 9,7 (post), 99 w ± 14,8
(pre) and 95 w ± 13,3 (post), 89 w ± 6,2 (pre) and 92 w ±
5,9 (post) for FT, ST, and VT, respectively. In contrast,
at these loads heart rate was reduced after the training
intervention in all groups (Fig. 2), which became sig-
nificant for VT.
Figure 2: Mean heart rates at loads corresponding to a lactic
acid concentration of 4 mmol / l. gray bars = pretraining, black
bars = posttraining. mean ± SE.
Strength
The relative maximal isometric torque of the
quadriceps muscles increased after training in the ST
and VT groups. A significant increase of 14 % could be
obtained in subject`s left leg of the ST group (Fig. 3).
Figure 3: Relative maximal isometric torques of the quadriceps muscles. black bars = pre-training, hollow bars = post-training.
mean ± SE.
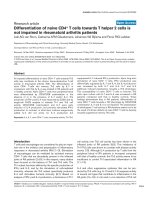
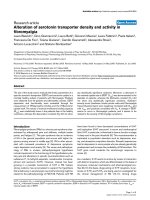
Figure 4: Glucose plasma-concentrations during OGTT before (black) and after the training period (hollow). Left top: Flexibility
training group, left bottom: strength training group, right top: vibration training group. Right bottom: mean of individual maximal
glucose concentrations. Mean ± SE.
Int. J. Med. Sci. 2007, 4
162
Fasting glucose concentration and OGTT
After training intervention, fasting glucose con-
centrations were slightly reduced in all groups (n.s.,
Tab. 2). Within the 150 minutes observation period of
OGTT, pre- and posttraining results in the FT group
were nearly identical. In both ST and VT the integrals
were reduced by 5,6 % and 6,3 %, respectively (p < 0,05
for both groups with no significant differences be-
tween both groups). Fig. 4 shows the time courses of
all three training groups as well as the mean of indi-
vidual maximal glucose concentrations.
Table 2: Plasma fasting glucose concentrations before and after
training intervention. Mean ± SD
Intervention
group
Plasma [glu-
cose]
pretraining
(mg / 100 ml)
Plasma [glu-
cose]
posttraining
(mg / 100 ml)
Significance
Flexibility 120 ± 25 115 ± 22 n.s.
Strength 126 ± 23 120 ± 22 n.s.
Vibration 133 ± 57 122 ± 35 n.s.
HbA1C
At baseline the HbA1c amounted to 6,7 % ± 0,26
(FT), 6,8 % ± 0,17 (ST), and 7,3 % ± 0,66 (VT) (Differ-
ences not significant). After training intervention a
small decrease in HbA1c occurred in the VT-group
(n.s.). In contrast, HbA1c values in the FT and ST
group were elevated.
Figure 5: Net changes in HbA1c. Mean ±SE
4. Discussion
Twelve weeks of strength training increased
muscular strength and did not affect the endurance
capacity while stretching and vibration exercise im-
proved neither strength nor endurance significantly.
These results on physical performance parameters
reflect just in part the outcome of glycemic control
parameters: As it could be expected flexibility training
failed to improve glycemic control and strength train-
ing showed beneficial effects. Although the duration of
VT training sessions were about half of thoses of the
strength group, the effect on OGGT was comparable.
Obviously, there is a beneficial effect of vibra-
tion-exercise on glycemic control without detectable
changes in physical performance parameters. A
dominant influence of body weight changes appears
unlikely since weight reduction was weakest in the VT
group and strongest in the FT group. Vibrations ap-
plied on skeletal muscles activate muscle spindle re-
ceptors [10] and so enlarge the drive to al-
pha-motoneurons via the monosynaptic reflex [17].
Therefore, compared to exercises without vibrations it
may be true that a higher number of motor units are
activated. Beside some general health-related benefi-
cial effects of exercise on skeletal muscles such as im-
provements of endothelial function [8] and an in-
creased enzyme capacity of energy metabolism [13]
there are two specific effects of contracting skeletal
muscle cells on the ability to transport glucose into
these cells: First, a regularly performed training in-
creases the content of the glucose transporter protein
GLUT-4 within the cells [9,12]. Secondly, a single bout
of muscle contractions leads to a translocation of
GLUT-4 to the sarcolemmal membrane, which acutely
enhances glucose transport capacity [6,7,11]. Evidence
of acute training effects on glycemic control rather then
a chronic adaptation to training originates from the
findings of Fenicchia et al. [5] and Ostergard et al. [13].
In the first study a single bout of resistance exercise
was sufficient to improve glycemic control. In the en-
durance-training intervention of Ostergaard et al. [13],
no correlation between changes in maximal oxygen
uptake and insulin sensitivity could be detected. The
authors discussed that improvements of insulin sensi-
tivity are dissociated from muscle mitochondrial func-
tion.
In spite of significantly reduced peak glucose
concentrations and area under curve during OGTT in
the post-training intervention, the 4 % reduction of
HbA1c levels obtained after VT intervention failed to
reach statistical significance. Moreover, in the control
group (flexibility training) and the strength training
group HbA1c increased by 5 % and 3 %, respectively.
This finding is clearly inconsistent with the outcome of
other strength-training related interventions [2,4,5]. It
is well known that HbA1c reflects glycemia over the
preceding two to three month [16]. The obviously
missing long-lasting beneficial effect on glycemic con-
trol in the present study may be in part due to the fact
that we initially used a training of low-volume load. In
contrast to other studies our subjects performed only
one set per session during the initial 6 weeks and three
sets were applied just for the last three weeks. This
slow increase in training load was utilized to enhance
subject's compliance to physical activity.
Beside a dose-dependent phenomenon an alter-
native explanation originates from the results of Tseng
et al. [20]. They reported a seasonal influence on
HbA1c with higher HbA1c values during winter. This
epidemiological study included more that 280.000 pa-
tients living in different climate conditions. Interest-
ingly, the strongest summer-winter contrast appeared
in the regions with an intermediate winter climate
(winter temperatures between 0
o
C to 4.4
o
C). That is
close to the conditions of our region. If the assumption
holds that seasonal influences provoked the HbA1c
increases in the FT and ST groups the 5 % HbA1c de-
Int. J. Med. Sci. 2007, 4
163
crease in the vibration-exercise group may become
even more meaningful.
The present paper shows, as a pilot study, that
vibration exercise may be an effective measure to im-
prove glycemic control in non insulin dependent dia-
betes type 2 patients. Further studies should be en-
couraged to optimize frequency, amplitude, and dura-
tion of vibration exercises.
Since the time to treat is far beyond traditional
training forms, patients without any affinity to tradi-
tional sports activities may prefer vibration training as
a part of an intended lifestyle modification.
Acknowledgments
This work was funded by a grant of International
Biotechnological Future Knowledge GmbH, Krefeld,
Germany. We are grateful to Dr. Hiemer for excellent
cooperation, Susanne Schuster for her practical assis-
tance during training sessions, the kind cooperation of
the study participants, Vibrogym Ltd and Roche Di-
agnostics Ltd for the supply of equipments.
Conflict of interest
The authors have declared that no conflict of in-
terest exists.
References
1. Baum K, Rüther T, Essfeld D. Reduction of blood pressure
response during strength training through intermittent muscle
relaxations. Int J Sports Med. 2003; 24: 441- 4
2. Brooks N, Layne JE, Gordon PL, et al. Strength training im-
proves muscle quality and insulin sensitivity in Hispanic older
adults with type 2 diabetes. Int J Med Sci. 2007; 4: 19 - 27
3. Cauza E, Hanusch-Enserer U, Strasser B, et al. The relative
benefits of endurance and strength training on metabolic fac-
tors and muscle function of people with type 2 diabetes melli-
tus. Arch Phys Med Rehabil. 2005; 86: 1527 – 33
4. Dunstan DW, Daly RM, Owen N, et al. High-intensity resis-
tance training improves glycemic control in older patients with
type 2 diabetes. Diabetes care. 2002; 25: 1729 – 36
5. Fenicchia LM, Kanaley JA, Azevedo JL, et al. Influence of re-
sistance training on glucose control in women with type 2 dia-
betes. Metabolism. 2004; 53: 284 - 9
6. Gao J, Ren J, Gulve EA, Holloszy JO. Additive effect of con-
tractions and insuline on GLUT-4 translocation into the sar-
colemma. J Appl Physiol, 1994; 77: 1587 - 1601
7. Goodyear LJ, Hirshman MF, Horton ES. Exercise-induced
translocation of skeletal muscle glucose transporters. Am J
Physiol Endocrinol Metab. 1991; 261: E795 – 9
8. Green DJ, Maiorana AJ, Tschakovsky ME, et al. Relationship
between changes in brachial artery flow-mediated dilation and
basal release of nitric oxide in subjects with Type 2 diabetes.
Am J Physiol Heart Circ Physiol. 2006; 291:H1193 – 9
9. Holten MK, Zacho M, Gaster M, et al. Strength training in-
creases insulin-mediated glucose uptake, GLUT-4 content, and
insulin signaling in skeletal muscle in patients with type 2
diabetes. Diabetes. 2004; 53:294 - 305
10. Kasai T, Kawanishi M, Yahagi S. The effects of wrist muscle
vibration on human voluntary elbow flexion-extension move-
ments. Exp Brain Res. 1992; 90: 217 - 20
11. Kennedy JW, Hirshman MF, Gervino EV, et al. Acute exercises
induces GLUT4 translocation in skeletal muscle of normal hu-
man subjects with type 2 diabetes. Diabetes. 1999; 48: 1192 - 7
12. Kim HJ, Lee JS, Kim CK. Effect of exercise training on muscle
glucose transporter 4 protein and intramuscular lipid content in
elderly men with impaired glucose tolerance. Eur J Appl
Physiol. 2004; 93: 353 - 8
13. Ostergard T, Andersen JL, Nyholm B, et al. Impact of exercise
training on insulin sensitivity, physical fitness, and muscle
oxidative capacity in first-degree relatives of type 2 diabetic
patients. Am J Physiol Endocrinol Metab. 2006; 290: E998 - 1005
14. Rittweger J, Ehrig J, Just K, et al. Oxygen Uptake in
Whole-Body Vibration Exercise: Influence of Vibration Fre-
quency, Amplitude, and External Load. Int J Sports Med. 2002;
23: 428 – 32
15. Roelants M, Delecluse C, Verschueren SM. Whole body vibra-
tion training increases knee-extension strength and speed of
movement in older women. JAGS. 2004; 52: 901 – 8
16. Rohlfing CL, Wiedmeyer HM, Little RR, et al. Defining the
relationship between plasma glucose and HbA1c: analysis of
glucose profiles and HbA1c in the Diabetes Control and Com-
plications Trial. Diabetes Care. 2002; 25: 275 - 8
17. Rotmuller C, Cafarelli E. Effects of vibration on antagonist
muscle coactivation during progressive fatigue in humans. J
Physiol (London). 1995; 485: 857 - 64
18. Segal KR, Edano A, Abalos A. Effects of exercise training on
insuline sensitività and glucose met
abolism in lean, obese, and
diabetic men. J Appl Physiol. 1991; 71: 2402 - 11
19. Torvinen S, Sievänen H, Järvinen TAH, et al. Effect of a 4-min
Vertical Whole Body Vibration on Mucle Performance and
Body Balance. Int Sports Med. 2002; 23: 374 - 9
20. Tseng CL, Brimacombe M, Xie M, et al. Seasonal patterns in
monthly haemoglobin A1c values. Am J Epidemiol. 2005; 161:
565 - 74
21. Verschueren S, Roelants M, Delecluse C, et al. Effect of 6-month
whole body vibration training on hip density, muscle strength,
and postural control in postmenopausal women: a randomized
controlled pilot study. J Bone Miner Res. 2004; 19: 352 – 9
22. Young JC. Exercise prescription for individuals with metabolic
disorders. Practical considerations. Sports Med. 1995; 19: 43 - 54