Báo cáo y học: " Effect of dose-escalation of 5-fluorouracil on circadian variability of it"
Bạn đang xem bản rút gọn của tài liệu. Xem và tải ngay bản đầy đủ của tài liệu tại đây (343.05 KB, 7 trang )
Int. J. Med. Sci. 2010, 7
48
I
I
n
n
t
t
e
e
r
r
n
n
a
a
t
t
i
i
o
o
n
n
a
a
l
l
J
J
o
o
u
u
r
r
n
n
a
a
l
l
o
o
f
f
M
M
e
e
d
d
i
i
c
c
a
a
l
l
S
S
c
c
i
i
e
e
n
n
c
c
e
e
s
s
2010; 7(1):48-54
© Ivyspring International Publisher. All rights reserved
Research Paper
Effect of dose-escalation of 5-fluorouracil on circadian variability of its
pharmacokinetics in Japanese patients with Stage III/IVa esophageal
squamous cell carcinoma
Akiko Kuwahara
1
, Motohiro Yamamori
2
, Kohshi Nishiguchi
3,4
, Tatsuya Okuno
3
, Naoko Chayahara
3
, Ikuya
Miki
3
, Takao Tamura
3
, Kaori Kadoyama
2
, Tsubasa Inokuma
2
, Yoshiji Takemoto
2
, Tsutomu Nakamura
3
,
Kazusaburo Kataoka
1
and Toshiyuki Sakaeda
2,3
1. School of Pharmacy and Pharmaceutical Sciences, Mukogawa Women’s University, Nishinomiya 663-8179, Japan
2. Graduate School of Pharmaceutical Sciences, Kyoto University, Kyoto 606-8501, Japan
3. Kobe University Graduate School of Medicine, Kobe 650-0017, Japan
4. Faculty of Pharmaceutical Sciences, Kyoto Pharmaceutical University, Kyoto 607-8414, Japan
Corresponding author: Toshiyuki Sakaeda, Ph.D., Center for Integrative Education of Pharmacy Frontier (Frontier Edu-
cation Center), Graduate School of Pharmaceutical Sciences, Kyoto University 46-29 Yoshidashimoadachi-cho, Sakyo-ku,
Kyoto 606-8501, Japan. Tel: +81-75-753-9560, Fax: +81-75-753-4502, E-Mail:
Received: 2009.10.14; Accepted: 2010.01.28; Published: 2010.01.31
Abstract
Objective: The effects of dose-escalation of 5-fluorouracil (5-FU) on the clinical outcome
and pharmacokinetics of 5-FU were investigated in Japanese patients with Stage III/IVa eso-
phageal squamous cell carcinoma.
Methods: Thirty-five patients with Stage III/IVa were enrolled, who were treated with a
definitive 5-FU/cisplatin-based chemoradiotherapy. A course consisted of continuous infu-
sion of 5-FU at 400 mg/m
2
/day (the standard dose group, N=27) or 500-550 mg/m
2
/day (the
high dose group, N=8) for days 1-5 and 8-12, infusion of cisplatin at 40 mg/m
2
/day on days 1
and 8, and radiation at 2 Gy/day on days 1 to 5, 8 to 12, and 15 to 19, with a second course
repeated after a 2-week interval. Plasma concentrations of 5-FU were determined by high
performance liquid chromatography at 5:00 PM on days 3, 10, 38 and 45, and at 5:00 AM on
days 4, 11, 39 and 46.
Results and conclusions: No patient with Stage IVa achieved a complete response in the
standard dose group, whereas a complete response was observed at a rate of 50% in the
high dose group, and this can be explained by a higher plasma concentration of 5-FU. The
circadian rhythm in the concentrations found at the standard dose was not observed for a
higher dose.
Key words: esophageal squamous cell carcinoma, 5-fluorouracil, plasma concentration, circadian
rhythm, dose-escalation
Introduction
A clinical report published in 1999, the RTOG
(Radiation Therapy Oncology Group) 85-01 trial in-
volving 134 patients with T1-3, N0-1 and M0 eso-
phageal cancer, is of great interest in terms of clinical
outcome because it demonstrated a 5-year survival
rate of 26 % [1-4]. This treatment consists of a
96-hr-infusion of 5-fluorouracil (5-FU) at a daily dose
of 1,000 mg/m
2
/day in weeks 1, 5, 8 and 11, infusion
of cisplatin (CDDP) at 75 mg/m
2
/day on the first day
of week 1, 5, 8 and 11, and concurrent radiation at 50
Int. J. Med. Sci. 2010, 7
49
Gy in 25 fractions over 5 weeks, without pre- or
post-surgical resection. The total dose of 5-FU and
CDDP was 16,000 mg/m
2
and 300 mg/m
2
, respec-
tively.
Simultaneously in Japan, a dose-reduction ver-
sion was proposed by Ohtsu and his co-workers for
advanced metastatic esophageal squamous cell car-
cinoma (ESCC) which consists of a 120-hr-infusion of
5-FU at 400 mg/m
2
/day in weeks 1, 2, 6 and 7, infu-
sion of CDDP at 40 mg/m
2
/day on the first day of
week 1, 2, 6 and 7, and concurrent radiation at 60 Gy
in 30 fractions over 8 weeks [5,6]. The total dose of
5-FU and CDDP was 8,000 mg/m
2
and 160 mg/m
2
,
respectively, being about half of those in the RTOG
85-01. Two independent clinical investigations have
shown curative potential using this regimen for un-
resectable ESCC with T4 or M1a [5,6]. A long-term
evaluation of efficacy and toxicity with 139 patients
resulted in a complete response (CR) rate of 56%,
along with a 5-year survival rate of 29 % [7-9]. Cur-
rently, a definitive 5-FU/CDDP-based chemoradio-
therapy (CRT) is recognized as one of the most
promising treatments for esophageal cancer [10], and
future improvements will likely require the modifica-
tion of the RTOG 85-01 regimen or Ohtsu’s regimen,
and incorporation of a novel anticancer drug.
A series of studies has been performed to find a
marker predictive of clinical outcome after treatment
with the Ohtsu’s regimen [11-13].
A total of 8 meas-
urements of the plasma concentration of 5-FU were
made per patient, and it was concluded that the av-
erage value was predictive of clinical response, but
not of severe acute leucopenia, stomatitis and cheilitis
[13]. The average concentration in the patients with
CR was 0.122±0.035 μg/mL, and was significantly
higher than that in non-CR patients, 0.102±0.023
μg/mL (p = 0.029) [13]. A CR was not observed in 7
patients with Stage IVa, but the concentration tended
to be lower in such patients, 0.102±0.028 μg/mL [13],
suggesting that the dose- escalation of 5-FU results in
a CR even in the patients with Stage IVa.
Although little information is available for
dose-escalation of 5-FU, CDDP or radiation in ad-
vanced esophageal cancer, Yamashita et al. have ap-
plied the RTOG 85-01 protocol [14-17], and two Phase
II trials, referred to as JCOG (Japan Clinical Oncology
Group Trial) 9516 and 9407, have been performed for
advanced ESCC in Japan [18,19]. In this study, based
on the Ohtsu’s regimen, a dose-escalation of 5-FU
from 400 mg/m
2
/day to 500-550 mg/m
2
/day was
applied to ESCC patients with Stage III/IVa, and the
preliminary results are summarized with regard to
clinical outcome and plasma concentrations of 5-FU.
Patients and Methods
Patients
Thirty-five ESCC patients were enrolled in this
study, 27 of whom were treated with 400 mg/m
2
/day
of 5-FU (the standard dose group), and the remaining
8 of whom were treated at 500-550 mg/m
2
/day (the
high dose group). The patients were recruited based
on the following criteria: 1) ESCC treated at Kobe
University Hospital from August 2002 to June 2006;
2) Stage III (T3/T4, N1, M0) or IVa (T1-T4, N0/N1,
M1a) according to the International Union Against
Cancer tumor node metastasis (TNM) classification;
3) age less than 85 years; 4) an Eastern Cooperative
Oncology Group performance status of 0 to 2; 5)
adequate bone marrow, renal, and hepatic function;
6) no prior chemotherapy; 7) no severe medical com-
plications; and 8) no other active malignancies (except
early cancer). The tumors were histologically con-
firmed to be primary.
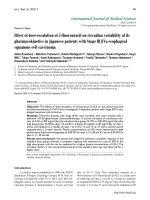
Protocol
The protocol is presented in Figure 1. A course
consisted of continuous infusion of 5-FU at 400 or
500-550 mg/m
2
/day for days 1-5 and 8-12, infusion of
CDDP at 40 mg/m
2
/day on days 1 and 8, and radia-
tion at 2 Gy/day on days 1 to 5, 8 to 12, and 15 to 19,
with a second course repeated after a 2-week interval
[5,6]. If disease progression/recurrence was ob-
served, either salvage surgery, endoscopic treatment,
or another regimen of chemotherapy was scheduled.
This study was conducted with the authorization of
the institutional review board and followed the
medical research council guidelines of Kobe Univer-
sity.
Determination of Plasma Concentration of 5-FU
Aliquots (5 mL) of blood were collected into
etylenediaminetetraacetic acid-treated tubes at 5:00
PM on days 3, 10, 38 and 45, and at 5:00 AM on days
4, 11, 39 and 46 [11-13]. The plasma concentrations of
5-FU were determined by high-performance liquid
chromatography as described previously [11-13].
Clinical Response
The clinical response was evaluated according to
the method reported previously [5-9]. Briefly, a CR
was defined as the complete disappearance of all
measurable and assessable disease at the first evalua-
tion, which was performed 1 month after the comple-
tion of CRT to determine whether the disease had
progressed. The clinical response was evaluated by
endoscopy and chest and abdominal computed to-
mography (CT) scans in each course. A CR at the
primary site was evaluated by endoscopic examina-
Int. J. Med. Sci. 2010, 7
50
tion when all of the following criteria were satisfied
on observation of the entire esophagus: 1) disap-
pearance of the tumor lesion; 2) disappearance of ul-
ceration (slough); and 3) absence of cancer cells in
biopsy specimens. If small nodes of 1 cm or less were
detected on CT scans, the recovery was defined as an
“uncertain CR” after confirmation of no progression
for at least 3 months. An “uncertain CR” was in-
cluded as a CR when calculating the CR rate. When
these criteria were not satisfied, a non-CR was as-
signed. The existence of erosion, a granular pro-
truded lesion, an ulcer scar, and 1.2 w/v% io-
dine/glycerin-voiding lesions did not prevent an
evaluation of CR. The evaluations were performed
every month for the first 3 months, and when the cri-
teria for CR were not satisfied at 3 months, the result
was changed to non-CR. Follow-up evaluations were
performed thereafter every 3 months for 3 years by
endoscopy and CT scan. After 3 years, patients were
seen every 6 months. During the follow-up period, a
routine course of physical examinations and clinical
laboratory tests was performed to check the patient’s
health.
Severe Acute Toxicities
A definitive 5-FU/CDDP-based CRT is associ-
ated with acute toxicities; leucopenia, anemia,
thrombocytopenia, nausea/vomiting, diarrhea, mu-
cositis (including stomatitis), esophagitis, and renal
dysfunction [5-9, 20]. Here, severe acute leucopenia,
stomatitis, and cheilitis were subjected into the analy-
sis. Toxicity was evaluated using criteria defined by
the Japan Clinical Oncology Group [21].
These criteria
were based on the National Cancer Institute Common
Toxicity Criteria. Toxicity was assessed on a 2 to 3
day basis during the CRT and subsequent hospitali-
zation period and on every visit after the completion
of CRT. Episodes of leucopenia, stomatitis, and
cheilitis during the first 2 courses and subsequent 2
weeks (until day 70) were recorded as acute toxicities
and those of grade 3 or more as severe acute toxici-
ties.
Data Analysis and Statistics
All values reported are the mean±standard de-
viation (SD). Circadian variations of plasma concen-
trations of 5-FU were analyzed with the Wilcoxon
signed-rank test. The unpaired Student’s
t-test/Welch’s test or Mann-Whitney’s U test was
used for two-group comparisons of the concentra-
tions. Fisher’s exact test was used for the analysis of
contingency tables. P values of less than 0.05 (two
tailed) were considered to be significant.
Figure 1. Protocol of a definitive 5-fluorouracil (5-FU)/ cisplatin (CDDP)-based chemoradiotherapy. One course of
treatment consisted of protracted venous infusions of 5-FU (400 or 500-550 mg/m
2
/day for days 1-5 and 8-12) and CDDP
(40 mg/m
2
/day on days 1 and 8), and radiation (2 Gy/day on days 1-5, 8-12, and 15-19), with a second course (days 36-56)
repeated after a 2-week interval.
Int. J. Med. Sci. 2010, 7
51
Results
Demographic and clinicopathologic characteris-
tics of the 35 Japanese ESCC patients are summarized
in Table 1. There was no difference between the
standard dose group and high dose group, concern-
ing age, height, weight, sex, performance status, dif-
ferentiation, TNM score and clinical stage. Table 2
shows the results of clinical outcome. The overall CR
rate was 22.2 % and 37.5 % for the standard dose
group and high dose group, respectively. In the
standard dose group, all 6 CR patients were at Stage
III, and none of Stage IVa patients had a CR. In con-
trast, 2 of 4 Stage IVa patients had a CR in the high
dose group. Severe acute leucopenia, stomatitis or
cheilitis were found at a rate of 37.0%, 14.8% and
18.5%, respectively, and nausea/vomiting and diar-
rhea were found in a few patients (ca. 10%). There
was no significant increase in the rate of severe acute
toxicities, according to the increase in the dose of
5-FU.
The values of the plasma concentrations of 5-FU
are listed in Table 3. The average of 8 measurements
made per patient is listed as the data. The plasma
concentrations of 5-FU in the high dose group,
0.137±0.031 μg/mL, were higher than those in the
standard dose group, 0.112±0.030 μg/mL, but with
no statistical significance (p = 0.052), presumably due
to great differences between individuals. In Stage IVa,
the plasma concentrations of 5-FU in the high dose
group, 0.144±0.029 μg/mL, were significantly higher
than those in the standard dose group, 0.101±0.027
μg/mL (p = 0.028), and tended to be still higher after
the dose-normalization (0.116±0.012 μg/mL). The
plasma concentration of 5-FU was 0.131 μg/mL and
0.182 μg/mL in 2 Stage IVa patients with a CR.
The circadian variation in the plasma concentra-
tion of 5-FU is shown in Figure 2 and the differences
between the two groups are summarized in Table 4.
In the standard dose group, the plasma concentra-
tions of 5-FU at 5:00 AM (0.069±0.031 μg/mL) were
significantly lower than those at 5:00 PM (0.109±0.059
μg/mL) in the 1st cycle/1st course (P < 0.05, β =
0.882) and a similar tendency was observed in the
2nd cycle/1st course (P = 0.438, β = 0.179), not sig-
nificantly. The plasma concentrations of 5-FU at 5:00
PM and 5:00 AM in the second cycle were both sig-
nificantly higher than those in the first cycle, and
these phenomena found in the first course were also
observed in the second course. As for the high dose
group, the plasma concentrations of 5-FU at 5:00 AM
(0.073±0.049 μg/mL) were significantly lower than at
5:00 PM (0.119±0.043 μg/mL) in the 1st cycle/1st
course (P < 0.05, β = 0.902), but those at 5:00 AM were
higher than those at 5:00 PM in the 2nd cycle/1st
course (not significantly). The plasma concentrations
of 5-FU at 5:00 PM and 5:00 AM in the second cycle
were both higher than those in the first cycle. In the
second course, the circadian variation found in the
first course was not observed. As shown in Table 4,
the concentrations in the high dose group were
higher than those in the standard dose group, but the
increase was relatively remarkable at 5:00 AM than
5:00 PM.
Table 1. Demographic and Clinicopathologic Characteris-
tics of 35 Japanese Patients with Esophageal Squamous Cell
Carcinoma
Group Standard
dose
a)
High
dose
p
d)
N 27 8
Age, yr 63.0±7.8
(48 -75)
b)
62.5±5.0
(56 -71)
0.865
Height, cm 162.9±7.1
(150-180)
164.2±4.6
(159-172)
0.633
Weight, kg 55.2±9.3
(33-79)
55.3±7.6
(46-72)
0.919
Male/Female 24/3 8/0 1.000
Performance status,
0/1/2/unknown
11/13/2/1 4/4/0/0 1.000
Differentiation,
well/moderate/poor/unknown
3/13/6/5 1/1/3/3 0.266
T1/T2/T3/T4 1/1/13/12 0/0/6/2 0.655
N0/N1 3/24 1/7 1.000
M0/M1a
c)
19/8 4/4 0.402
Stage III/IVa 19/8 4/4 0.402
a) Standard dose group: 400 mg/m
2
/day of 5-fluorouracil; High
dose group: 500-550 mg/m
2
/day of 5-fluorouracil.
b) The values are the mean±SD, with the range in parentheses.
c) Noncervical primary tumors with positive supraclavicular lymph
nodes were defined as M1a.
d) Standard dose group vs. high dose group (see the section
“PATIENTS AND METHODS”).
Table 2. Clinical Outcome in 35 Japanese Patients with
Esophageal Squamous Cell Carcinoma
Group Standard
dose
a)
High
dose
p
c)
N 27 8
Clinical Response
Complete response (CR) rate
b)
6 (22.2 %) 3 (37.5 %) 0.396
Severe Acute Toxicity (Grade 3/4)
Leucopenia 10 (37.0 %) 4 (50.0 %) 0.685
Stomatitis 4 (14.8 %) 1 (12.5 %) 1.000
Cheilitis 5 (18.5 %) 2 (25.0 %) 0.648
a) Standard dose group: 400 mg/m
2
/day of 5-fluorouracil; High
dose group: 500-550 mg/m
2
/day of 5-fluorouracil.
b) Two of 4 patients with Stage IVa had a CR in the high dose
group, but no patient in the standard dose group.
c) Standard dose group vs. high dose group (Fisher’s exact test).
Int. J. Med. Sci. 2010, 7
52
Table 3. Association of Disease Stage with Plasma Con-
centrations (μg/mL) of 5-Fluorouracil in the Standard dose
and High dose groups.
Group Standard dose
a)
High dose p
c)
Stage III 19 0.117±0.031
b)
4 0.131±0.036 0.454
Stage IVa 8 0.101±0.027 4 0.144±0.029 0.028
Stage III/ IVa 27 0.112±0.030 8 0.137±0.031 0.052
a) Standard dose group: 400 mg/m
2
/day of 5-fluorouracil; High
dose group: 500-550 mg/m
2
/day of 5-fluorouracil.
b) The values are the mean±SD. The average of 8 measurements
made per patient is listed as the data.
c) Standard dose group vs. high dose group (see the section
“PATIENTS AND METHODS”).
Table 4. Plasma Concentrations (μg/mL) of 5-Fluorouracil
in the Standard dose and High dose groups.
Group Standard dose
a)
High dose p
c)
N 27 8
1st cycle / 1st course
Day3 5:00 PM 0.109±0.059
b)
0.119±0.043 0.665
Day4 5:00 AM 0.069±0.031 0.073±0.049 0.758
2nd cycle / 1st course
Day10 5:00 PM 0.143±0.053 0.157±0.050 0.515
Day11 5:00 AM 0.132±0.048 0.170±0.057 0.084
1st cycle / 2nd course
Day38 5:00 PM 0.112±0.047 0.134±0.081 0.412
Day39 5:00 AM 0.073±0.042 0.136±0.058 0.004
2nd cycle / 2nd course
Day45 5:00 PM 0.148±0.090 0.158±0.074 0.509
Day46 5:00 AM 0.115±0.038 0.172±0.090 0.151
a) Standard dose group: 400 mg/m
2
/day of 5-fluorouracil; High
dose group: 500-550 mg/m
2
/day of 5-fluorouracil.
b) The values are the mean±SD.
c) Standard dose group vs. high dose group (see the section
“PATIENTS AND METHODS”).
Figure 2. Circadian variation of plasma concentrations of 5-fluorouracil (5-FU) in patients with advanced esophageal cancer.
A total of 8 measurements were made per patient: 5:00 PM on days 3, 10, 38 and 45, and 5:00 AM on days 4, 11, 39 and 46.
Closed circle: the standard dose group (N=27), open circle: the high dose group (N=8). The bars represent the SD. * P <
0.05 in the standard dose group, ** P < 0.05 in the high dose group.
Discussion
Esophageal cancer is the 8th most common can-
cer in the world
and one of the most lethal [10].
Symptoms include dysphagia, odynophagia, and
progressive weight loss. The two predominant histo-
logical subtypes are adenocarcinoma and squamous
cell carcinoma, and treatment depends on the loca-
tion of the primary tumor, the disease stage, patient
characteristics and co-morbidities, and occasionally,


![Báo cáo Y học: Effect of adenosine 5¢-[b,c-imido]triphosphate on myosin head domain movements Saturation transfer EPR measurements without low-power phase setting ppt](https://media.store123doc.com/images/document/14/rc/vd/medium_vdd1395606111.jpg)