Báo cáo y học: " Factors affecting the long-term response to tacrolimus in renal transplant patients: Pharmacokinetic and pharmacogenetic approac"
Bạn đang xem bản rút gọn của tài liệu. Xem và tải ngay bản đầy đủ của tài liệu tại đây (818.48 KB, 7 trang )
Int. J. Med. Sci. 2010, 7
94
I
I
n
n
t
t
e
e
r
r
n
n
a
a
t
t
i
i
o
o
n
n
a
a
l
l
J
J
o
o
u
u
r
r
n
n
a
a
l
l
o
o
f
f
M
M
e
e
d
d
i
i
c
c
a
a
l
l
S
S
c
c
i
i
e
e
n
n
c
c
e
e
s
s
2010; 7(2):94-100
© Ivyspring International Publisher. All rights reserved
Research Paper
Factors affecting the long-term response to tacrolimus in renal transplant
patients: Pharmacokinetic and pharmacogenetic approach
Paraskevi F. Katsakiori
1
, Eirini P. Papapetrou
2
, George C. Sakellaropoulos
3
, Dimitrios S. Goumenos
4
,
George C. Nikiforidis
3
, Christodoulos S. Flordellis
1
1. Department of Pharmacology, School of Medicine, University of Patras, Rion, Greece
2. Center for Cell Engineering, Molecular Pharmacology and Chemistry Program, Memorial Sloan-Kettering Cancer Center
(MSKCC), New York, NY 10065, USA
3. Department of Medical Physics, School of Medicine, University of Patras, Rion, Greece
4. Department of Internal Medicine-Nephrology, School of Medicine, University of Patras, Rion, Greece
Corresponding author: Paraskevi F. Katsakiori, Department of Pharmacology, School of Medicine, University of Patras,
26500 Rion, Greece, Tel: +30 6937 438208, Email: ;
Received: 2010.04.20; Accepted: 2010.05.10; Published: 2010.05.11
Abstract
Background: The aim of our study was to determine the impact of CYP3A5*1 and
CYP3A5*3 on the kinetics of tacrolimus in renal transplant recipients.
Material and methods: Forty kidney recipients were selected to participate. Maintenance
scheme consisted of tacrolimus, a purine inhibitor and a steroid. CYP3A5 genotyping was
performed with PCR and RFLP. Pharmacokinetic model was developed with Linear Regres-
sion and General Linear Model repeated measures approach. The impact of sex, CYP3A5*1
allele, age at transplantation, hepatic and renal function on tacrolimus kinetics was examined.
Results: The frequency of CYP3A5*3/*3 and CYP3A5*1/*3 genotype was 35/40 and 5/40,
respectively. No CYP3A5*1/*1 was detected. CYP3A5*1 variant was associated with signif-
icant lower TAC dose adjusted concentration at 3, 6, 12 and 36 months after transplantation.
Hepatic and renal function showed a significant effect on tacrolimus dose adjusted concen-
tration 3 months after transplantation (p=0.000 and 0.028, respectively). Sex did not show a
significant impact on tacrolimus kinetics. Carriers of CYP3A5*1 allele had lower predicted
measures for tacrolimus dose adjusted concentration and higher predicted measures for
volume of distribution.
Conclusion: We proved that CYP3A5*1 carriers need higher tacrolimus dose than
CYP3A5*3 homozygotes to achieve the target blood concentration.
Key words: CYP3A5, general linear models, linear regression, tacrolimus, renal transplantation
Background
Tacrolimus, a calcineurin inhibitor, remains the
centerpiece of the maintenance treatment scheme in
renal transplant recipients. Both its narrow therapeu-
tic index and its highly pharmacokinetic variance may
lead to overtreatment and toxicity or insufficient
treatment and transplant rejection, conditions that are
usually seen in clinical practice. Thus, it is obvious
that the optimal tacrolimus dose has to be achieved
soon after transplantation and must be preserved
thereafter.
In the recent years, effort has been made to de-
termine the potential causes of inter- and in-
tra-individual variability. Except for the characteris-
tics of each individual and several environmental
Int. J. Med. Sci. 2010, 7
95
factors, the role of biological factors affecting the drug
absorption, distribution, metabolism or deletion has
been investigated [1-9]. Till now, the most significant
biological factors known to affect pharmacokinetics
are the drug transporters and the metabolizing en-
zymes [7,9].
CYP3A, the primary subfamily of the cytoch-
rome P450 (CYP) enzymatic system, is responsible for
the metabolism of tacrolimus [10]. Specifically; tacro-
limus is mainly metabolized by CYP3A4 and CYP3A5
enzyme isotype. CYP3A5 polymorphisms seem to
affect tacrolimus kinetics at a greater degree com-
pared to CYP3A4 ones and thereby, these polymor-
phisms are thought to be the best candidates for
pharmacogenetics’ application in immunosuppresion
[1,7,11-13]. CYP3A5 gene is expressed in a limited
number of individuals. When it is expressed, it may
count for the 50% of the total hepatic CYP3A protein
[5,14].
Macphee et al were the first to detect the effect of
a CYP3A5 polymorphism in the distribution of tacro-
limus [11]. CYP3A5*3 (G6986A) polymorphism, lo-
cated in intron 3, has been recognized as the most
important CYP3A5 polymorphism. The alleles A and
G are CYP3A5*1 and CYP3A5*3, respectively. Indi-
viduals carrying at least one CYP3A5*1 allele express
CYP3A5 protein whereas individuals homozygotes
for CYP3A5*3 are non-expressors [15-18].
There are grave indications that pharmacoge-
netic testing for CYP3A5 prior to transplantation im-
proves the individualization of immunosuppressive
therapy although epigenetic factors must be taken
into account [7]. The aim of the present study was to
determine the impact of CYP3A5*1 and CYP3A5*3
genotype on the kinetics of tacrolimus in renal trans-
plant recipients. The drug dose and level, the drug
dose-adjusted level and the drug volume of distribu-
tion values are analyzed based on the presence of
CYP3A5*1 allele, sex, age, renal and hepatic function.
Material and Methods
Patient population
Forty renal transplant recipients (median age: 41
years, range: 13-69), who attended the Outpatient
Clinic of Nephrology and treated with TAC as the
primary immunosuppressant, were selected to par-
ticipate in the study. The protocol was approved by
the Institution Ethics Committee of our hospital and
informed consent was obtained from all subjects.
Maintenance treatment scheme consisted of a
combination of a calcineurin inhibitor (tacrolimus)
with a purine inhibitor (mycophenolate mofetil or
azathioprine) and a steroid (prednizolone). Tacroli-
mus was given twice a day in individually adjusted
doses and its trough levels were measured 12 hours
post dose.
Identification of CYP3A5 genotype
Five milliliter blood samples were drawn from
each patient in a vacutainer tube containing ethy-
lene-diaminetetracetic acid. Genomic DNA was ex-
tracted from 200μl whole blood by QIAamp DNA
Blood kit (Qiagen GmbH, Hilden) and was analyzed
on a 0.8% agarose/Tris-borate EDTA gel with ethi-
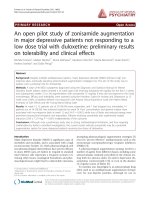
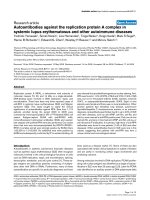
dium bromide staining (Figure 1).
Figure 1. a. Genomic DNA. Lane M, base pair marker (λDNA 5μgr); lanes 1-9 genomic DNA from 9 blood samples.
Analysis on a 0.8% agarose/Tris-borate EDTA gel. b. PCR for CYP3A5. Lane M, base pair marker (λDNA 5μgr); lanes 1-3
PCR product for CYP3A5 from 3 DNA samples. Analysis on a 2% agarose/Tris-borate EDTA gel. Figure is printed negative.
c. RFLP for CYP3A5. Lane M, base pair marker (250-bp DNA ladder); lanes 1-10 SspI-digested PCR products from 10 PCR
products. CYP3A5*1/*1 genotype gives 148-, 125- and 20- bp bands (lanes 1, 2, 3, 6, 7 and 9) and CYP3A5*1/*3 genotype
gives 168-, 148-, 125- and 20- bp (lanes 4, 5, 8 and 10). CYP3A5*3/*3 genotype is not seen in this picture. The 20- bp band
is not visible. Analysis on a 3.5% agarose/Tris-borate-EDTA gel.
Int. J. Med. Sci. 2010, 7
96
PCR followed by RFLP was used for CYP3A5
genotyping. PCR primers for CYP3A5 were designed
to amplify a 293 bp fragment (forward primer:
5’-CATCAGTTAGTAGACAGATGA-3’, reverse pri-
mer: 5’-GGTCCAAACAGGGAAGAAATA-3’) [19].
The 25μl PCR volume contained 2.5μl 10x PCR Buffer,
1μl MgCl
2
50mM, 1μl dNTPs 10mM, 0.5μl forward
primer 25pmol/μl, 0.5μl reverse primer 25pmol/μl,
0.25μl TAQ polymerase 5Units/μl, 1μl isolated DNA
and 18.25 μl ddH
2
0. PCR conditions were 1min at
94
ο
C, 40 cycles of 1min at 94
ο
C (template denatura-
tion), 1min at 55
ο
C (primer annealing), 1min at 72
ο
C
(primer extension) and finally, 7min at 72
ο
C (final
elongation). The PCR product was analyzed on a 2%
agarose/Tris-borate EDTA gel with ethidium bro-
mide staining (Figure 1).
Enzymatic digestion of PCR products was per-
formed using SspI endonouclease (New England Bi-
olabs). 25 μL PCR product was incubated for 2 hours
at 37
ο
C with 2μl SspI 5Units/μl and 3μl 10xBuffer. A
3.5% agarose/Tris-borate EDTA gel with ethidium
bromide staining was used and bands were detected
by a short wavelength UV transilluminator (Figure 1).
CYP3A5*1/*1 genotype gives 148-, 125- and 20- bp
bands, CYP3A5*3/*3 genotype gives 168- and 125-bp
bands and CYP3A5*1/*3 genotype gives 168-, 148-,
125- and 20- bp [19].
Statistical analysis
Tacrolimus kinetics were estimated with the use
of tacrolimus daily dose, concentration, dose adjusted
concentration and volume of distribution. Transplant
recipients weight (kgr) and daily dose (mgr/day) of
TAC in 14 days, 1, 3, 6, 12, 24 and 36 months were
recorded so that dose per weight (mgr/kgr/day)
could be calculated. The tacrolimus dose adjusted
concentration (concentration/dose ratio) and tacro-
limus volume of distribution (dose/concentration
ratio) were calculated. Statistical analysis was per-
formed with the use of PASW Statistics 17.0 (SPSS Inc,
Chicago, IL, USA). Pharmacokinetic parameters were
firstly modeled with the use of Linear Regression
(LR). The results were compared to General Linear
Model (GLM) repeated measures results.
LR predicts the dependent variable value based
on the values of at least one independent variable. It
assumes that the model depends linearly on the un-
known parameters and the conditional mean of Y
variable given the value of X is an affine function of X.
In GLM repeated measures approach, the dependent
variable is measured at multiple times (n) and it is
represented by n variables (within-subjects factors).
Categorical factors are used to divide study popula-
tion into subgroups (between-subjects factors) and
continuous variables are used as control variables
(covariates). Taking into account that linear relation-
ships, normal distribution of the dependent variables
and fixed effects exist, the effects of between- and
within-subjects factors as well as the interaction be-
tween factors and covariates and its effects are ana-
lyzed.
The difference between LR and GLM repeated
measures analysis is that LR does not take into ac-
count the sequel of the data and it encounters them as
derived from different patients. Thus, GLM repeated
measures approach seems to be a more accurate me-
thodology for the analysis of such data but it is more
demanding in the quantity of available data.
In the LR analysis, the kinetic parameters were
modeled based on sex, presence of CYP3A5*1 allele,
age at transplantation (<40 versus ≥40 years old), he-
patic (AST≤40U/ml and ALT≤35U/ml versus
AST>40U/ml and/or ALT>35U/ml) and renal (se-
rum creatinine ≤1.4mgr/dl versus >1.5mgr/dl) func-
tion. In the GLM repeated measures approach, a mul-
tivariate model was developed. Sex and genotype
were used to define the subgroups of our patient
population whilst the age at transplantation served as
a covariate. The threshold of statistical significance
was set at 5% (a=0.05).
Results
The characteristics of the study population are
shown in Table 1. The frequency of CYP3A5*3/*3
genotype was 87.5% (35/40) whereas the frequency of
the CYP3A5*1/*3 genotype was 12.5% (5/40). No
individual homozygote for CYP3A5*1 was detected.
Patients’ renal and hepatic function as well as tacro-
limus trough concentration are presented in Table 2.
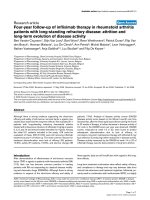
According to LR statistical approach, the pres-
ence of CYP3A5*1 variant was associated with lower
tacrolimus dose adjusted concentration at 3, 6, 12 and
36 months after transplantation (Figure 2). Hepatic
and renal function showed a statistically significant
effect on tacrolimus dose adjusted concentration at 3
months after transplantation (p<0.001 and 0.028, re-
spectively). There was no evidence that gender had a
significant impact on tacrolimus kinetic parameters.
The findings were confirmed with the use of
GLM repeated measures approach. As seen in Figure
3, carriers of CYP3A5*1 allele show lower predicted
measures for tacrolimus dose adjusted concentration
and higher predicted measures for tacrolimus volume
of distribution. With GLM approach, the effect of
timepoint, meaning the time after transplantation, on
tacrolimus kinetic parameters was significant
(p<0.001).
Int. J. Med. Sci. 2010, 7
97
Figure 2. Genotype effect on tacrolimus dose adjusted concentration: A linear regression model. (a. 3 months, b. 6 months,
c. 12 months and d. 36 months after transplantation).
Int. J. Med. Sci. 2010, 7
98
Figure 3. Genotype effect on tacrolimus dose adjusted concentration (a) and volume of distribution (b): A GLM repeated
measures approach.
Table 1. Demographic characteristics of patient popula-
tion (age is expressed as median value/25% quartile-75%
quartile).
Demographic characteristic Number
Gender (female/male) 13/27
Age (years, median/range) 41/35-54
Age for females (years) 42/37-53
Age for males (years) 41/35-54
Transplantation number (first/second) 28/12
Place of transplantation (our centre/elsewhere) 36/4
Cadaver transplantation 34
Age at the onset of the chronic renal deficiency (years) 38/24-50
Age at the onset of the chronic renal deficiency for
females
(years)
36/29-49
Age at the onset of the chronic renal deficiency for
males
(years)
38/23-50
Primary kidney disease
Unknown 14
Glomerulonephritis 9
Cystoureteral reflux 4
Polycystic kidney disease 3
Diabetic nephropathy 2
Alport syndrome 1
Eclampsia 1
Antiphospholipidic syndrome (Systemic lupus ery-
thematosus
)
1
Nephrolithiasis 3
Nephrosclerosis 1
Nephronophthisis 1
Table 2. Patients’ renal and hepatic function, and tacroli-
mus trough levels at 14 days, 1, 3, 6, 12, 24 and 36 months
after transplantation. Values are expressed as median (25%
quartile-75% quartile).
Timepoint AST (U/ml) ALT
(U/ml)
Cr (mgr/dl) Trough level
(ngr/ml)
14 days 15 (11-31) 27 (17-59) 1.7 (1.3-2.7) 11 (8.1-12.3)
1 month 13 (11-17) 24 (16-34) 1.8 (1.3-2.3) 10.7 (9.2-13)
3 months 16 (12-23) 20 (14-29) 1.6 (1.2-2.1) 10.4 (9.2-12.1)
6 months 13 (17-21) 16 (13-22) 1.6 (1.3-2.1) 10 (8.5-11.2)
12 months 18 (15-23) 18 (12-24) 1.4 (1.2-2) 9.1 (7.5-10.9)
24 months 17 (14-21) 17 (11-25) 1.4 (1.1-1.7) 7.2 (6.1-8.7)
36 months 18 (16-22) 19 (15-23) 1.3 (1.1-1.6) 6.7 (5.2-7.9)
Discussion
Pharmacogenetics emerged during 1950s seek-
ing to detect the potential relation between altered
genetic basis and behavior after drug administration.
However, several epigenetic factors such as age,
co-morbidity, disease seriousness, co-administrated
drug therapies and their interactions, renal and he-
patic function, nutritional and other habbits, are often
responsible for the intra- and inter-individual varia-
bility seen after drug administration [6,9]. For these
reasons, therapeutic drug monitoring constitutes a
crucial step in the administration of several drug
agents. However, this empirical treatment algorithm