Báo cáo y học: " Non-invasive stroke volume measurement and passive leg raising predict volume responsiveness in medical ICU patients: an observational cohort study"
Bạn đang xem bản rút gọn của tài liệu. Xem và tải ngay bản đầy đủ của tài liệu tại đây (340.12 KB, 9 trang )
Open Access
Available online />Page 1 of 9
(page number not for citation purposes)
Vol 13 No 4
Research
Non-invasive stroke volume measurement and passive leg raising
predict volume responsiveness in medical ICU patients: an
observational cohort study
Steven W Thiel, Marin H Kollef and Warren Isakow
Pulmonary and Critical Care Division, Washington University School of Medicine, Campus Box 8052, 660 South Euclid Avenue, St. Louis, MO
63110, USA
Corresponding author: Warren Isakow,
Received: 19 May 2009 Revisions requested: 22 Jun 2009 Revisions received: 25 Jun 2009 Accepted: 8 Jul 2009 Published: 8 Jul 2009
Critical Care 2009, 13:R111 (doi:10.1186/cc7955)
This article is online at: />© 2009 Thiel et al.; licensee BioMed Central Ltd.
This is an open access article distributed under the terms of the Creative Commons Attribution License ( />),
which permits unrestricted use, distribution, and reproduction in any medium, provided the original work is properly cited.
Abstract
Introduction The assessment of volume responsiveness and
the decision to administer a fluid bolus is a common dilemma
facing physicians caring for critically ill patients. Static markers
of cardiac preload are poor predictors of volume
responsiveness, and dynamic markers are often limited by the
presence of spontaneous respirations or cardiac arrhythmias.
Passive leg raising (PLR) represents an endogenous volume
challenge that can be used to predict fluid responsiveness.
Methods Medical intensive care unit (ICU) patients requiring
volume expansion were eligible for enrollment. Non-invasive
measurements of stroke volume (SV) were obtained before and
during PLR using a transthoracic Doppler ultrasound device
prior to volume expansion. Measurements were then repeated
following volume challenge to classify patients as either volume
responders or non-responders based on their hemodynamic
response to volume expansion. The change in SV from baseline
during PLR was then compared with the change in SV with
volume expansion to determine the ability of PLR in conjunction
with SV measurement to predict volume responsiveness.
Results A total of 102 fluid challenges in 89 patients were
evaluated. In 47 of the 102 fluid challenges (46.1%), SV
increased by ≥15% after volume infusion (responders). A SV
increase induced by PLR of ≥15% predicted volume
responsiveness with a sensitivity of 81%, specificity of 93%,
positive predictive value of 91% and negative predictive value of
85%.
Conclusions Non-invasive SV measurement and PLR can
predict fluid responsiveness in a broad population of medical
ICU patients. Less than 50% of ICU patients given fluid boluses
were volume responsive.
Introduction
Circulatory insufficiency is a common clinical problem faced
by physicians caring for critically ill patients. The decision to
employ volume expansion (VE) in these patients is compli-
cated [1]. If a patient is preload responsive, then VE improves
cardiac output (CO). Early resuscitation protocols that include
fluid therapy can be life saving early in the course of sepsis
[2,3]. However, in a preload unresponsive patient, volume
administration has no hemodynamic benefit. Liberal volume
resuscitation can exacerbate pulmonary edema, precipitate
respiratory failure, prolong mechanical ventilation times, and
contribute to the development of intra-abdominal hypertension
[4-6]. Prior studies have shown positive fluid balance to corre-
late with reduced survival [7-9]. In addition, prospective stud-
ies have shown that less than 50% of critically ill patients
respond to the fluid boluses that are deemed necessary by
treating clinicians [10-14]. A simple, non-invasive bedside test
to determine volume responsiveness that would assist clini-
cians in facing this daily dilemma would have significant utility.
Passive leg raising (PLR) is a simple maneuver used for gen-
erations as an initial intervention for patients in shock. This pro-
cedure rapidly returns 150 to 200 ml of blood from the veins
of the lower extremities to the central circulation [15]. As a
result of increased ventricular preload, the CO is augmented
according to the degree of preload reserve, and rapidly
CI: confidence interval; CO: cardiac output; CVP: central venous pressure; FTc: corrected flow time; ICU: intensive care unit; MAP: mean arterial
pressure; PAC: pulmonary artery catheter; PLR: passive leg raise; ROC: receiver operating characteristic; SV: stroke volume; VE: volume expansion.
Critical Care Vol 13 No 4 Thiel et al.
Page 2 of 9
(page number not for citation purposes)
reversed when the legs are returned to a horizontal position.
PLR therefore constitutes a reversible volume challenge dur-
ing which hemodynamic changes can be measured [16].
The aim of our study was to determine if noninvasive stroke
volume (SV) measurement could be used in conjunction with
PLR to predict the hemodynamic response to VE.
Materials and methods
Patients
This study was conducted at Barnes-Jewish Hospital, a univer-
sity-affiliated, urban teaching hospital. The study was
approved by the Washington University School of Medicine
Human Studies Committee. As the protocol was considered
part of routine practice, informed consent was waived.
Patients were informed that they participated in this study.
Patients were enrolled from the medical intensive care unit
(ICU), and any patient requiring VE as determined by the ICU
attending physician was eligible for enrollment. No specific cri-
teria for circulatory insufficiency were required for study entry.
However, the decision of the ICU attending to administer fluid
was based on clinical signs of inadequate tissue perfusion
(e.g. escalating vasopressor requirement, decreasing urine
output, etc.) and his/her clinical impression that the patient
should be given a trial of volume expansion. Exclusion criteria
included known aortic or pulmonary valve disease, known
ascending aortic aneurysm, or contraindication to PLR for any
reason.
Data collection
Stroke volume measurements were taken using a non-inva-
sive, transthoracic Doppler ultrasound device (USCOM
®
;
Uscom Ltd., Sydney, Australia). All measurements were per-
formed by a single investigator (ST) following training on the
device. Each study measurement was taken in accordance
with a previously described protocol designed to optimize
accuracy and reliability [17]. The device used directly meas-
ures the blood flow through either the aortic or pulmonary
valves. For each patient studied, both positions were
attempted and the location that resulted in the best signal was
used.
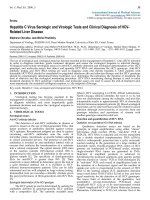
Study measurements were taken in four stages (Figure 1). In
stage one the patient was placed in a semi-recumbent position
with the head elevated at 45 degrees. In stage two, the patient
was positioned supine with the legs straight and elevated at
45 degrees for two minutes. Stage three readings were taken
two minutes after the patient was returned to the baseline
position, and stage four immediately following VE. Calibrated
automatic bed elevation (using standard ICU beds) was used
to move the patient between stages.
Products for VE varied according to the order of the attending
physician and included normal saline, Ringer's lactate and het-
astarch. The volume administered in each case was at least
500 ml, and was given as a pressurized rapid infusion.
Vasopressor doses and ventilator settings were not changed
at any time while a patient was being studied. Lower extremity
compression devices were removed prior to the initial read-
ings. Study measurements were recorded before, during, and
after PLR and after VE throughout the stages described
above.
Definition of volume responsiveness
Patients were classified according to their hemodynamic
response to VE. Responders had a SV increment of at least
15% in response to VE (an increase in SV from stage one to
stage four), while non-responders had a SV increase of less
than 15%. Cutoff values of 10% to 15% have been previously
used as representing a significant change in SV and cardiac
index in similar studies [1,16,18-20], and a 15% change was
reported as a significant difference between two measures of
CO by thermodilution [21].
Statistical analysis
Continuous data are expressed as mean ± standard deviation.
The Student's t-test was used for comparisons made between
parametric data, and nonparametric data were analyzed with
the Mann-Whitney U test. For categorical variables, chi-
squared or Fisher's exact tests were used to test for differ-
ences between groups. The areas under receiver operating
characteristic (ROC) curves are expressed as the area ±
standard error, and were compared using the Hanley-McNeil
method [22]. All tests were two-tailed, and a P value of less
Figure 1
Patient positioning during the four stages of measurementPatient positioning during the four stages of measurement. After each change in position, two minutes elapsed before readings were recorded. The
angle of elevation of the head or legs was 45 degrees. The patient's position was not changed between stages three and four.
Available online />Page 3 of 9
(page number not for citation purposes)
than 0.05 was pre-determined to be statistically significant.
Where applicable, the Bonferroni multiplicity adjustment to the
P value considered statistically significant is given [23,24].
Analyses were performed using the SPSS
©
version 11.0.1
software package (SPSS Inc., Chicago, IL, USA).
Results
Patient characteristics
A total of 102 volume challenges in 89 consecutive patients
were evaluated. One patient had three studies performed,
while the remaining patients with more than one study had two
studies each. Repeat studies performed on the same patient
were separated in time by at least 24 hours. Thirteen additional
patients were examined, although either they were unable to
tolerate the procedure (three patients), unable to cooperate
due to confusion or delirium (six patients), or satisfactory Dop-
pler signals could not be obtained (four patients).
Stroke volume increased by 15% or more in 47 (46.1%)
instances (responders), and by less than 15% in 55 (53.9%)
instances (non-responders). For the purposes of data analysis,
each volume challenge was considered an independent
observation regardless of whether it was part of multiple stud-
ies performed on the same patient.
The resulting pool of volume challenges were performed on
patients who were aged 59.4 ± 15.1 years, with 58 (56.9%)
men and 44 (43.1%) women. Fifty-nine (57.8%) patients were
receiving vasopressor support, 67 (65.7%) were mechanically
ventilated, with 14 (20.9%) of those fully accommodated to
the ventilator, and their Acute Physiology and Chronic Health
Evaluation II score was 18.5 ± 6.1. The time elapsed between
ICU admission and study entry was 61.7 ± 106.2 hours. Car-
diac arrhythmias were present in 18 (17.5%) patients (atrial
fibrillation in eight, premature ventricular beats in six, and pre-
mature atrial beats in four). The patient characteristics are
summarized in Table 1.
Effects of PLR and volume expansion
The initial hemodynamic measurements are summarized in
Table 2. The responders had a significantly lower initial SV (68
± 25 ml vs. 87 ± 30 ml, P<0.001 compared with the non-
responders, although the CO (6.8 ± 2.5 L/min vs. 8.0 ± 2.9 L/
min, P = 0.03), corrected flow time (FTc; 363 ± 70 ms vs. 398
± 66 ms, P = 0.01), mean arterial pressure (MAP; 68 ± 13
mmHg vs. 74 ± 14 mmHg, P = 0.03), and heart rate (101 ±
20 beats/min vs. 93 ± 20 beats/min, P = 0.06) were not dif-
ferent between the groups (Bonferroni adjusted level of signif-
icance for all comparisons 0.01).
The hemodynamic readings taken throughout the four stages
of measurements are summarized in Table 3. For the respond-
ers, PLR induced a significant increase in SV (68 ± 25 ml vs.
82 ± 30 ml, P = 0.001), but the CO (6.8 ± 2.5 L/min vs. 8.0
± 2.8 L/min, P = 0.03), FTc (363 ± 70 ms vs. 380 ± 68 ms, P
= 0.22), MAP (68 ± 13 mmHg vs. 72 ± 11 mmHg, P = 0.11),
heart rate (101 ± 20 beats/min vs. 99 ± 21 beats/min, P =
0.64), and pulse pressure (42 ± 14 mmHg vs. 45 ± 14 mmHg,
P = 0.23) were unchanged (Bonferroni adjusted level of sig-
nificance for all comparisons 0.01). The increase in SV was
completely reversed when the patient was returned to the
semi-recumbent position.
In the non-responders, PLR did not induce a significant
change in any of the hemodynamic values measured. The SV
(87 ± 30 ml vs. 91 ± 33 ml, P = 0.58), CO (8.0 ± 2.9 L/min
vs. 8.4 ± 3.5 L/min, P = 0.46), FTc (398 ± 66 ms vs. 404 ±
78 ms, P = 0.66), MAP (74 ± 14 mmHg vs. 74 ± 16 mmHg,
P = 0.95), heart rate (93 ± 20 beats/min vs. 94 ± 21 beats/
min, P = 0.84), and pulse pressure (48 ± 15 mmHg vs. 49 ±
17 mmHg, P = 0.97) remained unchanged during PLR.
The changes in SV compared with stage one induced by both
PLR and VE were significantly higher in the responders com-
pared with the non-responders. The SV increased in response
to PLR in the responders and non-responders by 21.0% ±
12.5% and 3.2% ± 10.4%, respectively (P<0.001, Bonferroni
adjusted level of significance 0.01; Figure 2). The SV
increased in response to VE in the responders and non-
responders by 26.3% ± 14.2% and 3.5% ± 8.6%, respec-
tively (P < 0.001, Bonferroni adjusted level of significance
0.01). The PLR-induced increase in SV was reversed once the
patient was taken out of the PLR position (Table 3).
Central venous pressure
The initial central venous pressure (CVP) was not different
between the groups of responders and non-responders (7.8 ±
4.9 mmHg vs. 8.1 ± 4.8 mmHg, P = 0.80; Table 2). Addition-
ally, the change in CVP between stages one and four was not
different between the responders and non-responders (2.1 ±
3.0 mmHg vs. 3.2 ± 2.3 mmHg, P = 0.13).
Prediction of volume response
A SV increase induced by PLR of 15% or more predicted vol-
ume response with a sensitivity of 81%, specificity of 93%,
positive predictive value of 91%, and a negative predictive
value of 85% (Figure 3).
The area under the ROC curve for the percent change in SV
during PLR predicting a response to VE was 0.89 ± 0.04.
Other than the SV, no hemodynamic index significantly
changed during PLR. However, several other indices were dif-
ferent, although not statistically significant, at baseline
between the responders and non-responders. ROC curves for
these initial measures predicting volume response were also
constructed. Compared with the SV change during PLR these
indices were inferior at differentiating the responders from the
non-responders, and included the stage one SV (ROC curve
area 0.70 ± 0.05, P = 0.001), CO (0.62 ± 0.06, P < 0.001),
CVP (0.52 ± 0.08, P < 0.001), MAP (0.63 ± 0.06, P < 0.001),
Critical Care Vol 13 No 4 Thiel et al.
Page 4 of 9
(page number not for citation purposes)
and FTc (0.65 ± 0.06, P < 0.001). The ROC curves for SV
change with PLR and initial CVP and SV are shown in Figure
4.
Repeatability of measurements
A repeatability analysis was performed using the paired read-
ings for stages one and three from each patient. The hemody-
namic effects of PLR are transient and reversible, and
vasoactive agents were not changed between these measure-
ments. Therefore, it is expected that the readings from these
stages would not be different and can be used to validate the
use of a 15% change in SV as being significant. Using the
method described by Bland and Altman [25] the upper and
lower limits of agreement between stages one and three were
13.9% (95% confidence interval (CI) = 13.2% to 14.6%) and
-10.9% (95% CI = -11.6% to -10.2%), respectively. The cor-
responding plot of the log-transformed SV difference against
mean is shown in Figure 5.
Discussion
Our study demonstrates that a completely non-invasive SV
measurement in conjunction with PLR can predict the hemo-
dynamic response to VE. In our relatively unselected popula-
tion of medical ICU patients, the change in SV with PLR was
the only hemodynamic index with significant predictive ability.
The initial CVP was not different between the groups of
Table 1
Patient characteristics and etiology of circulatory insufficiency
All Responders Non-responders P
Age (years) 59.4 ± 15.1 56.1 ± 13.5 62.2 ± 15.9 0.04
Sex, n (%)
Male 58 (56.9%) 30 (63.8%) 28 (50.9%) 0.19
Female 44 (43.1%) 17 (36.2%) 27 (49.1%)
BMI (kg/m
2
) 31.0 ± 11.5 31.6 ± 11.7 30.5 ± 11.5 0.66
Admitted from, n (%)
ED 49 (48.0%) 23 (48.9%) 26 (47.3%) 0.87
Other hospital 17 (16.7%) 7 (14.9%) 10 (18.2%) 0.79
Ward 36 (35.3%) 17 (36.2%) 19 (34.5%) 0.86
Time since ICU admission (hours) 61.7 ± 106.2 52.2 ± 95.9 69.9 ± 114.6 0.40
APACHE II score 18.5 ± 6.1 17.8 ± 5.9 19.2 ± 6.2 0.29
Mechanical ventilator 67 (65.7%) 34 (72.3%) 33 (60.0%) 0.19
Vasopressor support 59 (57.8%) 27 (57.4%) 32 (58.2%) 0.94
Norepinephrine dose (mcg/kg/min) * 0.17 ± 0.15 0.16 ± 0.17 0.17 ± 0.14 0.88
Fluid administered since onset of circulatory 6277 ± 7180 5775 ± 5829 6713 ± 8208 0.52
Insufficiency (ml)
Arrhythmia present 18 (17.6%) 3 (6.4%) 15 (27.3%) 0.008
Clinical diagnosis **
Sepsis 62 (60.8%) 27 (57.4%) 35 (63.6%) 0.52
Cardiogenic shock 4 (3.9%) 1 (2.1%) 3 (5.5%) 0.62
Hypovolemia 20 (19.6%) 10 (21.3%) 10 (18.2%) 0.69
Brain injury 1 (1.0%) 0 (0%) 1 (1.0%)
Toxic ingestion 1 (1.0%) 0 (0%) 1 (1.0%)
Other 2 (2.0%) 1 (1.0%) 1 (1.0%)
Unknown 12 (11.8%) 8 (17.0%) 4 (7.3%) 0.22
The P values given are for comparisons between the responders and non-responders.
* All but two patients who required vasopressor support were on norepinephrine alone. Those patients (both non-responders) are not included in
this calculation.
** Diagnostic impression of the attending physician.
APACHE = acute physiology and chronic health evaluation; BMI = body mass index; ED = emergency department; ICU = intensive care unit.
Available online />Page 5 of 9
(page number not for citation purposes)
responders and non-responders, and the change in CVP did
not correlate with the change in SV following VE. A repeatabil-
ity analysis revealed that a cutoff of 15% representing a signif-
icant change in SV is reasonable.
The ultrasound device used in this study has been previously
evaluated for accuracy and reliability. Knobloch and col-
leagues studied 36 patients undergoing coronary revasculari-
zation with 180 paired CO and SV measurements using the
USCOM
®
and a pulmonary artery catheter (PAC) [26]. Good
correlation was found for both CO and SV (correlation index
0.79, P < 0.01 and 0.95, P < 0.01, respectively), and a Bland-
Altman analysis demonstrated a bias of 0.23 ± 1.01 L/min for
the CO measurements. Chand and colleagues studied 50
Table 2
Initial hemodynamic readings taken in stage one
All Responders Non-responders P
Stroke volume (ml) 79 ± 29 68 ± 25 87 ± 30 < 0.001
Cardiac output (L/min) 7.4 ± 2.8 6.8 ± 2.5 8.0 ± 2.9 0.03
Corrected flow time (ms) 382 ± 70 363 ± 70 398 ± 66 0.01
Mean arterial pressure (mmHg) 71 ± 13 68 ± 13 74 ± 14 0.03
Pulse pressure (mmHg) 45 ± 15 42 ± 14 48 ± 15 0.02
Heart rate (beats/min) 96 ± 20 101 ± 20 93 ± 20 0.06
Central venous pressure
Number of observations 59 (57.8%) 25 (53.2%) 34 (61.8%) 0.38
Value (mmHg) 7.9 ± 4.8 7.8 ± 4.9 8.1 ± 4.8 0.80
The P values given are for comparisons between the responders and non-responders. Except for the comparison of the central venous pressure,
the Bonferroni adjusted level of significance for all P values shown is 0.01.
Table 3
Hemodynamic readings taken throughout the four stages of measurement
Stage 1 Stage 2 P
2,1
Stage 3 P
3,1
Stage 4 P
4,1
Responders
SV (ml) 68 ± 25 82 ± 30 0.001 70 ± 26 0.76 86 ± 31 0.004
SV % change from stage 1 21.0 ± 12.5 2.4 ± 7.8 26.3 ± 14.2
CO (L/min) 6.8 ± 2.5 8.0 ± 2.8 0.03 6.9 ± 2.6 0.89 8.3 ± 3.1 0.009
FTc (ms) 363 ± 70 380 ± 68 0.22 356 ± 59 0.62 393 ± 66 0.03
MAP (mmHg) 68 ± 13 72 ± 11 0.11 70 ± 11 0.41 71 ± 16 0.38
Heart rate (beats/min) 101 ± 20 99 ± 21 0.64 100 ± 21 0.81 99 ± 20 0.61
Pulse pressure (mmHg) 42 ± 14 45 ± 14 0.23 45 ± 13 0.30 49 ± 16 0.02
CVP (mmHg) 7.8 ± 4.9 9.9 ± 3.9 0.10
Non-responders
SV (ml) 87 ± 30 91 ± 33 0.58 88 ± 30 0.99 90 ± 31 0.62
SV % change from stage 1 3.2 ± 10.4 0.3 ± 5.9 3.5 ± 8.6
CO (L/min) 8.0 ± 2.9 8.4 ± 3.5 0.46 7.9 ± 2.9 0.97 8.2 ± 3.1 0.71
FTc (ms) 398 ± 66 404 ± 78 0.66 399 ± 68 0.89 405 ± 68 0.58
MAP (mmHg) 74 ± 14 74 ± 16 0.95 73 ± 14 0.72 74 ± 16 0.97
Heart rate (beats/min) 93 ± 20 94 ± 21 0.84 93 ± 20 0.91 92 ± 20 0.75
Pulse pressure (mmHg) 48 ± 15 49 ± 17 0.97 49 ± 18 0.89 49 ± 19 0.83
CVP (mmHg) 8.1 ± 4.8 11.3 ± 5.5 0.01
Except for the comparison of the stage 1 and 4 CVP, the Bonferroni adjusted level of significance for all P values shown is 0.01.
CO = cardiac output; CVP = central venous pressure; FTc = corrected flow time; MAP = mean arterial pressure; SV = stroke volume.