Báo cáo y học: "A prospective observational study of the relationship of critical illness associated hyperglycaemia in medical ICU patients and subsequent development of type 2 diabetes"
Bạn đang xem bản rút gọn của tài liệu. Xem và tải ngay bản đầy đủ của tài liệu tại đây (734.29 KB, 8 trang )
Gornik et al. Critical Care 2010, 14:R130
/>Open Access
RESEARCH
© 2010 Gornik et al.; licensee BioMed Central Ltd. This is an open access article distributed under the terms of the Creative Commons
Attribution License ( which permits unrestricted use, distribution, and reproduction in
any medium, provided the original work is properly cited.
Research
A prospective observational study of the
relationship of critical illness associated
hyperglycaemia in medical ICU patients and
subsequent development of type 2 diabetes
Ivan Gornik*
1
, Ana Vujaklija-Brajkovi
ć
1
, Ivana Pavli
ć
Renar
2
and Vladimir Gašparovi
ć
1
Abstract
Introduction: Critical illness is commonly complicated by hyperglycaemia caused by mediators of stress and
inflammation. Severity of disease is the main risk factor for development of hyperglycaemia, but not all severely ill
develop hyperglycemia and some do even in mild disease. We hypothesised that acute disease only exposes a latent
disturbance of glucose metabolism which puts those patients at higher risk for developing diabetes.
Methods: Medical patients with no history of impaired glucose metabolism or other endocrine disorder admitted to
an intensive care unit between July 1998 and June 2004 were considered for inclusion. Glucose was measured at least
two times a day, and patients were divided into the hyperglycaemia group (glucose ≥7.8 mmol/l) and normoglycaemia
group. An oral glucose tolerance test was performed within six weeks after discharge to disclose patients with
unknown diabetes or pre-diabetes who were excluded. Patients treated with corticosteroids and those terminally ill
were also excluded from the follow-up which lasted for a minimum of five years with annual oral glucose tolerance
tests.
Results: A five-year follow-up was completed for 398 patients in the normoglycaemia group, of which 14 (3.5%)
developed type 2 diabetes. In the hyperglycaemia group 193 patients finished follow-up and 33 (17.1%) developed
type 2 diabetes. The relative risk for type 2 diabetes during five years after the acute illness was 5.6 (95% confidence
interval (CI) 3.1 to 10.2).
Conclusions: Patients with hyperglycaemia during acute illness who are not diagnosed with diabetes before or during
the hospitalization should be considered a population at increased risk for developing diabetes. They should, therefore,
be followed-up, in order to be timely diagnosed and treated.
Introduction
Hyperglycaemia commonly occurs in the course of any
critical illness. This now generally known fact, first
described by Claude Bernard in 1878 [1], became widely
accepted after studies had shown its association with
worse outcomes [2,3] and the positive effects of tight glu-
cose control in the critically ill [4,5]. The issue is still
focussed on after later studies [6] opened up a debate on
how tight the control of glycaemia should be [7,8]. The
usual idioms used for this phenomenon are stress hyperg-
lycaemia and critical illness hyperglycaemia which
include hyperglycaemia that occurs in patients with and
without diabetes. The term hospital acquired hypergly-
caemia [9] is proposed for hyperglycaemia in patients to
whom no disorder of glucose metabolism can be diag-
nosed after the acute illness subsided.
The increase in blood glucose during acute illness is a
consequence of complex mechanisms that are a part of
stress and inflammatory responses. Cortisol is the main
mediator of stress response, but other stress hormones
such as catecholamines, glucagon and growth hormone
also have hyperglycaemic effects [10,11]. Mediators of
* Correspondence:
1
Department of Intensive Care Medicine, University Hospital Centre Rebro,
Kispaticeva 12, Zagreb 10000, Croatia
Full list of author information is available at the end of the article
Gornik et al. Critical Care 2010, 14:R130
/>Page 2 of 8
systemic inflammatory response, such as interleukin-1
(IL-1) and tumor necrosis factor alpha (TNF-α), cause
hyperglycaemia and peripheral insulin resistance by
inducing the release of stress hormones. They also alter
insulin receptor signalling [12-16] and create insulin
resistance. Due to these actions, glucose uptake in fat and
muscle cells is reduced and hepatic gluconeogenesis is
not suppressed despite hyperglycaemia. Consequent to
inhibition of pancreatic beta-cells by cytokines and cate-
cholamines, insulin concentrations may be normal or
even decreased [17-19]. Medical interventions, such as
enteral and parenteral nutrition, administration of vaso-
pressors and glucocorticoids, add even further to dis-
turbed glucose homeostasis. Despite the fact that
endocrine and metabolic changes probably occur in all
acutely ill patients, evident hyperglycaemia is not present
in all of them. Its occurrence is certainly associated with
the severity of illness, and has been associated with unfa-
vourable outcomes in several acute conditions [2,3,20,21].
Nevertheless, all patients with severe infections, severe
myocardial infarction or other critical illnesses do not
develop hyperglycaemia and some will have hyperglycae-
mia even in milder disease. A patient's predisposition
(pancreatic reserve and baseline insulin resistance) obvi-
ously plays an important part in the development of
hyperglycaemia. We hypothesised that hospital acquired
hyperglycaemia reveals this predisposition, that is, those
patients are at risk for developing type 2 diabetes in the
period subsequent to acute illness.
Materials and methods
This was a prospective observational study performed in
University Hospital Centre Rebro, Zagreb. Medical
patients admitted to the intensive care unit during the
period from July 1998 to June 2004 were included. Adult
patients admitted to the ICU were evaluated for inclusion
if they had a negative history of diabetes mellitus (DM),
impaired fasting glucose (IFG), impaired glucose toler-
ance (IGT) or any other endocrine disorder. Patients
receiving corticosteroid treatment and those with acute
pancreatitis were not considered. For all other patients,
blood glucose levels were measured at least twice a day
(at 6 AM and 6 PM) during their ICU stay. The terms
fasting and postprandial are intentionally omitted conse-
quent to specific circumstances in critically ill patients.
Additional glucose measurements were performed for
patients with variable blood glucose or if insulin was
administered for treatment of hyperglycaemia. Venous
blood was analyzed on a point-of-care blood gas analyzer
(IL GEM
®
Premier™ 3000, Instrumentation Laboratories,
Lexington, MA, USA). The threshold for hyperglycaemia
was set at > 7.7 mmol/l (140 mg/dL), but all blood glucose
measurements were recorded for analyses.
Patients were fed according to the Department policy.
In short, all patients were fed from admission; all patients
who could tolerate or had no counter indications were fed
enterally (by mouth, gastric or jejunal tube); patients were
fed parenterally if they did not tolerate enteral feeding; a
combination of enteral and parenteral nutrition was given
to patients who could not enterally receive targeted
caloric intake set at 15 kCal/kg/day [22,23]. Mean
achieved caloric intake (percent of target) was recorded
for all patients.
To allow for better comparison of results, patients were
divided into three groups according to their primary
admission diagnosis: i) sepsis (including severe sepsis and
septic shock); ii) acute coronary syndrome (myocardial
infarction and unstable angina); and iii) all other admis-
sion diagnoses. This division was made due to the fact
that sepsis and acute coronary syndromes combined
account for more than two-thirds of medical ICU admis-
sions in our hospital. Other admission diagnoses alone
could not achieve a sufficient number of patients to be
appropriately analysed separately.
Patients discharged from the hospital alive were asked
to participate in the follow-up. Those who consented
were tested using oral glucose tolerance test (OGTT) four
to six weeks after discharge to exclude pre-existing (not
diagnosed) impairment of glucose metabolism. Patients
who were diagnosed with IGF, IGT or DM were excluded
from follow-up. We also excluded patients with dissemi-
nated malignant disease, end-stage chronic disease or any
other acute or chronic condition that was expected to
cause early fatality and hinder planned five-year follow-
up. At the beginning of the follow-up we recorded the
patient's height and weight, cholesterol and triglyceride
concentrations. All patients were given advice on positive
lifestyle changes: dietary improvements, weight loss for
the overweight, regular aerobic cardiovascular exercise,
and so on.
During the follow-up period, all patients were con-
tacted annually and their glycaemic status was evaluated
by OGTT. If the diagnosis of DM, IFG or IGT was estab-
lished independently from the study, amid yearly re-eval-
uations, the diagnosis was recorded without further
confirmation. Patients diagnosed with DM, IFG or IGT
were referred to an endocrinologist and were not fol-
lowed up further. If a patient was diagnosed with another
endocrine disorder or started receiving corticosteroids
during the follow-up, he/she was excluded from the
study. The follow-up was planned to last for at least five
years, but yearly assessments were continued even longer
when possible. We concluded the follow up on 31 July
2009.
Gornik et al. Critical Care 2010, 14:R130
/>Page 3 of 8
Definitions
Impaired fasting glucose (IFG), impaired glucose toler-
ance (IGT) and diabetes mellitus (DM) were defined
according to the ADA criteria [24]. Sepsis, severe sepsis
and septic shock were defined according to the usual cri-
teria [25]. Acute coronary syndrome, unstable angina and
myocardial infarction were defined according to the
ACC/AHA criteria [26,27]
Statistical analyses
MedCalc™ v. 9.6.2.0 (MedCalc Software, Mariakerke, Bel-
gium). statistical software was used for all statistical anal-
yses. Categorical data are presented as absolute and
relative frequencies, continuous variables as median with
inter-quartile range (IQR). Since distribution of data of
the continuous variables did not always follow normal
distribution, Wilcoxon's test was chosen for group com-
parisons of continuous variables. Chi square test was
used for categorical variables. Statistical significance was
set at α = 0.05.
The study was approved by the Ethics Committee of the
University Hospital Centre. All patients included in the
study signed an informed consent form. The study was
not funded or supported by any organization, group or
individual.
Results
During the six inclusion years there were 2,207 ICU
admissions, 1,822 with no history of hyperglycaemia or
diabetes prior to the admission. Of those, 1,548 (90.6%)
were discharged from the hospital alive and were consid-
ered for inclusion in the study. We excluded 211 patients
who refused to participate in the study, 203 patients due
to terminal illness, and another 29 patients who were
receiving corticosteroid treatment.
Of the remaining 1,105 patients, 669 were normogly-
caemic during the whole ICU stay and 436 had hypergly-
caemia (venous blood glucose > 7.7 mmol/l). Diabetes or
impaired glucose metabolism was diagnosed after dis-
charge in 76 patients in the hyperglycaemia group which
led to their exclusion from the follow-up decreasing
hyperglycaemia group to 360 patients. The follow-up was
thus initiated for 1,029 patients; their characteristics at
baseline are given in Table 1. There were no differences in
age and sex distribution. Patients in the hyperglycaemia
group had a higher proportion of positive family history
of diabetes and higher body mass indexes.
During the five years of follow-up, 102 (15.2%) patients
in the normoglycaemia group and 66 (18.3%) patients in
the hyperglycaemia group died. There were 154 patients
in the normoglycaemia group and 93 in the hyperglycae-
mia group who discontinued their assessments. Also, we
stopped the follow-up for 15 patients in the normogly-
caemia group and 8 in the hyperglycaemia group because
steroid treatment was initiated for treatment of various
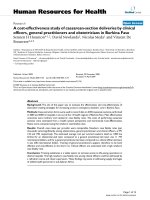
conditions. Figure 1 shows the flow diagram illustrating
the patient disposition during follow-up.
Planned follow-up of five years was concluded for 591
patients. At the end of the follow-up there was no differ-
ence between the normoglycaemia and hyperglycaemia
group in body mass index (25.2 (17.0 to 37.8) vs. 26.9
(18.1 to 39.4) respectively; P = 0.261). Loss of patients
during the follow-up did not significantly affect other
patients' characteristics from those at baseline (data not
shown). The five-year follow-up was completed for 193
patients in the hyperglycaemia group of which 47 (24.4%)
developed fasting hyperglycaemia or impaired glucose
tolerance, while 33 (16.6%) developed type 2 diabetes. Of
398 patients in the normoglycaemia group 49 (12.3%)
developed IFG or IGT, while 14 (3.5%) were diagnosed
with type 2 diabetes mellitus during five years (Table 2).
Chi-square test showed this to be a statistically significant
difference (P < 0.001). According to these results, patients
with hyperglycaemia (defined as glucose ≥7.8 mmol/l)
during acute illness had a relative risk for developing type
2 diabetes of 5.6 (95% CI 3.1 to 10.2) and for developing
IFG or IGT of 2.3 (95% CI 1.6 to 3.4).
Patients included in the early years of the study were
followed after the targeted five-year period; maximal fol-
low-up time was 11 years for patients included in the first
year. Cumulative incidence of diabetes during those 11
years is shown in Figure 2; Logrank analysis of the curves
gives significant difference (P < 0.001). When we evalu-
ated the three groups of diagnoses separately, we found
that the absolute and relative risks for the onset of newly
diagnosed impaired glucose metabolism were similar
(Table 2).
Discussion
Our results all point to an increased risk of developing
diabetes mellitus or impaired glucose metabolism in the
period following acute illness complicated with hypergly-
caemia. There was no tight glucose control policy in our
department during the inclusion years. Therefore, the
glucose values measured are mostly natural levels, with-
out intervention. Feeding regimen and caloric intake can
play a role in development of hyperglycaemia, but they
were not different between the groups. Most of the
patients in both groups were enterally fed, and there was
no difference in given caloric intake.
The patients with hyperglycaemia had a higher propor-
tion of positive family history of diabetes and higher
median body mass index which shows that usual risk fac-
tors for diabetes contribute to development of hypergly-
caemia in acute illness. Although we cannot claim that
those statistically significant differences have clinical rel-
evance, they offer at least partial explanation for the
increased risk of diabetes during follow-up. Whatever the
Gornik et al. Critical Care 2010, 14:R130
/>Page 4 of 8
underlying physiology, there is a combination of physio-
logical factors predisposing a patient for hyperglycaemia
in acute illness, during which hyperglycaemic mecha-
nisms in stress and inflammatory response reveal the dis-
order. After the acute illness subsides, blood glucose
returns to normal, but the disorder that led to hospital
acquired hyperglycaemia remains and in some patients
leads to overt impairment of glucose metabolism.
Metabolic disorders that make a patient prone to
hyperglycaemia are a subject of speculation, but almost
certainly include pre-existing increased insulin resistance
and dysfunction of beta cells. Insulin resistance is present
in the acutely ill [13,15,18,28] in different intensity, but
the factors determining the extent of insulin resistance
are not known. Our observation that body mass index,
which is certainly associated with insulin resistance [29],
is higher in the hyperglycaemia group offers part of the
answer. Beta cell dysfunction was associated with respira-
tory and cardiac failure in critically ill children [30].
There are possibly some more disorders responsible for
tendency to hyperglycaemia that are the root of hospital
acquired hyperglycaemia and in the long term lead to
development of diabetes.
Although the incidence of hospital acquired hypergly-
caemia differed between the three subgroups of patients,
the risk for diabetes is similar. The mechanisms contrib-
uting to hyperglycaemia differ among syndromes, espe-
cially between acute coronary syndromes, where
inflammation probably plays a minor role and sepsis
where systemic inflammation is an important contribut-
ing factor. The difference in the incidence of hyperglycae-
mia is probably a consequence of those differences and
the differences in the severity of disease. However, it
seems that it is not important what tilts the glycaemic
control out of balance, since patients suffer comparable
risks for development of DM, IFG or IGT.
This study was limited to medical ICU patients and its
results may not apply to surgical patients, although the
mechanisms leading to hyperglycaemia should be the
same. A similar study on surgical populations is needed,
until then we can only assume a similar effect. It is possi-
ble that surgical patients will need a higher cut-off for
hyperglycaemia since hyperglycaemia is more common.
The definition of hospital acquired hyperglycaemia is
not universal [31]. For instance, some studies used the
same threshold that we did [32,33], one study compared
three groups: glucose < 7.8 vs. 7.8 to 11.1 vs. glucose
Table 1: Characteristics of patients in normoglycaemia and hyperglycaemia group at initiation of follow-up
All patients
(N = 1,029)
Patients with
hyperglycaemia
(N = 360)
Patients without
hyperglycaemia
(N = 669)
Hyperglycaemia vs.
normoglycaemia
Diagnoses (N, %)
- sepsis
a
376 164 (43.6%) 202 (56.4%) P < 0.001
- ACS
b
322 97 (30.1%) 225 (69.9%)
- other diagnoses 331 99 (29.9%) 232 (70.1%)
Age (years) 58 (19 to 87) 59 (22 to 87) 58 (19 to 86) P = 0.214
Male sex (N, %) 570 (55.4%) 194 (53.9%) 376 (56.2%) P = 0.781
Body mass index (kg/m
2
)
27.3 (17.5 to 39.8) 29.4 (17.5 to 39.8) 26.8 (17.6 to 38.5) P = 0.025
Family history of diabetes 108 (10.5%) 48 (13.3%) 60 (8.9%) P = 0.038
Triglycerides (mmol/l) 1.4 (0.9 to 4.5) 1.4 (0.9 to 4.2) 1.3 (0.9 to 4.5) P = 0.106
Cholesterol (umol/l) 4.5 (2.1 to 7.7) 4.8 (2.0 to 9.7) 4.9 (2.1 to 8.0) P = 0.146
Glucose levels
c
6.4 (2.7 to 23.5) 7.6 (3.8 to 23.5) 5.2 (2.7 to 7.7) P < 0.001
Feeding regimen (N, %)
- enteral nutrition only 703 (68.3%) 248 (68.8%) 455 (68.1%) P = 0.823
- total parenteral or
combination
326 (31.7%) 112 (31.1%) 214 (31.9%)
Caloric intake (% of target) 85% (66 to 115) 88% (69 to 112) 84% (67 to 113) P = 0.541
a
includes severe sepsis and septic shock
b
ACS, acute coronary syndrome (unstable angina and myocardial infarction)
c
Medians and ranges of all measured blood glucose levels for all patients in a group
Categorical data are presented as absolute and relative frequencies, continuous variables with medians with interquartile range.
Gornik et al. Critical Care 2010, 14:R130
/>Page 5 of 8
≥11.1 mmol/l [34]. Other studies compared tertiles or
sextiles of glycaemia [31]. We defined hospital acquired
hyperglycaemia as glucose > 7.7 mmol/l (140 mg/dL),
which is the cut-off value in the Recommendations of the
American Heart Association [35] and the trigger for initi-
ation of insulin treatment for ICU patients recommended
by the American College of Endocrinology [36-38]. A
higher threshold would probably reduce the hyperglycae-
mia group, but not necessarily increase the relative risk
for diabetes, since it would put more patients with the
presumptive disorder in the normoglycaemia group.
According to the literature, the incidence of hypergly-
caemia ranges from about 30% to as high as 100% [30,39-
44], depending on the severity of disease, patient case-
mix and even more importantly on the chosen threshold
for hyperglycaemia. Overall, our incidence of hypergly-
caemia is similar to results published in the literature.
Our case-mix had a high proportion of patients with ACS
and sepsis. This can, in part, be explained by the fact that
there are specialised intensive care units in the hospital
that admitted specific diagnoses. ACS patients were
admitted in high proportion because of the small number
Figure 1 Flow diagram showing the loss of patients from initial screening to the end of five-year follow-up.
274 died in hospital
- 211 refused participation
- 203 terminally ill
669
1548 screened
385 with a history of DM, IFG or IGT
1822
669
NORMOGLYCAEMIA
76 excluded:
started follow-up
193
47 IGF / IFG
13 DM
133 normoglycaemic
389
49 IGF / IFG
14 DM
326 normoglycaemic
finished follow-up
436
HYPERGLYCAEMIA
360
66 died
93 discontinued follow-up
102 died
154 discontinued follow-up
- 29 receiving corticosteroids
- newly diagnosed DM, IGT or IFG
15 started steroid treatment
8 started steroid treatment
2207
patients admitted
to medical ICU
443 excluded