Báo cáo y học: "The epidemiology of medical emergency contacts outside hospitals in Norway - a prospective population based study"
Bạn đang xem bản rút gọn của tài liệu. Xem và tải ngay bản đầy đủ của tài liệu tại đây (287.19 KB, 9 trang )
ORIGINAL RESEARCH Open Access
The epidemiology of medical emergency contacts
outside hospitals in Norway - a prospective
population based study
Erik Zakariassen
1,2*
, Robert Anders Burman
1
, Steinar Hunskaar
1,3
Abstract
Introduction: There is a lack of epidemiological knowledge on medical emergencies outside hospitals in Norway.
The aim of the present study was to obtain representative data on the epidemiology of medical emergencies
classified as “red responses” in Norway.
Method: Three emergency medical dispatch centres (EMCCs) were chosen as catchment areas, covering 816 000
inhabitants. During a three month period in 2007 the EMCCs gathered information on every situation that was
triaged as a red response, according to The Norwegian Index of Medical Emergencies (Index). Records from
ground ambulances, air ambulances, and the primary care doctors were subsequently collected. International
Classification of Primary Care - 2 symptom codes (ICPC-2) and The National Committee on Aeronautics (NACA)
Score System were given retrospectively.
Results: Total incidence of red response situations was 5 105 during the three month period. 394 patients were
involved in 138 accidents, and 181 situations were without patients, resulting in a total of 5 180 patients. The
patients’ age ranged from 0 to 107 years, with a median age of 57, and 55% were male. 90% of the red responses
were medical problems with a large variation of symptoms, the remainder being accidents. 70% of the patients
were in a non-life-threatening situation. Within the accident group, males accounted for 61%, and 35% were aged
between 10 and 29 years, with a median age of 37 years. Few of the 39 chapters in the Index were used, A10
“Chest pain” was the most common one (22% of all situations). ICPC-2 symptom codes showed that cardiovascular,
syncope/coma, respiratory and neurological problems were most common. 50% of all patients in a sever situation
(NACA score 4-7) were > 70 years of age.
Conclusions: The results show that emergency medicine based on 816 000 Norwegians mainly consists of medical
problems, where the majority of the patients have a non-life-threatening situation. More focus on the emergency
system outside hospitals, including triage and dispatch, and how to best deal with “everyday” emergency problems
is needed to secure knowledge based decisions for the future organization of the emergency system.
Introduction
Persons in need of acute medical assistance are sup-
posed to come in contact with the emergency care sys-
tem by calling a three digits emergency number (113) to
an emergency medical dispatch centre (EMCC). The 19
EMCCs are responsible for alarming the out-of-hospitals
emergency resources like ambulances services (ground
and air) and primary care doctors on-call.
For all calls to an EMCC, trained nurses use The Nor-
wegian Index of Medical Emergencies (Index) [1] to
classify the medical problem into one of three different
levels of response; green, yellow and red, the latter indi-
cating immediate need of help (potentially or a manifest
life-threatening situation). When an emergency situation
is classified as red, there will be transmitted a simulta-
neous radio alarm from the EMCC to doctors on-call
and the ambulances in the relevant area.
Even though emergency medicine is considered an
important part of the health care system, little is known
about the incidence and management of medical
* Correspondence:
1
National Centre for Emergency Primary Health Care, Uni Health, Bergen,
Norway, Kalfarveien 31, 5018 Bergen, Norway
Zakariassen et al. Scandinavian Journal of Trauma, Resuscitation and Emergency Medicine 2010, 18:9
/>© 2010 Zakariassen et al; licensee BioMed Central Ltd. This is an Open Access article distributed under the terms of the Creative
Commons Attribution License ( which permits unrestricted use, distribution, and
reproduction in any medium, provided the original work is properly cited.
emergencies outside hospitals in Norway. Emergency
medicine is not a formal speciality for doctors in Norway.
Still, treatment of critically ill or injured people is defined
as emergency medicine. Earlier white papers and plans
concerning the organisation of the emergency services
underscore the lack of national statistics and scarce epide-
miological knowledge [2-4]. It has for long been antici-
pated a rate of about 10 red responses per 1 000
inhabitants per year, but this figure has not been sup-
ported by valid statistics or scientific studies [3]. Data
from a representative sample of Norwegian out-of-hours
districts showed a rate of 9 red responses per 1 000 inhabi-
tants per year, but this number was based on data from
local emergency communication centres, not EMCCs
[5,6]. A recent study from a single island municipality with
approximately 4 000 inhabitants found an incidence of 27
medical emergencies per 1 000 inhabitants per year [7].
However, the definition of an emergency was wider in this
study than the classification of a red response based on
the Index of Medical emergencies from EMCCs.
There seems to be a scarce literature with broad epi-
demiological approach to pre-hospital emergencies in
general. Most studies deal with specific emergency pro-
blems like cardiac arrest, chest pain or trauma [8-14].
One study in Norway has a wider epidemiological scope
[7]. More epidemiological knowledge is needed to make
the right decisions for policy makers and leaders of the
health care services.
To obtain representative data on the epidemiology of
medical emergencies classified as “red response” by the
EMCCs,weperformedalargeprospectivepopulation
based study.
Materials and methods
For data collection we chose and cooperated with a stra-
tegic sample of three EMCCs, located at Haugesund,
Stavanger and Innlandet hospitals, covering Rogaland,
southern part of Hordaland, Hedmark, and Oppland
counties, covering a total of 69 581 km
2
(21% of the
total area ofNorway) and 816 000 inhabitants (18% of
the total population). Data registration was performed
prospectively during a period of three months, from
October 1
st
to December 31
st
2007.
Variables
All EMCCs use a software system called Acute Medical
Information System (AMIS) to record all incoming
situations. Usage of the AMIS system results in an elec-
tronic form with registration of each incident (not the
individual patient). The AMIS form contains basic infor-
mation about the situation, the patient(s), all available
logistics (date, time registration for incoming alarm and
all alarms and electronic messages sent to the different
prehospital resources, who responded and when), and to
where the patients are transported (left at scene, home,
casualty clinic, hospital).
Based on the immediate available information, the
EMCC operator (usually a specially trained nurse) gives
the situation a clinical criteria code with a response
level based on the Index [1]. The Index is based on
ideas from the Criteria Based Dispatch system in the US
[15], and was first published in 1994. Clinical symptoms,
findings and situations are categorised into 39 chapters.
Each chapter is subdivided into a red, yellow and green
criteria based section, correlating to the appropriate
level of response. Red colour is defined as an “acute”
response, with the highest priority. Yellow colour is
defined as an “urgent” response, with a high, but lower
priority. Green colour is defined as a “non-urgent”
response, with the lowest priority.
Copies of all AMIS forms involving situations classi-
fied as red responses were sent the project manager
every second week throughout the study. The EMCCs
also sent copies of ambulance records from all red
responses which involved ground or boat ambulances.
In situations where doctors on-call or air ambulances
had been involved, copies of medical records were
requested by mail from the project manager directly to
the person or agency involved. Several reminders were
needed during collection of medical records from differ-
ent parts of the health care system and continued until
October 2008. To secure a uniform recording of the
variables in the AMIS program, a meeting between the
persons in charge of the participating EMCCs was held.
Based on information from all AMIS forms and medi-
cal records we classified the situations according to the
International Classification of Primary Care - 2 (ICPC -
2) [16]. The ICPC-2 is structured into 7 components
and 17 chapters from A to Z depending on the body
system to which the problem belongs (table 1).
Component 1 (codes -01 to -29) provides codes for
symptoms and complaints. The analyses in this study
were based on codes from the symptom component
solely. Each patient was given one code only (e.g. D01
for abdominal pain or N07 for convulsions). For further
analyses the symptom-codes were aggregated into clini-
cally connected and appropriate groups based on the
chapters from A to Z. ICPC codes were classified in
medical records from the doctors on-call. All other
ICPC codes were classified by two members of the
research team with experience in emergency medicine.
Main symptom was used for ICPC coding
Based on all available information according to The
National Committee on Aeronautics (NACA) Score
System [17], the severity of the medical problem was
classified (table 2).
The NACA score system was chosen because it is
easy to use retrospectively and the air ambulances use
Zakariassen et al. Scandinavian Journal of Trauma, Resuscitation and Emergency Medicine 2010, 18:9
/>Page 2 of 9
NACA score as a routine for their patients. The
patient’s status is classified from 0 to 7, zero indicating
no disease or injury, while seven indicates the patient
being dead. NACA score was in the analyses cate-
gorised as NACA 0-1, indicating a patient either with
no symptoms/injuries or in no need of medical treat-
ment, NACA 2-3, indicating need of medical help
where value 3 indicates need of hospitalisation, but
still not a life-threatening situation. NACA 4-6 indi-
cates potentially (4) and definitely life-threatening
medical situations (5 and 6) and NACA 7 is a dead
person. NACA scores were classified prospectively in
patients transported by air ambulance, and the scores
were found in the medical records. All other NACA
scores were classified by two members of the research
team with experience in emergency medicine. In case
of multi-patient accidents the most severely injured
patient was included from each situation.
Statistical analyses
The statistical analyses were performed using Statistical
Package for the Social Sciences (SPSS version 15). Stan-
dard univariate statistics were used to characterise the
sample. Skewed distributed data are presented as med-
ian with 25-75% percentiles. Rate is presented as num-
bers of red responses per 1 000 inhabitants per year
with a 95% confidence interval (CI). A p-value of < 0.05
was considered significant. Index categories were
merged into the five most used (A01/A02 “Uncon-
scious”,A05“Ordered mission”,A06“Inconclusive pro-
blem”,A10“Chest pain” and A34/A35 “Accidents”)and
one category containing the rest, called “All Other” in
the analyses. In the analysis of diurnal variations, NACA
scores were dichotomised to non life-threatening or life-
threatening situations. In 64 patients we were not able
to extract information on gender, patients’ whereabouts
in 82 situations and where patients where brought to in
50 situations. In 435 situations it was not possible to
decide NACA score and in 39 situations ICPC symp-
toms score.
Ethics and approvals
Approval of the study was given by the Privacy
Ombudsman for Research, Regional Committee for
Medical Research Ethics, and the Norwegian Directorate
of Health.
Results
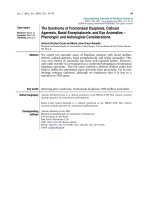
The three participating EMCC-districts collected 5 738
AMIS forms for the study, of which 633 were excluded,
due to e.g. situations not being red responses and dupli-
cates (fig 1).
Total incidence of red response situations was then 5
105 during the three month period corresponding to a
rate of 25.1 (24.4-25.7) situations per 1 000 inhabitants
per year. Innlandet had a rate of 30.6 (29.4-31.8), Sta-
vanger 20.0 (19.0-21.0) and Haugesund 22.9 (21.4-24.3)
Differences in rates between the three EMCC areas was
all statistically significant (p < 0.000). In 104 situations
the mission was aborted (no patients), six situations
concerned allocation of ambulance resources (no
patients) and 71 situations were support to other emer-
gency units (fire and police departments, no patients).
394 patients were involved in 138 accidents, resulting in
256 more patients than situations in which 77 situations
had 2 patients, 30 situations had 3 patients, and 16, 9
and 6 situations had 4, 5 and 6 or more patients, respec-
tively. The total number of patients was 5 180 which
corresponds to a rate of 25.5 (24.7-26.1) patients per 1
000 inhabitants per year. Of the 256 extra patients from
the accidents, 98% had a NACA score of 3 or lower,
one was dead. The 256 extra patients, all interrupted
missions, allocations of ambulances, and support to
Table 1 International Classification of Primary Care (ICPC)
ICPC Body system
A General and unspecified
B Blood, blood-forming organs, lymphatic, spleen
D Digestive
F Eye
H Ear
K Circulatory
L Musculoskeletal
N Neurological
P Psychological
R Respiratory
S Skin
T Endocrine, metabolic and nutritional
U Urology
W Pregnancy, childbearing, family planning
X Female genital system
Y Male genital system
Z Social problems
Table 2 National Committee on Aeronautics (NACA)
Score
level
Patient status
NACA 0 No injury or illness
NACA 1 Not acute life-threatening disease or injury
NACA 2 Acute intervention not necessary; further diagnostic
studies needed
NACA 3 Severe but not life threatening disease or injury; acute
intervention necessary
NACA 4 Development of vital (life threatening) danger possible
NACA 5 Acute vital (life threatening) danger
NACA 6 Acute cardiac or respiratory arrest
NACA 7 Death
Zakariassen et al. Scandinavian Journal of Trauma, Resuscitation and Emergency Medicine 2010, 18:9
/>Page 3 of 9
other emergency units were excluded from further sta-
tistical analyses, and the material thus consists of the
remaining 4 924 red response situations with the same
number of patients.
Demography and Index categories
The patients’ age ranged from 0 to 107 years, with a
medianageof57(33-75).Thegenderdistribution
showed 55% men with median age 55, and 45%
women with median age 58. Table 3 shows the five
most common Index categories. The mostly used
Index category was A10 “Chest pain” for both genders,
and more than 80% of the patients with chest pain
were over the age of 50. Index category A34/A35
“Accidents” constituted 12%, where 35% of the patients
were between 10 and 29 years, and males accounted
for 61%.
The incidence of red responses was higher during day-
time (0800-1529) compared to night time (2300-0759)
for most of the Index categories, except for category “all
other” which had only minor skewness around the clock
(table 4). A34/A35 “Accidents” showed the highest inci-
dence during daytime with a proportion of 45% (table 4).
A29 “Breathing difficulties” was the most used Index-
category in the “all other” group with nearly 5% of the
total. Approximately half of all patients in the youngest
age group had “all other” medical problems and convul-
sions (A23) was the most common Index category with
14% of the situations. Seven Index categories were each
used five times or less and six were not used at all.
Severity of injury and illness
NACA-score could be set in 4 489 (91%) of the 4 924
situations with patients (table 4). Males constituted
Received
AMIS-forms
5 738
Dublicates
71
Not red
response
480
Outside
catchment area
53
Search and
rescue mission
4
Medical training
exercise
25
Amis forms
included
5 105
With additional
medical records
4 551 (89% )
Without additional
medical records
554 (11% )
Figure 1 Is a flow chart of total collected, excluded and included AMIS forms.
Zakariassen et al. Scandinavian Journal of Trauma, Resuscitation and Emergency Medicine 2010, 18:9
/>Page 4 of 9
68% of the 246 patients with NACA 6-7. Patients >70
years accounted for 50% of the 1 280 patients with
potentially/manifest life-threatening medical situations
pronounced dead (NACA 4 and higher). Median age of
the dead patients was 69 (53-81).
More than 60% of the patients were in category NACA
2-3. Also a large majority of the accidents (81%) were
given NACA-score 0-3, indicating non-life threatening
situations. Considering the 166 patients that were pro-
nounced dead on arrival or resuscitated without return of
spontaneous circulation (NACA 7), 64 (39%) were given
thecodeA01/A02“Unconscious”, 37 (22%) A06 “Incon-
clusive problem”, 14 (8%) A34/A35 “Accidents”,and10
(6%) A10 “Chest pain”. The percentage of patients with
non life-threatening conditions increased from 70% at
daytime to 74% at night, while life-threatening conditions
Table 3 The most frequent used Index categories by patients’ gender, age, whereabouts and to where the patients
were brought.
A01/02
Unconscious
A05
Ordered mission*
A06
Inconclusive
problem
A10
Chest pain
A34/35
Accidents
All other
categories
Total
n% n % n% n% n% n% n%
Patients 410 8 864 18 707 14 1 098 22 565 12 1 280 26 4 924 100
Male
0-9 years 11 6 44 24 24 14 2 1 15 8 85 47 181 100
10-29 years 34 8 55 14 58 14 13 3 119 30 123 31 402 100
30-49 years 38 7 80 15 70 13 111 21 97 19 128 25 524 100
50-69 years 62 7 133 16 132 16 275 33 70 9 158 19 830 100
> 70 years 81 11 126 18 131 18 211 29 32 5 139 19 720 100
Total 226 9 438 16 415 16 612 23 333 12 633 24 2 657 100
Female
0-9 years 20 16 20 16 11 10 1 1 8 6 63 51 123 100
10-29 years 28 8 56 16 39 11 12 3 76 21 151 42 362 100
30-49 years 29 7 80 19 55 13 67 16 50 12 152 35 433 100
50-69 years 23 5 81 17 75 15 156 32 45 9 110 23 490 100
> 70 years 77 10 171 21 110 14 249 31 31 4 157 20 795 100
Total 177 8 408 19 290 13 485 22 210 9 633 29 2 203 100
Patients’ whereabouts
At home 243 9 349 12 416 15 833 30 87 3 882 31 2 810 100
Casualty clinic 4 3 115 77 3 2 17 11 1 1 10 6 150 100
Doctor’s surgery 2 1 105 54 4 2 62 32 4 2 19 9 199 100
Public area 113 9 65 6 221 19 94 8 442 37 249 21 1 184 100
Hospitals 0 0 137 87 0 0 9 6 0 0 11 7 157 100
Nursing home 22 9 64 27 34 15 51 22 2 1 60 26 233 100
Other 13 12 12 11 21 19 20 18 15 14 29 26 110 100
Total 397 8 849 18 699 15 1 086 22 551 11 1 260 26 4 842 100
Patients brought to
Casualty clinic 57 8 76 10 151 21 155 21 105 14 187 26 731 100
Hospital via casualty clinic 27 5 76 15 100 19 127 24 52 10 138 27 520 100
Directly hospital, doctor involved 107 6 544 32 145 8 424 25 159 9 337 20 1 716 100
Directly hospital, doctor not involved 102 9 87 7 175 15 274 23 175 15 364 31 1 177 100
Remained on site 42 8 55 11 82 16 100 19 43 8 200 38 522 100
Deceased 64 38 12 7 37 22 10 6 14 9 30 18 167 100
Taken care of by other 5 12 3 7 11 27 2 5 8 20 12 29 41 100
Total 404 8 853 18 701 15 1 092 22 556 11 1 268 26 4 874 100
The variables have some missing data and the total may not add up to 4 924 for all groups.
* Mission ordered by health personnel or other emergency units, i.e. transport directly to hospital or ambulance assistance to other emergency
Zakariassen et al. Scandinavian Journal of Trauma, Resuscitation and Emergency Medicine 2010, 18:9
/>Page 5 of 9