International economics 4th edition by feenstra taylor solution manual
Bạn đang xem bản rút gọn của tài liệu. Xem và tải ngay bản đầy đủ của tài liệu tại đây (8.4 MB, 248 trang )
International Economics 4th edition by Robert C. Feenstra, Alan M. Taylor
Solution Manual
Link full download test bank: />Link full download solution manual: />2.Trade and Technology: The Ricardian Model
0. In this problem you will use the World Development Indicators (WDI) database from the
World Bank to compute the comparative advantage of two countries in the major sectors of
gross domestic product (GDP): agriculture, industry (which includes manufacturing,
mining, construction, electricity, and gas), and services. Go to the WDI website at
, and choose “Online tables,” where you will be using the sections
on “People” and on the “Economy.”
a. In the “People” section, start with the table “Labor force structure.” Choose two
countries that you would like to compare, and for a recent year write down their total
labor force (in millions) and the percentage of the labor force that is female. Then
calculate the number of the labor force (in millions) who are male and the number
who are female.
Answer:
2014
Labor Force
(million)
Female Labor
(%)
Male Labor
(million)
Female Labor
(million)
France
30.1
47
15.95
14.15
Thailand
40.1
46
18.45
21.65
b. Again using the “People” section of the WDI, now go to the “Employment by sector”
table. For the same two countries that you chose in part (a) and for roughly the same year,
write down the percent of male employment and the percent of female employment in
each of the three sectors of GDP: agriculture, industry, and services. (If the data are
missing in this table for the countries that you chose in part (a), use different countries.)
Use these percentages along with your answer to part (a) to calculate the number of male
workers and the number of female workers in each sector. Add together the number of
male and female workers to get the total labor force in each sector.
Answer:
2011–2014
Agriculture
Male % Female %
Industry
Male %
Female %
Service
Male %
Female %
France
4
2
31
10
65
88
Thailand
44
39
23
18
33
43
2011–2014
(million)
Agriculture
Male Female
Industry
Male Female
Service
Male
Female
France
0.64
0.28
4.95
1.42
10.37
12.45
Thailand
8.12
8.44
4.24
3.90
6.09
9.31
c. In the “Economy” section, go to the table “Structure of output.” There you will find
GDP (in $ billions) and the % of GDP in each of the three sectors: agriculture, industry,
and services. For the same two countries and the same year that you chose in part (a),
write down their GDP (in $ billions) and the percentage of their GDP accounted for by
agriculture, by industry, and by services. Multiply GDP by the percentages to obtain the
dollar amount of GDP coming from each of these sectors, which is interpreted as the
value-added in each sector, that is, the dollar amount that is sold in each sector minus the
cost of materials (not including the cost of labor or capital) used in production.
Answer:
2014
GDP (billion $)
Agriculture (%)
Industry (%)
Service (%)
France
2829.2
2
19
79
Thailand
404.8
20
37
53
d. Using your results from parts (b) and (c), divide the GDP from each sector by the
labor force in each sector to obtain the value-added per worker in each sector. Arrange
these numbers in the same way as the “Sales/Employee” and “Bushels/Worker” shown in
Table 2-2. Then compute the absolute advantage of one country relative to the other in
each sector, as shown on the right-hand side of Table 2-2. Interpret your results. Also
compute the comparative advantage of agriculture/industry and agriculture/services (as
shown at the bottom of Table 2-2), and the comparative advantage of industry/services.
Based on your results, what should be the trade pattern of these two countries if they
were trading only with each other?
Answer:
($1000)
France
Thailand
Absolute Advantage
France/Thailand Ratio
Service
97.94
13.93
7.03
Industry
84.39
18.4
4.59
Agriculture
61.50
4.89
12.58
Agriculture/ Service
0.63
0.35
Agriculture/ Industry
0.73
0.27
Industry/Service
0.86
1.33
Comparative
Advantage
Thailand has a comparative advantage in both Service and Industry. Suppose that a farmer
spends 1,000 hours per year in agriculture production. Multiplying the marginal product of
an hour of labor in agriculture by 1,000, to obtain the marginal production of labor per year
and dividing by the marginal production of labor in Service gives us the opportunity cost of
Service. In France, this ratio is 0.63, indicating that $0.63 must be foregone to obtain an extra
dollar of sales in Agriculture. In Industry, the ratio is 0.73 in France. These ratios are much
smaller in Thailand, only 0.35 for Service and 0.27 for Industry. As a result, Thailand has a
lower opportunity cost of both Industry and Service. Therefore, if assuming the two countries
are trading only with each other, France will export Agriculture while Thailand will export
Service and Industry.
2. At the beginning of the chapter, there is a brief quotation from David Ricardo; here is a
longer version of what Ricardo wrote:
England may be so circumstanced, that to produce the cloth may require the
labour of 100 men for one year; and if she attempted to make the wine, it
might require the labour of 120 men for the same time. . . . To produce the
wine in Portugal, might require only the labour of 80 men for one year, and
to produce the cloth in the same country, might require the labour of 90 men
for the same time. It would therefore be advantageous for her to export wine
in exchange for cloth. This exchange might even take
place, notwithstanding that the commodity imported by Portugal could
be produced there with less labour than in England.
Suppose that the amount of labor Ricardo describes can produce 1,000
yards of cloth or 2,000 bottles of wine in either country. Then answer the
following:
a. What is England’s marginal product of labor in cloth and in wine, and what is
Portugal’s marginal product of labor in cloth and in wine? Which country has
absolute advantage in cloth, and in wine, and why? Answer: In England, 100 men
produce 1,000 yards of cloth, so MPLC = 1,000/100 = 10. 120 men produce 2,000
bottles of wine, so MPLW = 2,000/120 =16.6. In Portugal, 90 men produce 1,000
yards of cloth, so MPL*C = 1,000/90 = 11.1. Eighty (80) men produce 2,000 bottles
of wine, so MPL*w = 2,000/80 = 25. So Portugal has an absolute advantage in both
cloth and wine, because it has higher marginal products of labor in both industries
than does England.
b. Use the formula PW/PC = MPLC/MPLW to compute the no-trade relative price of
wine in each country. Which country has comparative advantage in wine, and why?
Answer: For England, PW/PC = MPLC/MPLW = 10/16.6 = 0.6, which is the notrade relative price of wine (equal to the opportunity cost of producing wine). So the
opportunity cost of wine in terms of cloth is 0.6, meaning that to produce 1 bottle of
wine in England, the country gives up 0.6 yards of cloth. For Portugal, PW*/PC*=
MPLC*/MPLW* = 11.1/25 = 0.4, which is the no-trade relative price of wine (equal to
the opportunity cost of producing wine). The no-trade relative price of wine is lower
in Portugal, so Portugal has comparative advantage in wine, and England has
comparative advantage in cloth. Portugal has comparative advantage in producing
wine because it has lower opportunity cost (PW*/PC*= 0.4) than England in the
production of wine (PW/PC = 0.6).
3. Suppose that each worker in Home can produce two cars or three TVs. Assume
that Home has four workers.
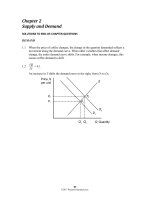
a. Graph the production possibilities frontier for
Home. Answer: See the following figure.
b. What is the no-trade relative price of cars in Home?
Answer: The no-trade relative price of cars at Home is PC/PTV = 3/2 =
MPLTV/MPC. It is the slope of the PPF curve for Home.
4. Suppose that each worker in Foreign can produce three cars or two TVs. Assume
that Foreign also has four workers.
a. Graph the production possibilities frontier for
Foreign. Answer: See following figure.
b. What is the no-trade relative price of cars in Foreign?
Answer: The no-trade relative price of cars in Foreign is P*C/P*TV = 2/3 =
c. Using the information provided in Problem 3 regarding Home, in which good does
Foreign have a comparative advantage, and why?
Answer: Foreign has a comparative advantage in producing televisions because it
has a lower opportunity cost than Home in the production of televisions.
5. Suppose that in the absence of trade, Home consumes two cars and nine TVs, while
Foreign consumes nine cars and two TVs. Add the indifference curve for each
country to the figures in Problems 3 and 4. Label the production possibilities
frontier (PPF), indifference curve (U1), and the no-trade equilibrium consumption
and production for each country.
Answer: See following figures.
6. Now suppose the world relative price of cars is PC/PTV = 1.
a. In what good will each country specialize? Briefly explain why.
Answer: Home would specialize in TVs, export TVs, and import cars,
whereas the Foreign country would specialize in cars, export cars, and import
TVs. The reason is because Home has a comparative advantage in TVs and
Foreign has a comparative advantage in cars.
b. Graph the new world price line for each country in the figures in Problem 5, and
add a new indifference curve (U2) for each country in the trade equilibrium.
Answer: See the following figures.
c. Label the exports and imports for each country. How does the amount of Home
exports compare with Foreign imports?
Answer: See graph in part (b). The amount of Home TV exports is equal to the
amount of Foreign TV imports. In addition, Home imports of cars equal Foreign
exports of cars. This is balanced trade, which is an essential feature of the
Ricardian model.
d. Does each country gain from trade? Briefly explain why or why not. Answer:
Both Home and Foreign benefit from trade relative to their no-trade
consumption because their utilities are both higher (consumption bundles
located on higher indifference curves).
Work It Out
Answer the following questions using the information given by the accompanying
table.
Number of bicycles
produced per hour
Home
4
Foreign
6
Number of snowboards
produced per hour
6
8
Comparative Advantage
?
?
Absolute Advantage
?
?
a. Complete the table for this problem in the same manner as Table 2-2.
Answer: See previous table.
b. Which country has an absolute advantage in the production of bicycles?
Which country has an absolute advantage in the production of snowboards?
Answer: Foreign has an absolute advantage in both production of bicycles
and snowboards, because it is able to produce more in an hour than Home.
c. What is the opportunity cost of bicycles in terms of snowboards in Home? What
is the opportunity cost of bicycles in terms of snowboards in Foreign?
Answer: The opportunity cost of one bicycle is 3/2 snowboards at Home (PB/PS =
MPLS/MPLB = 6/4 = 3/2). The opportunity cost of one bicycle is 4/3 snowboards
in the Foreign country (PB*/PS* = MPLS*/MPLB* = 8/6 = 4/3).
d. Which product will Home export, and which product does Foreign export? Briefly
explain why.
Answer: The opportunity cost of one bicycle is 3/2 snowboards at Home (PB/PS =
MPLS/MPLB = 6/4 = 3/2). The opportunity cost of one bicycle is 4/3 snowboards
in the Foreign country (PB*/PS* = MPLS*/MPLB* = 8/6 = 4/3). Home has a
smaller opportunity cost producing snowboards than the Foreign country. Home
will export snowboards and Foreign will export bicycles.
7. Assume that Home and Foreign produce two goods, TVs and cars, and use
the information below to answer the following questions:
In the No-Trade equilibrium:
Home
Foreign
WageTV = 12
WageC = ?
Wage*TV = ?
Wage*C = 6
MPLTV = 4
MPLC = ?
MPL*TV = ?
MPL*C = 1
PTV = ?
PC = 4
P*TV = 8
P*C = ?
a. What is the marginal product of labor for TVs and cars in Home? What is the notrade relative price of TVs in Home?
Answer: MPLC = 3, MPLTV = 4, and PTV/PC = MPLC /MPLTV = 3/4
b. What is the marginal product of labor for TVs and cars in Foreign? What is the
no-trade relative price of TVs in Foreign?
Answer: MPL*C = 1, MPL*TV = 3/4, and P*TV/P*C = MPL*C/MPL*TV = 4/3
c. Suppose the world relative price of TVs in the trade equilibrium is PTV/PC =
1. Which good will each country export? Briefly explain why.
Answer: Home will export TVs and Foreign will export cars
because Home has a comparative advantage in TVs whereas
Foreign has a comparative advantage in car. Each country
will specialize in the goods with lower opportunity cost.
d. In the trade equilibrium, what is the real wage in Home in terms of cars and in
terms of TVs? How do these values compare with the real wage in terms of
either good in the no-trade equilibrium?
Answer: Workers at Home are paid in terms of TVs because Home exports TVs.
Home is better off with trade because its real wage in terms of cars has increased.
MPLTV = 4 units of TV
or
Home wages with trade=
(PTV /PC ) MPLTV = (1) 4 = 4 units of car
MPLTV = 4 units of TV
or
/P ) MPL = (3/4) 4 = 3 units of car
Home wages w/o trade=
(P
TV
C
TV
e. In the trade equilibrium, what is the real wage in Foreign in terms of TVs and in
terms of cars? How do these values compare with the real wage in terms of either
good in the no-trade equilibrium?
Answer: Foreign workers are paid in terms of cars because Foreign exports cars.
Foreign gains in terms of cars with trade.
(P /P ) MPL* = (1) 1 = 1 units of TV
C
TV
C
or
Foreign wages with trade= MPL* = 1 units of car
C
(P* /P* ) MPL* = (3/4) 1 = 3/4 unit of TV
C
TV
C
or
Foreign wages w/o trade= MPL* = 1 units of car
C
f. In the trade equilibrium, do Foreign’s workers earn more or less than Home’s
workers, measured in terms of their ability to purchase goods? Explain why.
Answer: Foreign workers earn less than workers at Home in terms of cars
because Home has an absolute advantage in the production of cars. Home workers
also earn more than Foreign workers in terms of TVs
8. Why do some low-wage countries, such as China, pose a threat to manufacturers
in industrial countries, such as the United States, whereas other low-wage
countries, such as Haiti, do not?
Answer: To engage in international trade, a country must have a minimal threshold
of productivity. Countries such as China have the productivity necessary to compete
successfully, but Haiti does not. China can enter the world market because it beats
other industrial countries with a lower price. Under perfect competition, price is
determined by both wage rate and productivity; that is, P = Wage/MPL. So the lower
price in China comes from both a low wage rate and high MPL. Haiti has a low wage
rate, but also low MPL. So Haiti’s price is not low enough to enter the world market.
Answer Problems 9 to 11 using the chapter information for Home and Foreign.
9. a. Suppose that the number of workers doubles in Home. What happens to the Home
PPF and what happens to the no-trade relative price of wheat?
Answer: With the doubling of the number of workers in Home, it can now
produce 200 = 4 · 50 bushels of wheat if it concentrates all resources in the
production of wheat, or it could produce 100 = 2 · 50 yards of cloth by devoting
all resources to the production of cloth. The PPF shifts out for both wheat and
cloth. The no-trade relative price of wheat remains the same because both MPLW
and MPLC are unchanged.
b. Suppose that there is technological progress in the wheat industry such that
Home can produce more wheat with the same amount of labor. What happens to
the Home PPF and what happens to the relative price of wheat? Describe what
would happen if a similar change occurred in the cloth industry.
Answer: Because the technological progress is only in the wheat industry,
Home’s production of cloth remains the same if it devotes all of its resources to
producing cloth. If instead Home produces only wheat, it is able to produce
more wheat using the same amount of labor. Home’s PPF shifts out in the
direction of wheat production. Recall that the relative price of wheat is given by
PW/PC = MPLC/MPL W. With the technological progress in wheat, the marginal
product of labor in the wheat production increases. Thus, the relative price of
wheat decreases. As shown in the graph, the relative price of wheat drops from
1/2 to 1/4.
If instead the technological progress is in the cloth industry, we would have the
opposite results. Home’s PPF would shift out in the direction of cloth
production and the relative price of wheat would increase.
10. a. Using Figure 2-5, show2 that an increase in the relative price of wheat from its world relative
price of 3 will raise Home’s utility.
Answer: The increase in the relative price of wheat from its international
equilibrium of 2/3 allows Home to consume at a higher utility, such as at point D.
b.
Using Figure 2-6, show2 that an increase in the relative price of wheat from its world relative price
of 3will lower Foreign’s utility. What is Foreign’s utility when the world relative price reaches 1,
and what happens in Foreign when the world relative price of wheat rises above that level?
Answer:2 The increase in the relative price of wheat from its international equilibrium of 3 lowers
Foreign’s utility to U*3 with consumption at D*. When the
international price reaches 1, it becomes the same as Foreign’s no-trade relative price of
wheat. Thus, Foreign consumes at point A*, the no-trade equilibrium. If the
international price rises above 1, then it would be greater than Foreign’s no-trade
relative price of wheat. In this case, Foreign would switch to exporting wheat instead of
exporting cloth. The world price line now moves inside the PPF, which will lower the
no trade relative price of wheat.
11. (This is a harder question.) Suppose that Home is much larger than Foreign. For example, suppose we
double the number of workers in Home from 25 to 50. Then, suppose that 1 Home is willing to export
up to 100 bushels of wheat at its no-trade price of PW/PC = 2, rather than 50 bushels of wheat as shown
in Figure 2-11. In the following figure, we draw a new version of Figure 2-11, with the larger Home.
a.
From this figure, what is the new world relative price of wheat (at point D)? Answer: The
intersection of the Foreign imports and Home 1 exports gives the new international equilibrium
relative price of wheat, which is 2.
b.
Using this new world equilibrium price, draw a new version of the trade equilibrium in Home
and in Foreign, and show the production point and consumption point in each country. 1
Answer: The international price of 2 is the same as Home’s no-trade relative price of
wheat. Home would consume at point A and produce at point B´. The difference
between these two points gives Home exports of wheat of 80 units. (Notice that
workers earn equal wages in the two industries, so production can occur anywhere
along the PPF.)
Because the international price of 1/2 is lower than Foreign’s no-trade relative
price of wheat, Foreign is able to consume at point D*, which gives higher
gains from trade than at point C*.
c. Are there gains from trade in both countries? Explain why or why not.
Answer: The Foreign country gains a lot from trade, but the home country neither
gains nor loses: Its consumption point A is exactly the same as what it would be
in the absence of trade. This shows that in the Ricardian model, a small country
can gain the most from trade, whereas a large country may not gain (although it
will not lose) because the world relative price might equal its own no-trade
relative price. So the large country does not see a terms of trade (TOT) gain. This
special result will not arise in other models that we study, but illustrates how
being small can help a country on world markets!
12. Using the results from Problem 11, explain why the Ricardian model predicts that
Mexico would gain more than the United States when the two countries signed
the North American Free Trade Agreement, establishing free trade between them.
Answer: The Ricardian model predicts that Mexico would gain more than the United
States when the two countries join the regional trade agreement because relative to
the United States in terms of economic size, Mexico is a small country. For the
United States, the world price of its exports is similar to the domestic price. Thus,
there is not much TOT gain. But for Mexico, the world price is much higher than the
domestic price of its exports, so Mexico sees a big TOT improvement.
2 (13) Introduction to Exchange Rates and the Foreign Exchange Market
1. Discovering Data Not all pegs are created equal! In this question you will explore
trends in exchange rates. Go to the St. Louis Federal Reserve’s Economic Data (FRED)
website at and download the daily United States
exchange rates with Venezuela, India, and Hong Kong from 1990 to present. These can
be found most easily by searching for the country names and “daily exchange rate.”
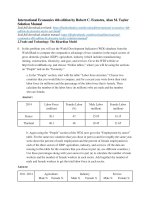
a. Plot the Indian rupee to U.S. dollar exchange rate over this period. For what years
does the rupee appear to be pegged to the dollar? Does this peg break? If so, how
many times?
Answer: The rupee appears to be pegged to the U.S. dollar at various rates from 1991
until about 1998 with intermittent volatility at places the peg appears to break. There
are four distinct rates at which this peg remains, the longest of which lasting over two
years from 1993 until mid 1995.
80.0000
70.0000
60.0000
50.0000
40.0000
30.0000
20.0000
10.0000
-01-02
-01-02
-01-02
-01-02
-01-02
-01-02
-01-02
-01-02
-01-02
-01-02
-01-02
-01-02
-01-02
-01-02
-01-02
-01-02
-01-02
-01-02
-01-02
-01-02
-01-02
-01-02
-01-02
-01-02
-01-02
-01-02
-01-02
0.0000
b. How would you characterize the relationship between the rupee and the dollar from
1998–2008? Does it appear to be fixed, crawling, or floating during this period? How
would you characterize it from 2008 onward?
Answer: Over this period the exchange rate appears to be a crawling peg. Although
this crawl is relatively flat for a few years at the beginning of this period, it appears
free to move. However, the lack of short -term volatility suggests that the exchange
rate is still being controlled and is hence crawling. From 2008 onward this appears to
be a freely floating currency. The line becomes more erratic with a greater deal of
short-term volatility.
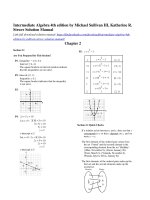
c. The Hong Kong dollar has maintained its peg with the United States dollar since
1983. Over the course of the period that you have downloaded what are the highest
and lowest values for this exchange rate?
Answer: This peg has never broken over this period (although there is some
movement if you allow the axis to be small enough) . The highest rate that it has
attained is 7.8289 Hong Kong dollars per US dollar on August 6, 2007, at the height
of the financial crisis. The lowest it has gone is 7.7085 on October 6, 2003.
9.0000
8.8000
8.6000
8.4000
8.2000
8.0000
7.8000
7.6000
7.4000
7.2000
-01-02
-01-02
-01-02
-01-02
-01-02
-01-02
-01-02
-01-02
-01-02
-01-02
-01-02
-01-02
-01-02
-01- 02
-01- 02
-01- 02
-01- 02
-01-02
-01-02
-01-02
-01-02
-01-02
-01-02
-01-02
-01-02
-01-02
-01-02
7.0000
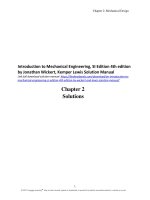
d. Venezuela has been less successful in its attempts to fix against the dollar. Since
1995 how many times has the Venezuelan bolívar peg to the dollar broken? What is
the average length of a peg? What is the average size of a devaluation?
Answer: I count seven breaks in this peg over this period. In 1998 they appear to
move to a slow and managed crawl before floating for a short time and returning to a
fixed rate. The longest period of any one peg appears to be when the exchange rate
was set at 2.14 bolívar/dollar for about five years between 2005 and 2010.
12
10
8
6
4
2
0
2. Refer to the exchange rates given in the following table:
Country (currency)
Australia (dollar)
Canada (dollar)
Denmark (krone)
Eurozone (euro)
Hong Kong (dollar)
India (rupee)
Japan (yen)
Mexico (peso)
Sweden (krona)
United Kingdom (pound)
United States (dollar)
January 20, 2016
January 20, 2015
FX per $
FX per £ FX per € FX per $
1.459
2.067
1.414
1.223
1.451
2.056
1.398
1.209
6.844
9.694
7.434
6.430
0.917
1.299
1.000
0.865
7.827
11.086
8.962
7.752
68.05
96.39
71.60
61.64
116.38
164.84
136.97
118.48
18.60
26.346
16.933
14.647
8.583
12.157
9.458
8.181
0.706
1.000
0.763
0.600
1.000
1.416
1.156
1.000
Data from: U.S. Federal Reserve Board of Governors, H.10 release: Foreign
Exchange Rates.
Based on the table provided, answer the following questions:
a. Compute the U.S. dollar–yen exchange rate E$/¥ and the U.S. dollar–Canadian
dollar exchange rate E$/C$ on January 20, 2016, and January 20, 2015.
Answer:
U.S. dollar–yen rates:
January 20, 2015: E$/¥ = 1/(118.48) = $0.0084/¥
January 20, 2016: E$/¥ = 1/(116.38) = $0.0086/¥
January 20, 2015: E$/C$ = 1/(1.209) = $0.8271/C$
January 20, 2016: E$/C$ = 1/(1.451) = $0.6892/C$
b. What happened to the value of the U.S. dollar relative to the Japanese yen and
Canadian dollar between January 20, 2015, and January 20, 2016? Compute the
percentage change in the value of the U.S. dollar relative to each currency
using the U.S. dollar–foreign currency exchange rates you computed in (a).
Answer: Between January 20, 2015, and January 20, 2016, the Japanese yen
appreciated, and the Canadian dollar depreciated relative to the U.S. dollar.
The percentage appreciation of the yen relative to the U.S. dollar is:
%∆E$/¥ = ($0.0086 − $0.0084)/$0.0084 = 2.38%
The percentage depreciation of the Canadian dollar relative to the U.S. dollar is:
%∆E$/C$ = ($0.6892 − $0.8271)/$0.8271 = -16.67%
c. Using the information in the table for January 20, 2016, compute the Danish
krone–Canadian dollar exchange rate Ekrone/C$.
Answer: Ekrone/C$ = (6.844 kr/$)/(1.451 C$/$) = 4.7167 kr/C$.
d. Visit the website of the Board of Governors of the Federal Reserve System at
Click on “Economic Research and Data” and
then “Data Download Program (DDP)” Download the H.10 release Foreign
Exchange Rates (weekly data available). What has happened to the value of the
U.S. dollar relative to the Canadian dollar, Japanese yen, and Danish krone since
January 20, 2016?
Answer: Answers will depend on the latest data update.
Based on the foreign exchange rates (H.10) released on March 20, 2017, the
exchange rate for the Canadian dollar, yen, and krone was 1.3366, 112.67, and
6.9207, respectively. Thus, while the Canadian dollar–U.S. dollar and the yen–
dollar exchange rates have depreciated by about 7.88% and 3.19%, respectively.
The krone has appreciated by about 1.12%.
e. Using the information from (d), what has happened to the value of the U.S. dollar
relative to the British pound and the euro? Note: The H.10 release quotes these
exchange rates as U.S. dollars per unit of foreign currency in line with longstanding market conventions.
Answer: Answers will depend on the latest data update.
Based on the foreign exchange rates (H.10) released on March 20, 2017, the U.K.
pound–U.S. dollar and euro–U.S. dollar rates were 0.808 and 0.931, respectively.
Thus, relative to the U.S. dollar, the pound appreciated by 14.45% and the euro
appreciated by 1.53%.
3. Consider the United States and the countries it trades with the most (measured in
trade volume): Canada, Mexico, China, and Japan. For simplicity, assume these
are the only four countries with which the United States trades. Trade shares (trade
weights) and U.S. nominal exchange rates for these four countries are as follows:
Country (currency)
Canada (dollar)
Mexico (peso)
China (yuan)
Japan (yen)
Share of Trade
36%
28%
20%
16%
$ per FX in 2015
0.8271
0.0683
0.1608
0.0080
$ per FX in 2016
0.6892
0.0538
0.1522
0.0086
a. Compute the percentage change from 2015 to 2016 in the four U.S. bilateral
exchange rates (defined as U.S. dollars per unit of foreign exchange, or FX) in
the table provided.
Answer:
%∆E$/C$ = (0.6892 − 0.8271)/0.8271 = −16.67%
%∆E$/pesos = (0.0538 − 0.0683)/0.0683 = −21.23%
%∆E$/yuan = (0.1522 − 0.1608)/0.1608 = −5.35%
%∆E$/¥ = (0.0086 − 0.008/0.008 = 7.50%
b. Use the trade shares as weights to compute the percentage change in the
nominal effective exchange rate for the United States between 2015 and 2016
(in U.S. dollars per foreign currency basket).
Answer: The trade-weighted percentage change in the exchange rate is:
%∆E = 0.36(%∆E$/C$) + 0.28(%∆E$/pesos) + 0.20(%∆E$/yuan) + 0.16(%∆E$/¥)
%∆E = 0.36(−16.67 %) + 0.28(−21.23%) + 0.20(−5.35%) + 0.16(7.50%) = −11.82%
c. Based on your answer to (b), what happened to the value of the U.S. dollar against
this basket between 2015 and 2016? How does this compare with the change in
the value of the U.S. dollar relative to the Mexican peso? Explain your answer.
Answer: The dollar appreciated by 11.82% against the basket of currencies. Visà-vis the peso, the dollar appreciated by 21.23%. The average depreciation is
smaller because the dollar depreciated by only 5.35% against China with a 20%
trade share and appreciated against the yen with a 16% trade share.
4. Go to the FRED website: Locate the monthly
exchange rate data for the following:
Look at the graphs and make your own judgment as to whether each currency was
fixed (peg or band), crawling (peg or band), or floating relative to the U.S. dollar
during each time frame given.
a. Canada (dollar), 1980–2012
Answer: Floating exchange rate
b. China (yuan), 1999–2004, 2005–09, and 2009–10
Answer: 1999–2004: fixed exchange rate; 2005–09: gradual appreciation vis-àvis the dollar; again fixed for 2009–10
c. Mexico (peso), 1993–95 and 1995–2012
Answer: 1993–95: crawl; 1995–2012: floating (with some evidence of a managed
float)
d. Thailand (baht), 1986–97 and 1997–2012
Answer: 1986–97: fixed exchange rate; 1997–2012: floating
e. Venezuela (bolívar), 2003–12
Answer: fixed exchange rate (with occasional adjustments)
5. Describe the different ways in which the government may intervene in the forex
market. Why does the government have the ability to intervene in this way, while
private actors do not?
Answer: The government may participate in the forex market in a number of
ways: capital controls, establishing an official market (with fixed rates) for forex
transactions, and forex intervention by buying and selling currencies in the forex
markets. The government has the ability to intervene in a way that private actors do
not because through its central bank it has unlimited stock of its own currency and
usually a large stock of foreign reserves. Its intervention is guided by policy rather
than merely making profits on currency trade, which is the case with the private
sector.
Work it out. Consider a Dutch investor with 1,000 euros to place in a bank deposit in
either the Netherlands or Great Britain. The (one-year) interest rate on bank deposits
is 1% in Britain and 5% in the Netherlands. The (one-year) forward euro–pound
exchange rate is 1.65 euros per pound and the spot rate is 1.5 euros per pound.
Answer the following questions, using the exact equations for uncovered interest
parity (UIP) and covered interest parity (CIP) as necessary.
a. What is the euro-denominated return on Dutch deposits for this investor?
Answer: The investor’s return on euro-denominated Dutch deposits is equal
to €1,050 = €1,000 × (1 + 0.05).
b. What is the (riskless) euro-denominated return on British deposits for this investor
using forward cover?
Answer: The euro-denominated return on British deposits using forward cover is
equal to €1,111 (= €1,000 × (1.65/1.5) × (1 + 0.01)).
c. Is there an arbitrage opportunity here? Explain why or why not. Is this an
equilibrium in the forward exchange rate market?
Answer: Yes, there is an arbitrage opportunity. The euro-denominated return on
British deposits is higher than that on Dutch deposits. The net return on each
euro deposit in a Dutch bank is equal to 5% versus 11.1% (= (1.65/1.5) × (1 +
0.01)) on a British deposit (using forward cover). This is not an equilibrium in
the forward exchange market. The actions of traders seeking to exploit the
arbitrage opportunity will cause the spot and forward rates to change.
d. If the spot rate is 1.5 euros per pound, and interest rates are as stated previously,
what is the equilibrium forward rate, according to CIP?
Answer: CIP implies F€/£ = E€/£ (1 + i€)/(1 + i£) = 1.65 × 1.05/1.01 = €1.72 per £.
e. Suppose the forward rate takes the value given by your answer to (d). Compute
the forward premium on the British pound for the Dutch investor (where
exchange rates are in euros per pound). Is it positive or negative? Why do
investors require this premium/discount in equilibrium?
Answer: Forward premium = (F€/£/E€/£ − 1) = (1.72/1.50) − 1 = 0.1467 or
14.67%. The existence of a positive forward premium would imply that
investors expect the euro to depreciate relative to the British pound. Therefore,
when establishing forward contracts, the forward rate is higher than the current
spot rate.
f. If UIP holds, what is the expected depreciation of the euro (against the pound)
over one year?
Answer: If UIP holds, the expected euro–pound exchange rate is the same as the
forward rate, that is, € 1.72 per £ (see part (d) above). The expected depreciation
of Euro against pound is therefore 14.67%.
g. Based on your answer to (f), what is the expected euro–pound exchange rate
one year ahead?
Answer: Following the answer to parts (d) and (f), the expected euro–pound
exchange rate is €1.72 per £ or 1/1.72 = 0.5814 £/€.
6. Suppose quotes for the dollar–euro exchange rate E$/€ are as follows: in New York
$1.05 per euro, and in Tokyo $1.15 per euro. Describe how investors use arbitrage to
take advantage of the difference in exchange rates. Explain how this process will
affect the dollar price of the euro in New York and Tokyo.
Answer: Investors will buy euros in New York at a price of $1.05 each because this
is relatively cheaper than the price in Tokyo. They will then sell these euros in Tokyo
at a price of $1.15, earning a $0.10 profit on each euro. With the influx of buyers in
New York, the price of euros in New York will increase. With the influx of traders
selling euros in Tokyo, the price of euros in Tokyo will decrease. This price
adjustment continues until the exchange rates are equal in both markets.
7. You are a financial adviser to a U.S. corporation that expects to receive a payment
of 60 million Japanese yen in 180 days for goods exported to Japan. The current spot
rate is 100 yen per U.S. dollar (E$/¥ = 0.01000). You are concerned that the U.S.
dollar is going to appreciate against the yen over the next six months.
a. Assuming the exchange rate remains unchanged, how much does your firm expect
to receive in U.S. dollars?
Answer: The firm expects to receive $600,000 (= ¥60,000,000/100).