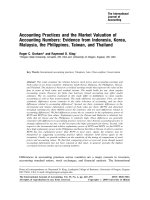
R17 equity market valuation
Bạn đang xem bản rút gọn của tài liệu. Xem và tải ngay bản đầy đủ của tài liệu tại đây (481.89 KB, 27 trang )
Reading 17
Equity Market Valuation
www.irfanullah.co
Graphs, charts, tables, examples, and figures are copyright 2014, CFA Institute. Reproduced
and republished with permission from CFA Institute. All rights reserved.
Introduction
• Estimating a Justified P/E Ratio
• Top-Down and Bottom Up Forecasting
• Relative Value Models
www.irfanullah.co
2
2. Estimating a Justified P/E Ratio
2.1 Neoclassical Approach to Growth Accounting
2.2 The China Economic Experience
2.3 Quantifying China’s Future Economic Growth
2.4 Equity Market Valuation
www.irfanullah.co
3
2.1 Neoclassical Approach to Growth Accounting
To estimate equity valuation we need to estimate earnings growth rate
Assume earnings grow at the same rate as output (GDP)
Growth rate of GDP can be estimated using the Cobb-Douglas function
Y = A f(K, L)
output elasticity
=
www.irfanullah.co
4
2.2 The China Economic Experience
www.irfanullah.co
5
www.irfanullah.co
6
2.3 Quantifying China’s Future Economic Growth
Estimating growth rates given elasticities, growth in TFP, growth in capital stock and growth
in labor input
www.irfanullah.co
7
2.4 Equity Market Valuation
• Translate macroeconomic forecasts into corporate cash flow forecasts
• H-model
• For emerging markets H-Model is useful: High initial growth which tapers
down
www.irfanullah.co
8
Example 2. The S&P China BMI Index on 30 September 2009 is 358. Forecasted 12-month
earnings per share for the composite are 18.00 RMB, and the current annual dividend rate
for the composite is 7.90 RMB. Assuming an 8.0 percent inflation-adjusted equity discount
rate, a 30-year decline in dividend growth rates from an initial growth rate of 8.25 percent,
and a terminal sustainable growth rate to perpetuity of 4.25 percent, compute the composite
index price level implied by the H-Model. Computed the justified p/e implied by such price
level.
www.irfanullah.co
9
www.irfanullah.co
10
www.irfanullah.co
11
DDM and Macroeconomic Forecasts
•
•
•
•
•
Quality of data
Subjectivity of estimates
Will company growth rates track GDP growth rate?
Hyperinflation
Currency instability
www.irfanullah.co
12
3. Top-Down and Bottom-Up Forecasting
Top Down
www.irfanullah.co
13
www.irfanullah.co
14
Using Both Forecasting Types
Example 4 shows which forecasting approach is suitable for what situation
At times can use both methods
Bottom up method generally gives inflated estimates
However, bottom up approach can help identify potential issues with ‘too
big to fail’ financial institutions
• Bottom up forecasts depend on consensus earnings estimates… hence more
optimistic than top-down heading into a recession and more pessimistic
when coming out
• Read examples 5, 6 and 7
•
•
•
•
www.irfanullah.co
15
4. Relative Value Models
Model
Description
Fed Model
Compare S&P500 forward earnings yield and 10-year Treasury yield
Yardeni Model
E1/P0 = yB - d x LTEG
P/10-year MA (E)
Tobin’s q and
equity q
www.irfanullah.co
16
Fed Model: Compares S&P500 forward earnings yield and 10year Treasury yield
Example 10. S&P 500 forward earnings yield is 5% and 10-year T-note yield is 4.6%. Are
stocks overvalued or undervalued?
Equities undervalued!
www.irfanullah.co
17
Fed Model: Compares S&P500 forward earnings yield and 10-year
Treasury yield
www.irfanullah.co
18
Yardeni Model
E1/P0 = yB - d x LTEG
yB is yield on A-Rated corporate bonds
d is weighting factor measuring importance market assigns to earnings projections
www.irfanullah.co
19
Example 12
With d = 0.05, equities are overvalued
www.irfanullah.co
20
www.irfanullah.co
21
Yardeni Model
www.irfanullah.co
22
P/10-year MA (E)
10 year moving average price earning ratio
Example 13
www.irfanullah.co
23
P/10-year MA (E)
www.irfanullah.co
24
Tobin’s q
Tobin’s q = market value of company/ replacement cost of assets
Equity q = market value of equity/ net worth of assets (based on replacement cost)
www.irfanullah.co
25