phân tích tài chính doanh nghiệp equity analysis and valuation
Bạn đang xem bản rút gọn của tài liệu. Xem và tải ngay bản đầy đủ của tài liệu tại đây (870.47 KB, 39 trang )
McGraw-Hill/Irwin
Copyright © 2009 by The McGraw-Hill Companies, Inc. All rights reserved.
Financial
Statement
Analysis
K R Subramanyam
John J Wild
11-2
11
CHAPTER
Equity Analysis and Valuation
11-3
Earnings Persistence
•
Earnings persistence is a key to effective equity
analysis and valuation
•
Analyzing earnings persistence is a main
analysis objective
•
Attributes of earnings persistence include:
–
Stability
–
Predictability
–
Variability
–
Trend
–
Earnings management
–
Accounting methods
Analyze
11-4
Earnings Persistence
•
Two common methods to help assess earnings
persistence:
–
Recasting of income statement
–
Adjusting of income statement
•
Recasting and adjusting earnings
aids in determining the earning power.
Recasting and Adjusting
11-5
Earnings Persistence
•
Information for Recasting and Adjusting
–
Income statement, including its subdivisions:
•
Income from continuing operations
•
Income from discontinued operations
•
Extraordinary gains and losses
•
Cumulative effect of changes in accounting principles
–
Other financial statements and notes
–
Management’s Discussion and Analysis
–
Others: product-mix changes, technological innovations, work
stoppages, and raw material constraints
Recasting and Adjusting
11-6
Earnings Persistence
•
Aims at rearranging earnings components to provide a
meaningful classification and relevant format for analysis.
–
Components can be rearranged, subdivided, or tax effected, but
the total must reconcile to net income of each period.
–
Discretionary expenses, components like equity in income (loss)
of unconsolidated subsidiaries or affiliates should be
segregated.
–
Components reported pretax must be removed along with their
tax effects if reclassified apart from income from continuing
operations.
Recasting Earnings and Earnings Components
11-7
Earnings Persistence
–
Income tax disclosures enable one to separate
factors that either reduce or increase taxes such as:
•
Deductions—tax credits, capital gains rates, tax-free income,
lower foreign tax rates
•
Additions—additional foreign taxes, nontax-deductible
expenses, and state and local taxes (net of federal tax
benefit)
–
Immaterial items can be considered in a lump sum
labeled other.
Recasting Earnings and Earnings Components
11-8
Earnings Persistence
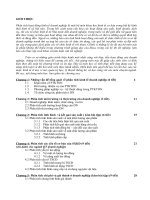
Recasting Earnings and Earnings Components
Campbell Soup Company
Recast Income Statements ($ mil.)
Item Year 11 Year 10 Year 9 Year 8 Year 7 Year 6
13 Net sales $ 6,204.1 $ 6,205.8 $ 5,672.1 $ 4,868.9 $ 4,490.4 $ 4,286.8
19 Interest income 26.0 17.6 38.3 33.2 29.5 27.4
Total revenue $ 6,230.1 $ 6,223.4 $ 5,710.4 $ 4,902.1 $ 4,519.9 $ 4,314.2
Costs and expenses:
Cost of products sold (see Note 1 below) $ 3,727.1 $ 3,893.5 $ 3,651.8 $ 3,077.8 $ 2,897.8 $ 2,820.5
Marketing and selling expenses (see Note 2 below) 760.8 760.1 605.9 514.2 422.7 363.0
145 Advertising (see Note 2 below) 195.4 220.4 212.9 219.1 203.5 181.4
144 Repairs and maintenance (see Note 1 below) 173.9 180.6 173.9 155.6 148.8 144.0
16 Administrative expenses 306.7 290.7 252.1 232.6 213.9 195.9
17 Research and development expenses 56.3 53.7 47.7 46.9 44.8 42.2
102 Stock pricerelated incentive programs (see Note 3 below)
15.4 (0.1) 17.4 (2.7) — 8.5
20 Foreign exchange adjustment 0.8 3.3 19.3 16.6 4.8 0.7
104 Other, net (see Note 3 below) (3.3) (2.0) (1.4) (4.7) (0.4) (9.0)
162A Depreciation (see Note 1 below) 194.5 184.1 175.9 162.0 139.0 120.8
103 Amortization of intangible and other assets (see Note 3 below)
14.1 16.8 16.4 8.9 5.6 6.0
18 Interest expense 116.2 111.6 94.1 53.9 51.7 56.0
Total costs and expenses $ 5,557.9 $ 5,712.7 $ 5,266.0 $ 4,480.2 $ 4,132.2 $ 3,930.0
23 Earnings before equity in earnings of affiliates & min. interests
$ 672.2 $ 510.7 $ 444.4 $ 421.9 $ 387.7 $ 384.2
24 Equity in earnings of affiliates 2.4 13.5 10.4 6.3 15.1 4.3
25 Minority interests (7.2) (5.7) (5.3) (6.3) (4.7) (3.9)
26 Income before taxes $ 667.4 $ 518.5 $ 449.5 $ 421.9 $ 398.1 $ 384.6
Income taxes at statutory rate* (226.9) (176.3) (152.8) (143.5) (179.1) (176.9)
Income from continuing operations $ 440.5 $ 342.2 $ 296.7 $ 278.4 $ 219.0 $ 207.7
135 State taxes (net of federal tax benefit) (20.0) (6.6) (3.8) (11.8) (8.6) (8.0)
Investment tax credit — — — — 4.4 11.6
137 Nondeductible amortization of intangibles (4.0) (1.6) (1.2) (2.6) (1.4) —
138 Foreign earnings not taxed or taxed at other than statutory rate
2.0 (2.2) (0.2) 3.2 11.1 15.2
139 Other: Tax effects (17.0) (2.2) (0.1) (3.7) 7.5 (4.7)
Alaska Native Corporation transaction — — — — 4.5 —
22 Divestitures, restructuring and unusual charges — (339.1) (343.0) (40.6) — —
Tax effect of divest., restructuring & unusual charges (Note 4)
— 13.9 64.7 13.9 — —
(Continued on next slide)
11-9
Earnings Persistence
Recasting Earnings and Earnings Components
Campbell Soup Company
Recast Income Statements ($ mil.)
Item Year 11 Year 10 Year 9 Year 8 Year 7 Year 6
Gain on sale of businesses in (Yr 8) and sub. in Yr 7 — — — 3.1 9.7 —
Loss on sale of exercise equipment subsidiary, net of tax — — — — (1.7) —
LIFO liquidation gain (see Note 1 below) — — — 1.7 2.8 1.4
Income before cumulative effect of accounting change$ 401.5 $ 4.4 $ 13.1 $ 241.6 $ 247.3 $ 223.2
153A Cumulative effect of accounting change for income taxes — — — 32.5 — —
28 Net income as reported $ 401.5 $ 4.4 $ 13.1 $ 274.1 $ 247.3 $ 223.2
14 (Note 1) Cost of products sold $ 4,095.5 $ 4,258.2 $ 4,001.6 $ 3,392.8 $ 3,180.5 $ 3,082.8
144 Less: Repair and maintenance expenses (173.9) (180.6) (173.9) (155.6) (148.8) (144.0)
162A Less: Depreciation
(a)
(194.5) (184.1) (175.9) (162.0) (139.0) (120.0)
153A Plus: LIFO liquidation gain
(b)
— — — 2.6 5.1 2.6
$ 3,727.1 $ 3,893.5 $ 3,651.8 $ 3,077.8 $ 2,897.8 $ 2,821.4
15 (Note 2) Marketing and selling expenses $ 956.2 $ 980.5 $ 818.8 $ 733.3 $ 626.2 $ 544.4
145 Less: Advertising (195.4) (20.4) (212.9) (219.1) (203.5) (181.4)
$ 760.8 $ 960.1 $ 605.9 $ 514.2 $ 422.7 $ 363.0
21 (Note 3) Other expenses (income) $ 26.2 $ 14.7 $ 32.4 $ (3.2) $ (9.5) $ 5.5
102 Less: Stock price–related incentive programs (15.4) 0.1 (17.4) 2.7 — (8.5)
103 Less: Amortization of intangible and other assets (14.1) (16.8) (16.4) (8.9) (5.6) (6.0)
Less: Gain on sale of businesses (Yr 8) and sub. (Yr 7) — — — 4.7 14.7 —
104Other, net $ (3.3) $ (2.0) $ (1.4) $ (4.7) $ (0.4) $ (9.0)
(Note 4) Tax effect of divest, restruc., & unusual charges — $ 115.3
(c)
$ 116.6
(d)
$ 13.9 — —
136 Nondeductible divestitures, restructuring, and unusual charges
— (101.4)
(e)
(51.9)
(f)
— — —
— $ 13.9 $ 64.7 $ 13.9 — —
*Statutory federal tax rate is 34% in Year 8 through Year 11, 45% in Year 7, and 46% in Year 6.
†
This amount is not disclosed for Year 6.
(a)
We assume most depreciation is included in cost of products sold.
(b)
LIFO liquidation gain before tax. For example, for Year 8 this is $2.58 million, computed as $1.7/(1 - 0.34).
(c)
$339.1 (22) x 0.34 = $115.3.
(d)
$343.0 (22) x 0.34 = $116.6
(e)
$179.4 (26) x 0.565 (136) = $101.4.
(f)
$106.5 (26) x 0.487 (136) = $51.9.
11-10
Earnings Persistence
•
“Adjusting” aims to assign earnings components
to the periods in which they best belong.
•
Uses data from recast income statements and
other available information.
Adjusting Earnings and Earnings Components
11-11
Earnings Persistence
•
Specific (Typical) Adjusting Procedures
–
Assign extraordinary and unusual items (net of tax) to applicable
years
–
Tax benefit of operating loss carryforwards normally moved to
the loss year
–
Costs or benefits from lawsuit settlements moved to relevant
prior years
–
Gains and losses from disposals of discontinued operations can
relate to one or more prior years.
–
Changes in accounting principles or estimates yield adjustments
to all years under analysis to a comparable basis—redistribute
“cumulative effect” to the relevant prior years
–
Normally include items that increase or decrease equity
Adjusting Earnings and Earnings Components
11-12
Earnings Persistence
•
Specific (Typical) Adjusting Procedures
–
If a component should be excluded from the period it is
reported:
•
Shift it (net of tax) to the operating results of one or more prior
periods or
•
Spread (average) it over earnings for the period under analysis.
–
Spread the component over prior periods’ earnings only
when it cannot be identified with a specific period.
–
While spreading helps in determining earning power, it is
not helpful in determining earnings trends.
–
Moving gains/ losses to other periods does not remedy the
misstatements of prior years’ results.
Adjusting Earnings and Earnings Components
11-13
Earnings Persistence
11-14
Earnings Persistence
•
Earnings persistence determined by many factors
including:
–
Earnings trends
–
Variability
–
Earnings Management
–
Management Incentives
•
Note: assess earnings persistence
over both the business cycle and the long run.
Determinants of Earnings Persistence
11-15
Earnings Persistence
•
Earnings trends can be assessed by:
–
Statistical methods
–
Trend statements
•
Uses earnings numbers taken from the recasting
and adjusting procedures
Determinants of Earnings Persistence
11-16
Earnings Persistence
•
Earnings management
–
Changes in accounting methods or assumptions
–
Offsetting extraordinary or unusual gains and losses
–
Big baths
–
Write-downs
–
Timing revenue and
expense recognition
Determinants of Earnings Persistence
11-17
Earnings Persistence
•
Management incentives affecting persistence
include:
–
Personal objectives and interests
–
Companies in distress
–
Prosperous companies—preserving hard-earned
reputations
–
Compensation plans
–
Accounting-based incentives and constraints
–
Analysts’ targets
Determinants of Earnings Persistence
11-18
Earnings Persistence
•
Recasting and adjusting earnings for equity valuation
rely on separating stable, persistent earnings
components from random, transitory components.
–
Assessing persistence is important in determining earning
power.
–
Earnings forecasting also relies on persistence.
•
A crucial part is to assess the persistence of the gain and
loss components of earnings.
Persistent and Transitory Items in Earnings
11-19
Earnings Persistence
•
Purpose of analyzing and interpreting extraordinary
items:
–
Determine whether an item is transitory.
•
Assessing whether an item is unusual, nonoperating, or
nonrecurring.
–
Determine adjustments that are necessary given
assessment of persistence.
Analyzing and Interpreting Transitory Items
11-20
Earnings Persistence
•
Determining persistence
(transitory nature) of items:
–
Nonrecurring operating gains and losses
•
Usually included in current operating income
–
Nonrecurring non-operating gains and losses
•
Omitted from operating earnings of a single year
•
Part of the long-term performance of a company
Analyzing and Interpreting Transitory Items
11-21
Earnings Persistence
•
Adjustments to Extraordinary Items Reflecting
Persistence:
–
Effects of transitory items on company resources.
•
Effects of recorded transitory items and the likelihood of future
events causing transitory items.
–
Effect of transitory items on evaluation of management.
Analyzing and Interpreting Transitory Items
11-22
Earnings Based Equity Valuation
•
Equity value (V
t
)
•
Book value (BV
t
)
•
Residual Income, RI
t
= (NI
t
– k * BV
t-1
)
•
Cost of equity capital (k)
Relation between Stock Prices and Accounting Data
Key Question: Does the potential manipulation of
accounting data influence the accuracy of accounting-
based estimates, or forecasts, of company value?
11-23
Earnings Based Equity Valuation
•
Price-to-Book (PB) Ratio
Fundamental Valuation Multiples
Market Value of Equity
Book Value of Equity
11-24
Earnings Based Equity Valuation
•
Price-to-Book (PB) expressed in accounting data
Fundamental Valuation Multiples
( )
( )
( )
( )
( )
( )
+
×
+
−
+
×
+
−
+
+
−
+=
+++++
t
tt
t
ttt
t
t
BV
BV
k
kROCE
BV
BV
k
kROCE
k
kROCE
BV
V
2
3
31
2
21
11
1
1
Note:
ROCE and growth in book value increase PB increases
Cost (risk) of equity capital increases PB decreases
Present value of future abnormal earnings is positive (negative)
PB is greater (less) than 1.0
11-25
Earnings Based Equity Valuation
•
Price-to-Earnings (PE) Ratio
Fundamental Valuation Multiples
Market Value of Equity
Net Income