Climate change as environmental and economic hazard - phần 1.4
Bạn đang xem bản rút gọn của tài liệu. Xem và tải ngay bản đầy đủ của tài liệu tại đây (301.84 KB, 8 trang )
are dependent upon methodological choices or if
the signal is small when compared to uncertainties
or variability.
At times, when one reads studies seeking to
identify patterns or causality in geophysical time
series, one may be tempted to invoke the old saw
about how tortured data will inevitably confess.
But at the same time there may indeed be scienti-
fically meaningful signals in the data that
complex methods are able to extract. Regardless,
it seems straightforward that the more difficult it
is to identify a signal in messy data the less practi-
cally useful is that knowledge. In practical terms,
on timescales of decision making a signal that
cannot be seen is indistinguishable from a signal
that does not exist. Second, there are a number
of studies that have sought to use complex
methods to identify patterns and relationships in
the US hurricane landfall record. Those studies
will be referenced here, but not replicated.
The data on the economic losses from US land-
falling hurricanes comes from Pielke et al. (2008),
which sought to adjust historical losses as
recorded by the US National Hurricane Center
to estimate the damage that each historical
storm would have produced had it made landfall
in 2005. Pielke et al. (2008) presented two
methods for adjusting past losses. The data used
in this paper are based on the method first intro-
duced in Pielke and Landsea (1998), and have
been updated through the 2008 hurricane
season.
1
The data used here do not include
damage from storms that made landfall at less
than hurricane strength, though such damage is
considered in Pielke et al. (2008).
The data on landfalling hurricanes is from the
National Oceanic and Atmospheric Adminis-
tration’s Hurricane Reanalysis Project.
2
Various
other data used in the analyses presented below
will be cited as they are used. Information on land-
falling hurricanes is generally recognized as being
more reliable as long as a century ago and earlier
because large tropical cyclones would have been
difficult to miss as the coastline was becoming
increasingly populated. However, in the Pielke
et al. (2008) dataset there are six storms prior to
1940 which made landfall at hurricane strength
yet had no recorded damages. Logically, the
chances that a landfalling storm was missed
increases as one goes further back in time.
However, the general convention is to assume
that all landfalling hurricanes have been identified
since 1900 (cf. Elsner and Jagger, 2006).
2.1. Landfall and damage records
Decision makers in a range of settings have con-
siderable interest in the ability to anticipate hurri-
cane landfalls in the USA and the losses associated
with those impacts. Such expectations are key
inputs to the pricing of homeowners’ property
insurance, the structure of complex financial
transactions between global reinsurance firms
and the movement of prices on commodities
markets. Anticipation of hurricane landfalls can
take the form of a prediction of a specific
number of landfalls or the probability (risk) of
landfalls. Judgements of risk are a form of
prediction.
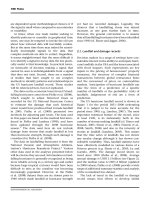
The US hurricane landfall record is shown in
Figure 1 for the period 1851–2008 (reiterating
that it is judged to be most accurate for the
period since 1900, e.g. Landsea, 2007). The most
important statistical feature of the record, since
at least 1920, is its stationarity both in the
number of storms making landfall (cf. Elsner and
Bossack, 2001; Elsner et al., 2003; Nzerem et al.,
2008; Smith, 2008) and also in the intensity of
storms at landfall (Landsea, 2005). This means
that the time series of landfalls has not shown
any secular change although it has shown con-
siderable variability. Thus, landfall statistics have
been effectively modelled in various forms of a
Poisson process (e.g. Elsner et al., 2003; Lu and
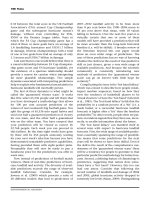
Garrido, 2005). The damage record shows no
trend since 1900 (Pielke et al., 2008). Average
annual damage is USD11.3 billion (see Figure 2),
and the median value is USD1.2 billion (updated
to 2008 values); Pielke et al. (2008) provide a wide
range of additional summary statistics and analysis
of the normalized loss dataset.
The lack of trend in the landfall or damage
record means that efforts to develop skilful
188 Pielke
ENVIRONMENTAL HAZARDS
predictions must necessarily be able to anticipate
variability, as well as any future non-stationarities
not evident in the historical record. If variability
is to be anticipated then there must be relation-
ships between those variables that can be
accurately predicted and landfall frequency.
Consequently, considerable scientific effort has
been devoted to developing statistical and
dynamic models of hurricane activity with the
goal of offering skilful predictions of landfall
and thus impact. The following section reviews
this literature.
3. Efforts to make connections
An ability to anticipate hurricane landfalls
reliably on short timescales, such as five years or
less, would be of considerable value to decision
makers. Unfortunately, despite notable advances
FIGURE 1 US hurricane landfalls, 1851–2008
FIGURE 2 Normalized damages 1900–2005 for all landfalling tropical cyclones
Source: Reproduced from Pielke et al., 2008.
United States hurricane landfalls and damages 189
ENVIRONMENTAL HAZARDS
in scientific understanding as well as some indi-
cations of skilful in-sample explanatory power
(i.e. retrodictions or hindcasts), no methodology
has yet shown skilful out-of-sample predictions of
US hurricane landfalls or damage, on timescales
of one to five years, in the form of real-time fore-
casts provided to decision makers.
3.1. Landfall and North Atlantic Basin activity
Perhaps the most intuitive relationship to be
explored is that between the total number of
storms in the North Atlantic (NATL) and the
number that make landfall. This relationship,
however, is not straightforward. A simple corre-
lation between the number of named storms
(i.e. storms that reach tropical cyclone strength)
and landfalling hurricanes is 0.46, explaining
about 21 per cent of the variation in hurricane
landfalls (for the period 1966–2008, which
coincides with the satellite observational era;
Landsea, 2007). Using only storms that reach hur-
ricane strength in the correlation with landfalls
offers a little improvement. Table 1 shows a
range of simple correlations between basin
activity, hurricane landfalls and damage.
3
Logically, and as would be expected, corre-
lations with damage improve as one moves to
smaller subsets of the data, including intense
hurricanes which historically have accounted
for about 85 per cent of all damage (Pielke et al.,
2008). The number of landfalling hurricanes
shows a strong relationship with damage,
explaining about half the variation and under-
scoring the importance of skilful landfall predic-
tions. But at the same time, even a perfect
prediction of the number of landfalling hurri-
canes leaves a considerable amount of uncer-
tainty about damage, due to the nonlinear
impacts of storms of different hurricane intensi-
ties, as well as the differential levels of population
and development along the US coast.
Over decades it is clear that storm seasons with a
greater number of named storms also have more
landfalls and greater damage. From 1966 to
2008 hurricane seasons with 11 or more named
storms (i.e. above the period average of 10.8
storms, which occurred in 23 of 43 years), there
was an average of 2.1 US hurricane landfalls
causing median damage of USD 2.3 billion. In
seasons with 10 or fewer named storms (below
the average of 10.8 storms, which occurred in 20
of 43 years) there was an average of 1.0 named
storms causing median damage of USD640
million. However, the relationship between
overall activity and landfalls is not nearly as pro-
nounced in years with more than 11 named
storms. The 13 years during the period 1966 to
2008 with 13 or more named storms had an
average of 2.3 landfalling hurricanes, while the
10 years with 11 or 12 named storms had an
average of 1.8 landfalling hurricanes. Each value
falls well within the other’s standard deviation,
helping to explain why the overall number of
named storms explains only a small portion of
the variability in landfalls.
3.2. Landfall rates and proportion
Table 2 shows for three different periods – 1900 –
2008, 1951–2008 and 1979–2008 – the frequency
of annual landfalls in the first and second half of
each of the periods. A few curiosities stand out.
The 54 years prior to 1954 saw 21 of 54 years
(39 per cent) with zero or one landfall, whereas
TABLE 1 Correlations between various measures of activity,
US landfalls and damage
Hurricanes in
basin
Landfalling
hurricanes
Damage
Named storms in
basin
0.87 0.46 0.27
Hurricanes in
basin
* 0.52 0.42
Intense
hurricanes in
basin
* 0.58 0.45
Landfalling
hurricanes
* * 0.71
Note: Correlations with damage are computed as Spearman (rank)
correlations. The time period of the analysis is 1966–2008, which
coincides with the satellite observational era (Landsea, 2007).
190 Pielke
ENVIRONMENTAL HAZARDS
the 54-year period 1954–2008 saw 35 years (65 per
cent) with zero or one landfall. The 15-year period
1979–1993 saw four years with two or more land-
falls, whereas the 15-year period 1994–2008 saw
eight years with two or more landfalls. Damage
from equal periods from 1901 to 2008 shows no
evidence of secular changes in landfall numbers,
overall damage or damage per landfall, as shown
in Table 3 (cf. Pielke et al., 2008).
Efforts to anticipate future hurricane activity
has primarily focused on developing seasonal pre-
dictions (i.e. for lead times of less than one year)
of NATL basin activity, with yearly forecasts pro-
vided by teams from Colorado State University
and the National Oceanic and Atmospheric
Administration, along with a range of scientists,
private firms and consultants offering their own
predictions (for a review, see Camargo et al.,
2007). Even though such forecasts are announced
with much fanfare, widely reported on in the
media and considered by many decision makers,
they have thus far offered very little insight to
the subsequent season’s landfall or damages.
Nonetheless, the changing number of storms
in the NATL basin since 1995 as compared to a
much quieter period from 1970 to 1994 has led
to a vigorous scientific debate over hurricane
landfalls. The data record for named storms in
the NATL basin, unlike the landfall record, does
indicate statistical non-stationarity over the
20th century and the latter half of the 19th
century. Specifically it shows a long-term increase
in the overall number of storms, punctuated
by periods of greater and lesser activity (e.g.
Holland and Webster, 2007; see also Briggs,
2008). The data record has led to several compet-
ing interpretations to explain why the basin stat-
istics would show an increase while the landfall
statistics would not.
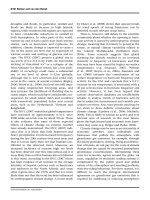
The net result of the different behaviour of
basin-wide activity and landfalling hurricanes is
a decrease in the overall proportion of storms
that make landfall, as shown in Figure 3, with a
best fit linear trend. From at least 1950 there is
no trend in the landfall proportion but consider-
able variation, ranging from 0 to about 55 per
cent of named storms.
3.3. Spatial distribution of hurricane activity
One explanation for the different statistical
behaviour of the basin and landfall data is that
the increase observed in the overall basin activity
is the result of changing observational practices
rather than changes in storm activity. This line
of argument posits, uncontroversially, that the
number of landfalling storms is one of the most
reliable hurricane time series. It then assumes,
controversially, that the overall basin numbers
are proportional to the number of landfalling
TABLE 2 Number of years with indicated number of landfalls
for three periods, each divided into halves
Hurricane
landfalls
1900–
1953
1954–
2008
1951–
1979
1980–
2008
1979–
1993
1994–
2008
Zero 10 10 4 7 3 4
One 11 25 15 11 8 3
Two 17 7 3 4 1 3
Three 11 7 6 4 2 3
Four 3 0 0 0 0 0
Five 2 0 0 0 0 0
Six 030312
Total years 54 54 29 29 15 15
TABLE 3 Landfalling hurricanes, total normalized damage
and damage per landfall for four equal periods
1901–
1927
1928–
1954
1955–
1981
1982–
2008
Landfalling hurricanes 48 54 37 48
Total normalized
damage (USD billion)
296 296 205 349
Damage per landfall
(USD billion)
6.2 5.5 5.5 7.3
Note: The data shown in Table 3 above are sensitive to choice of interval,
given that large damaging events lead to a large fraction of the damage
for any particular period. However, the choice of comparison period does
not alter the perspective of a long-term stationarity in landfall and damage
statistics. For instance, the 54-year period 1901–1954 saw USD592 billion
in normalized damage from 101 landfalls and the 54-year period
1954–2008 saw USD554 billion in normalized damage from 83 landfalls.
United States hurricane landfalls and damages 191
ENVIRONMENTAL HAZARDS
storms, and thus arrives at corrections which can
be applied to the historical basin-wide data
(examples of this line of argument can be
found, for example, in Solow and Moore, 2002;
Landsea, 2007).
A second line of argument is that the relatively
small number of landfalls in the entire record
leads to a meaningful chance that landfall
numbers have indeed changed, based on the
changes to overall basin activity, but that those
changes cannot be detected at a statistically signifi-
cant level. As Nzerem et al. (2008) argue, ‘one
cannot conclude from the lack of detectable
change-points in the landfall series that this
series isn’t changing’ (cf. Elsner et al., 2003). A
similar line of argument was invoked by Emanuel
(2005) in response to the observation that neither
landfalls nor damage had increased since 1990
(Pielke, 2005). From the perspective of decision
making, this argument is rather academic, as
changes that cannot be detected can hardly be
claimed to have much practical significance.
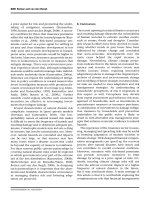
Both of these lines of argument miss an impor-
tant factor in understanding the differential pat-
terns seen in basin and landfall statistics, and
that is the spatial distribution of trends in the
NATL basin (see Pielke et al., 2008 for discussion).
Specifically, if one looks at the increasing activity
in the basin the increase has occurred in the east-
ernmost part of the basin, far from land. The
activity in areas where landfall takes place
shows very similar trends to the landfall data.
Figures 4a and 4b show these data.
Thus one need not invoke either the vagaries of
chance or flawed data to explain the different
statistics observed in the basin and for landfall.
Instead, what needs to be explained is why the
easternmost portion of the basin (i.e. the two
most eastern quadrants in Figure 4b) has seen an
increase in storm activity. This question will
once again lead to thus-far unresolved questions
about data quality and causality. However,
because the activity in this part of the basin
is not highly correlated with landfalls (Pielke and
McIntyre, 2007), the debate is not particularly
relevant to questions related to landfall prediction.
Because landfall proportions vary a great deal,
even with a perfect prediction of basin activity,
predictions of landfall will have limited skill.
Thus, any prediction of landfall that assumes a
constant landfall proportion (e.g. Coughlin
et al., 2009) necessarily leads to a poor prediction
of landfall activity. For instance, consider a pre-
diction made starting in 2000 using data since
1950. If one compares a prediction of landfall
based on simply the climatological average
(from 1950 to the year before the predicted year)
with a prediction using a perfect basin forecast
assuming a constant landfall proportion (e.g.
from 1950 to 1999, the average proportion was
15.6 per cent), the use of the perfect basin forecast
method would improve upon climatology in only
five of the subsequent nine years, indistinguish-
able from chance.
4
Because overall basin activity
predictions are not perfect, this is the idealized
best case scenario.
To summarize, over periods less than a decade
(perhaps even several decades), and certainly
on the timescale of years, the total number of
named storms offers little if any advantage over
climatology for anticipating landfalling hurri-
canes. There are three main reasons for this con-
clusion. First, even though landfall proportions
cannot be shown to have changed since at least
FIGURE 3 Proportion of named storms making landfall as hurricanes, 1900–2008
192 Pielke
ENVIRONMENTAL HAZARDS