Droplet microfluidics with ionic liquids for chemical analysis and separations
Bạn đang xem bản rút gọn của tài liệu. Xem và tải ngay bản đầy đủ của tài liệu tại đây (4.99 MB, 236 trang )
DROPLET MICROFLUIDICS WITH IONIC LIQUIDS FOR
CHEMICAL ANALYSIS AND SEPARATIONS
ZAHRA BARIKBIN
SINGAPORE-MIT ALLIANCE
NATIONAL UNIVERSITY OF SINGAPORE
2013
ii
DROPLET MICROFLUIDICS WITH IONIC LIQUIDS
FOR CHEMICAL ANALYSIS AND SEPARATIONS
ZAHRA BARIKBIN
(M.Eng. (Hons.) Chemical Engineering-Biotechnology, B.Sc.
(Hons.) Chemical Engineering-Petrochemical Industries,
Tehran Polytechnic)
A THESIS SUBMITTED FOR THE DEGREE OF DOCTOR
OF PHILOSOPHY IN CHEMICAL AND
PHARMACEUTICAL ENGINEERING
SINGAPORE-MIT ALLIANCE
NATIONAL UNIVERSITY OF SINGAPORE
2013
iii
DECLARATION
I hereby declare that this thesis is my original work and it has been
written by me in its entirety. I have duly acknowledged all the sources of
information which have been used in the thesis.
This thesis has also not been submitted for any degree in any university
previously.
ZAHRA BARIKBIN
06 May 2014
iv
To my parents
Maliheh and Mohammad
and
my husband Hamed
with love
v
Acknowledgements
First of all, I would like to extend my sincere gratitude to my thesis advisor, Dr. Saif
A. Khan, for his guidance, wisdom, insights, and professional supports throughout my
time at SMA. I truly appreciate him for the magnificent opportunity to work in his
research group and for all motivating discussions and meetings. This thesis would
never have come together without his continuous guidance and support from the
earliest days of my PhD. Thank you Dr. Khan for all your encouraging advices and
for helping me to be an independent researcher and see the world with all the
wonderful different aspects. I am proud to be your student for 6 years working on my
MEng and PhD projects. I have been also fortunate to have Prof. Patrick S. Doyle as
my thesis advisor. My visit to MIT and work in his laboratory, though very short, has
been an invaluable and unforgettable experience in my academic life. My special
thanks and deep appreciation goes to Prof. Rajagopalan for the support and
encouragement during the difficult time I faced in the last year. I would not be able to
finish my PhD without his and Dr. Khan’s sincere help and kind understanding.
I am very much grateful to my labmates for all the wonderful time, brain-storming
discussions, fun, coffee breaks, playing volleyball, all outgoing events and for their
continuous help and assistance. Dr. Md. Taifur Rahman, in particular, has been both a
mentor and a friend. We have worked closely days and late nights in these past years,
and he has taught me a tremendous amount about everything from the ancient poets to
the finer points of academic thinking and writing. Thanks to my other wonderful lab
friends Pravien, Suhanya, Sophia, Abhinav, Reno, Prasanna, Abu Zayed, Toldy
Arpad, Swee Kun, Zita and Annalicia. The FYPs and exchange students that have
worked on this project deserve mention: Peng You, Zhiyan and Gant, Josu, Dominik
and Sandra.
I would like to thank Singapore-MIT Alliance and National University of Singapore
(NUS) for the funding that has made this project possible. I also feel a deep
appreciation for my friends, indeed my new brothers and sisters, who have made my
grad school experience so sweet and unforgettable. Thanks and appreciation to Shima,
Alireza R., Mona, Alireza Kh., Fatemeh, Hamed, Azadeh, Mahmood, Neda, Ehsan,
Fahimeh, Asad, Ladan, Pooneh, Hossein, Fatemeh, Ahmad, Raja, Khatereh, Ehsan,
vi
Marjan, Ramin, Dornoosh, Masoud, Zahra, Mohammad, Narjes, Sajad, and my other
Iranian friends in Singapore.
Finally, I would like to thank my family for their love and support. Hamed, thank you
for everything. I would not be able to write this thesis without your everyday support
and understanding throughout these years.
To my grandma, Zaman, grandpa, Mahdi,
mum and dad, Maliheh and Mohammad, Hamed’s parents, Soheila and Hassan, my
brothers and their families,
Behrooz, Maryam, Amirpooya, Roozbeh, Maryam, Armin
and Alireza
, thank you all for your love, bearing with my absence during the course of
my PhD studies and for the sacrifices you have made throughout my life to give me the
best. You are the true reason I am here today.
vii
Contents
Chapter 1 Introduction 34
1.1 Miniaturization through Microfluidics 34
1.2 Microfluidics 36
1.2.1 Design and Fabrication of Microfluidic Devices 39
1.2.2 Multiphase Microfluidics or Digital Microfluidics 43
1.3 Engineering Droplets for Chemical Processes 46
1.3.1 Droplet Formation or Metering 46
1.3.2 Mixing 48
1.3.3 Chemical Reaction 50
1.3.4 Droplet Traffic 53
1.3.5 Material Synthesis through Phase Change in Droplets 59
1.3.6 Chemical Sensing and Detection 63
1.4 Designer Emulsions 66
1.5 Designer Fluids - Ionic Liquids (ILs) 70
1.5.1 History 72
1.5.2 Applications of Ionic Liquids 76
1.5.3 ILs and Microfluidics 90
1.6 Thesis Layout and Scope 91
1.7 References 93
Chapter 2 Microfluidic Compound Droplets: Formation and Routing 113
2.1 Compound Droplets Formation 113
viii
2.1.1
Double Emulsion Structures 115
2.1.2 Partially Engulfed Structure or Compound Droplets 117
2.2 Compound Droplets Routing 121
2.3 Experimental Details 124
2.3.1 Materials 124
2.3.2 Synthesis of IL ([EMIM][NTf
2
]) 124
1-ethyl-3-methylimidazolium bis(trifluoromethylsulfonyl)imide 124
2.3.3 Physical Properties of IL [EMIM][NTf
2
] 125
2.3.4 Microfabrication 126
2.3.5 Device Setup and Operation 131
2.4 Results and Discussion 133
2.4.1 Formation of Compound Droplet of Different Configurations 133
2.4.2 Compound Droplets Decoupling 140
2.4.3 Compound Droplet Splitting 146
2.5 Summary 147
2.6 References 148
Chapter 3 Ionic Liquid-Aqueous Microdroplets for Biphasic Chemical Analysis
and Separations 151
3.1 Method Development 155
3.1.1 On-drop Chemical Separations 155
3.1.2 Dynamic pH Sensing 156
3.1.3 Biphasic Reactive Sensing 157
ix
3.2
Experimental Details 160
3.2.1 Materials 160
3.2.2 Synthesis of IL [EMIM][NTf
2
] 160
3.2.3 Microfabrication 160
3.2.4 Device Operation and Setup 162
3.2.5 Data Collection and Image Analysis 164
3.2.6 Chemical Synthesis 165
3.2.7 Results and Discussion 167
3.3 Summary 179
3.4 References 181
Chapter 4 Microfluidic Synthesis of Polymeric Ionic Liquids with Tunable
Functionalities 187
4.1 Monodisperse Polymeric Ionic Liquid Microgels 187
4.2 Method Development 189
4.3 Experimental Details 191
4.3.1 Materials 191
4.3.2 Ionic Liquid Monomer Synthesis 192
4.3.3 Microfluidic Formation of PIL Microgels 193
4.3.4 Microfluidic Formation of PEGDA Microgels 194
4.3.5 Characterization 194
4.3.6 Anion-Dependent Microbead Sizes 195
4.3.7 Optical Microscopic Image Analysis of PIL Microgel Beads 196
x
4.3.8
Stimulus (pH)-Responsive Chemical Release 197
4.3.9 Chemical Separations – Heavy Metal Removal. 197
4.3.10 Chemical Sensing – pH. 198
4.4 Results and Discussion 198
4.4.1 Anion-Dependent Volume Transitions 198
4.4.2 Stimulus (pH)-Responsive Chemical Release 202
4.4.3 Chemical Separations – Heavy Metal Removal 203
4.4.4 Chemical Sensing – pH 205
4.4.5 Characterization 209
4.4.6 Summary 214
4.5 References 215
Chapter 5 Conclusions and Future Directions 220
5.1 Conclusions 221
5.2 Future Directions 222
5.3 References 227
Appendix A……………. 230
Appendix B…… 234
xi
List of Figures
Figure 1.1. A typical lab-on-a-chip microfluidic device
10
(From [10]. Reprinted with
permission from AAAS.) 35
Figure 1.2. Schematic illustrations of a) ‘dynamic interface’, an interface between
two miscible fluids that flow next to each other and eventually mix through merely
diffusion process. b) ‘pinned interface’, an stable interface that is formed between
immiscible fluids. c) ‘floating interface’, an interface between two immiscible phases
an acts as a semipermeable container wall. 37
Figure 1.3. a) Channel based microsystems
15
(Reproduced with permission from [15].
Copyright 2003, John Wiley and Sons.) and b) surface based
microsystems.
16,17
(Adapted from [16], Copyright 2010 with permission from
Elsevier.; From [17]. Reprinted with permission from AAAS.) 39
Figure 1.4. Segmented flow microfluidics of, a) 2-phase liquid-liquid, b) 2-phase gas-
liquid flows,
29
(Reproduced with permission from [29]. Copyright 2007, John Wiley
and Sons.) c) flow regime diagram for segmented liquid-liquid microfluidic systems
with transitional lines and operating conditions based on several literatures.
27, 30-34
(Adapted from [27] by permission of The Royal Society of Chemistry) More complex
emulsion systems of d, e) 3-phase gas-liquid-liquid
35-37
(Panel ‘d’ reproduced with
permission from [36] and [37]. Copyrights 2007 and 2005; respectively, John Wiley
and Sons. Panel ‘e’ adapted from [35] by permission of The Royal Society of
Chemistry) and f, g) liquid-liquid-liquid flows.
38-39
(Panel ‘f’ from [38]. Reprinted
with permission from AAAS; Panel ‘g’ reprinted with permission from [39].
Copyright 2008, AIP Publishing LLC.) 45
Figure 1.5. Droplet formation or metering. Schematic views and microscopic images
of main droplet generators for a-d) a T-junction geometry,
43, 47
and microscopic
xii
images of droplets formation at e-h) flow-focusing geometries.
41-42
(© IOP
Publishing. Panels ‘a-c’ and ‘e’ reproduced by permission of IOP Publishing. All
rights reserved. Panels ‘f, g’ reprinted with permission from [41]. Copyright 2006,
AIP Publishing LLC.; panel ‘h’ adapted from [42] by permission of The Royal
Society of Chemistry.) 47
Figure 1.6. Mixing and dilution in droplets. a) Formation of droplets with various
chemical compositions by using a combination of opposing T-junction.
55
(Reproduced
from [55] by permission of The Royal Society of Chemistry) b) A microfluidic
system to perform a two-step reaction in which droplets are used as containers.
Aqueous reagents R1 and R2 are merged in a T-junction to form a droplet which
flows in oil. Mixing is accelerated by chaotic advection as droplets flow through a
serpentine microchannel. After mixing section a longer channel allows the reaction in
droplets to proceed. To initiate the second reaction, a third reagent, R3, is added later
at the second T-junction placed in the microchannel downstream.
56
(Reproduced from
[56] by permission of The Royal Society of Chemistry) c) Inserting a buffer solution
prior to merging in a single droplet dilutes the reagents concentration.
54
(Adapted
with permission from [54]. Copyright 2003, American Chemical Society) d-f) Mixing
in liquid droplets and continuous segments through internal recirculating motions.
15,
59-60, 63
(Panel ‘d’ adapted from [60] by permission of The Royal Society of
Chemistry; Panel ‘e’ adapted with permission from [63]. Copyright 2004, American
Chemical Society; Panel ‘f’ reproduced with permission from [15]. Copyright 2003,
John Wiley and Sons. and from [59], by permission of the Royal Society.) 49
Figure 1.7. (a-e) Merging droplets,
26, 101-105
(f,g) separating bubbles
60
and gas-liquid
compound droplets
35
(h-k) splitting single droplets and more complex emulsions.
35, 95,
106-107
a) Active merging of droplets using electrocoalescence,
101
(Reprinted with
xiii
permission from [101]. Copyright 2006, AIP Publishing LLC.) (b) passive droplet
merging by channel geometry; surface patterns induces the coalescence of droplets.
102
(Adapted from [102] by permission of The Royal Society of Chemistry) Schematics
of c) reaction initiation by merging two droplets
26
d) narrowed and widening channels
which affect the speed of droplets and cause their merging.
26
(Panels ‘c’ and ‘d’
adapted from [26]. © IOP Publishing. Reproduced by permission of IOP Publishing.
All rights reserved.) e) merging droplets at a simple T junction.
103
(Reprinted from
[103] by permission of The Royal Society of Chemistry) f) Separation of gas bubbles
from liquid stream using capillary separator.
60
(Reprinted from [60] by permission of
The Royal Society of Chemistry) g) gas-liquid compound droplets are separated using
either extra oil injection or bifurcated microchannels.
35
h, i) bifurcating single droplets
at simple T-junctions.
95, 106
(Panel ‘h’ reprinted with permission from [106]. Copyright
2009, AIP Publishing LLC. and panel ‘i’ reprinted with permission from [95].
Copyright 2004 by the American Physical Society.) j, k) splitting of complex
emulsion at bifurcated channels.
35, 107
(Panels ‘g’ and ‘j’ reprinted from [35] and panel
‘k’ from [107] by permission of The Royal Soceity of Chemistry.) 55
Figure 1.8. Droplets sorting using (a) bypass channels
108
and (b-c)
dielectrophoresis
110
. a) Schematic (left) and snapshot (right) of two junctions in the
same device fed by a single droplet generator which distributes droplets into both
channels using the droplet distributor bypass. The leftmost junction with a bypass
shows a perfectly alternating distribution of droplets between its two outlets. The
junction on the right with no bypass shows a random alternation of droplets mainly by
filtering into one arm.
108
b) Schematic view of the device used for dielectrophoresis
sorting.
110
(c) In the absence of an electric field, water droplets flow into the waste
channel while in the presence of an electric field, the droplets flow towards the
xiv
energized electrode and collection channel.
110
(Reprinted with permission from [108]
and [110]. Copyright 2006, AIP Publishing LLC.) 58
Figure 1.9. (a) Schematic diagram and optical micrographs of the extended capillary
microfluidic device for generating triple emulsions that contain a controlled number
of inner and middle droplets stages.
123
(Reproduced with permission from [123].
Copyright 2008, John Wiley and Sons.) (b) Schematic diagram and photographs of
the alternating formation of aqueous droplets at the upstream junction and subsequent
encapsulation at the downstream junction to form W/O/W droplets.
51, 144
(Reprinted
from [144] by permission of The Royal Society of Chemistry.) 69
Figure 1.10. Structures of common cations and anions of ionic liquids. 71
Figure 2.1. a) Possible equilibrium configurations corresponding to three sets of
spreading parameters, S
i
. Photographs of the stages of b) partial engulfing and c)
complete engulfing.
4
(Reprinted from [4], Copyright 1970, with permission from
Elsevier.) 114
Figure 2.2. Left: sketch of the partially engulfing configuration with the phases A and
B surrounded by the phase 0 and the Neumann’s triangle whose sides have lengths
proportional to the surface tensions. Right: the diagram representing possible
morphologies formed by the phases A (green) and B (red) in the case of equal droplet
volumes V
A
= V
B
. The dotted line corresponds to the condition θ
B
= θ
A
.
5
(Adapted
from [5] with permissiom of The Royal Society of Chemistry.) 116
Figure 2.3. Configurations of partially engulfed droplets for various θ
0
in the limiting
case σAB→ σOA and σOBσAB→0, which corresponds to θ
A
= π (Solid-like phase
A).
5
(Adapted from [5] with permissiom of The Royal Society of Chemistry.) 118
Figure 2.4. Configurations of partially engulfed droplets for various θ
B
in the limiting
case σOB→ σOA and σOAσAB→∞, which corresponds to θ
0
= π (Janus-like
xv
doublet).
5
(Adapted from [5] with permissiom of The Royal Society of Chemistry.)
119
Figure 2.5. Diagram represents the regions of positive and negative curvature R
−1
of
the AB-interface in Janus-like droplets. The solid line corresponds to V
B
/V
A
=
(V
B
/V
A
)
crit
.
5
(Adapted from [5] with permissiom from The Royal Society of
Chemistry.) 120
Figure 2.6. Synthesis protocol of ionic liquid [EMIM][NTf
2
] 125
Figure 2.7. A schematic illustrating formation and breakup of IL-Aq compound
droplets in fluorinated oil (FO) at Brkup I droplet generator. Left inset is the
AutoCAD design of the breakup point and the right inset shows schematics of some
configurations of compound droplets generated in this work. 128
Figure 2.8. (a) Stereomicroscopic image, and (b) schematic of compound droplets
generation at the Brkup II drop dispensing junction of a PDMS microfluidic device,
respectively: merger of preformed aqueous droplet (Aq) with a thin stream of ionic
liquid (IL), producing ionic liquid-aqueous (IL-Aq) bi-compartmental compound
droplets flowing in continuous phase (fluorinated oil, FO). 128
Figure 2.9. A schematic of a typical bifurcated junction used in this thesis.
Characteristic lengths for both microchannel and compound droplets are also
highlighted. 129
Figure 2.10. AutoCAD design of the device containing Brkup I design for compound
droplet generation and BIF I bifurcation in downstream of the microdevice. This
design was used to study the decoupling of the two compartments of compound
droplets versus non-decoupling behavior. Different devices with two different
dimensions of bifurcated channels (BIF I and BIF II) were using Brkup I droplet
generator. 129
xvi
Figure 2.11. AutoCAD design of the Brkup II - BIF II device used to study the
splitting of IL-aqueous biphasic droplets. 130
Figure 2.12. Constriction geometry at l =17.34 cm of the Brkup II microfluidic device
to study the decoupling of IL-Aq compound droplets 130
Figure 2.13. Stereomicroscope images of compound droplet structures: (a) fully
engulfed aqueous-in-ionic liquid compound droplets, formed in a continuous phase of
silicone oil, and (b)–(d) partially engulfed aqueous-ionic liquid droplets formed in a
fluorinated oil continuous phase. Abbreviations: Aq: aqueous (containing Methyl
Blue), IL: ionic liquid (containing Orange II), SO: silicone oil, and FO: fluorinated oil
(perfluorodecalin: perfluorooctanol, 10:1 (v/v)). 134
Figure 2.14. (a) Schematic illustrating the our method and other droplet morphologies
obtained with silicone oil as continuous phase (b) - (c) Stereomicroscopic images of
different morphologies of the compound droplets obtained with Q
IL
(b) 2 µL.min
-1
(c)
5 µL.min
-1
at constant Q
Aq
(5 µL.min
-1
) and Q
SO
(15 µL.min
-1
). Scale bars represent
300 µm. 134
Figure 2.15. (a) Aqueous- [MMIM][NTf
2
] (structure provided in Fig. S2) compound
droplet generation in fluorinated oil (b, c) Three-phase flow with phosphonium ionic
liquid [C
12
(C
4
)
3
P] [NTf
2
]
. Compound droplets are not formed in this case as the ionic
liquid does not satisfy a key criterion for compound droplet formation; it competes
with the fluorinated oil in wetting the PDMS microchannel surface. Scale bars are
300μm. 135
Figure 2.16. Stereomicroscopic images of IL-Aq compound droplet break up at
Brkup I junction which is operated based on a hybrid of cross-flow and co-axial
schemes. 137
xvii
Figure 2.17. Stereomicroscopic images of different compound droplet structures
obtained with increasing values of Q
FO
(a) 9 µL.min
-1
(b) 15 µL.min
-1
(c) 21 µL.min
-1
and (d) 30 µL.min
-1
at constant Q
IL
and Q
Aq
of 3 µL min
-1
. 138
Figure 2.18. Flow map of compound droplet configurations when Q
FO
remained
constant at 9 µL.min
-1
and Q
Aq
at either of 1, 2, 3 and 5 µL.min
-1
while IL flow rate,
Q
IL
, was varied from 0.5 to 15 µL.min
-1
. Scale bars are 300μm. 139
Figure 2.19. Flow map of compound droplet configurations when IL phase flow rate,
Q
IL
, was remained constant at either of 0.5, 1, 2, and 3 µL.min
-1
while aqueous flow
rate, Q
Aq
, is varied from 1 to 30 µL.min
-1
(Q
FO
was invariable at 9 µL.min
-1
). Scale
bars are 300μm. 140
Figure 2.20. Stereomicroscope images of: a) compound droplet decoupling at an
obstacle in the flow path (U = 4.5 mm/s), b) compound droplet passing by the
obstacle at lower flow speed (U = 1.3 mm/s), where no decoupling occurs. 142
Figure 2.21. (a) Morphology of a compound droplet (i) before, and (ii) after the
decoupling process. b) Plot of occurrence of decoupling vs the flow speed (for fixed
size of compound droplet compartments), i.e., ‘1’ and ‘0’ indicate successful and no
decoupling respectively. A critical flow speed (∼ 2 mm/s) for the decoupling
phenomenon is observed. 142
Figure 2.22. Time-stamped stereomicroscope images of compound droplet
decoupling at two different bifurcations geometries; a) BIF I and b) BIF II.
Compound droplets are formed using Brkup I droplet formation scheme. All scale
bars are 300 µm. 144
Figure 2.23. Graphs of Ca vs non-dimensional characteristic length scales; a) Log Ca
vs (L
aq
/L
t
)(W
C
/W
B
) b) Log Ca vs (L
aq
/L
t
). Filled markers are related to complete
xviii
decoupling marked as D and unfilled markers show non-decoupling designated as
ND. 146
Figure 2.24. Time-stamped images of a compound droplet splitting into to equal-
sized daughter drops at bifurcated intersection. All scale bars are 300 µm. 146
Figure 2.25. A graph of L
aq
/L
t
vs U
t
, illustrating splitting (□), decoupling (●) and non-
decoupling (○) domains. 147
Figure 3.1. Selective and rapid extraction of OrII (orange II) into IL compartment
from a mixture with MeB (Methyl Blue) as compound droplet translates along the
microchannel. 156
Figure 3.2. On-drop dynamic pH sensing: pH indicator (thymol blue)-doped IL
compartment of the compound droplet changes color from neutral color to
acidic/basic color as the IL becomes progressively acidic/basic by mass transfer of
acid/base from the aqueous phase. 157
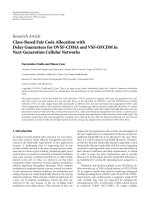
Figure 3.3. (a) A schematic of the general concept of ‘on-drop’ biphasic chemical
analysis: Interfacial analyte transport within the ionic liquid compartment of a
microfluidic ‘firefly’. (b) Metal (analyte)-catalyzed fluorescence generating reaction
scheme: gold ions are transferred from the aqueous to ionic liquid compartment, and
catalyze the conversion of a substrate into a strongly fluorescing product, triggering
bright fluorescence in the IL compartment (excitation: 365nm, emission: 496nm). (c)
‘Fireflies-on-a-chip’ visualized by mono-chrome camera under UV irradiation, Inset:
bright field image of a compound droplet. (d) Stereomicroscope image of a ‘firefly-
on-a-chip’ visualized using color camera under UV irradiation. Scale bars= 300 µm.
159
Figure 3.4. AutoCAD drawing of the microchannel used for ‘on drop’ separation and
pH sensing 161
xix
Figure 3.5. AutoCAD drawing of the microchannel used for biphasic reactive sensing
162
Figure 3.6. Schematic view of the experimental set-up 163
Figure 3.7. Microfluidic experimental setup for ‘compound’ droplet generation and
fluorescence imaging 164
Figure 3.8. Fluorescence spectra of ionic liquid, [EMIM][NTf
2
], 1/ IL solution, and
2/IL solution (λ
ex
365 nm, λ
emm
496nm). 167
Figure 3.9. (a-c) Stereomicroscopic images of selective liquid-liquid extraction of
orange II out of an aqueous binary mixture with methyl blue into the ionic liquid
compartment along the microchannel. All scale bars represent 300 μm. d, e) Chemical
structures of Orange II (OrII) and Methyl blue (MeB), respectively. 168
Figure 3.10. (a) A plot of the average color intensity (normalized) in the ionic liquid
versus time (L/v, where L is the distance along the microchannel and v is the velocity
of the compound drops; v=0.005 ms
-1
obtained using image analysis). Inset
stereomicrographs show the compound drops at the initial and final points along the
microchannel. (b) Schematic illustration of compound droplets formation in a
microchannel and on-drop liquid-liquid extraction (c) The plot shows the linear
variation of average orange II color intensity (normalized) versus its concentration in
ionic liquid. All scale bars represent 300 μm. 169
Figure 3.11. (a) Calculated streamlines in both aqueous and IL compartments, (b)
snapshots of concentration in both compartments at two different times, and (c)
normalized area averaged concentration (<C>*) in ionic liquid compartment as a
function of time (normalized with respect to diffusive time t
D
= w
2
/D). The area-
averaged concentration is observed to start leveling at normalized times of ~2x10
-3
,
indicating dramatic acceleration of mass transport by convection. 170
xx
Figure 3.12. Molecular structures of thymol blue at neutral and acidic pHs 171
Figure 3.13. (a) Stereomicroscopic images illustrating on-drop pH-sensing showing
the ionic liquid compartment gradually changing color (from yellow to deep pink) as
it translates along the length of the microchannel (b) A plot of average green intensity
(normalized) of the ionic liquid droplet against time (L/v, where L is the distance
along the microchannel and v is the velocity of the compound drops; v=0.005 ms
-1
obtained using image analysis) for two different pH values. The inset shows end-point
measurements, i.e. the measured time for the saturation of color in the ionic liquid
compartment at four different pH values. All scale bars represent 300 μm. 173
Figure 3.14. (a) Stereomicroscopic image of compound droplets generation at the
drop dispensing junction of a PDMS microfluidic device: merger of preformed
aqueous droplet (Aq) with a thin stream of ionic liquid (IL), producing ionic liquid-
aqueous (IL-Aq) bi-compartmental compound droplets flowing in continuous phase
(fluorinated oil, FO). (b) A schematic illustrating increase in fluorescence intensity
within the ionic liquid compartment of a compound droplet with time as it travels
along the microchannel. (c, d) Bright-field and dark-field stereomicroscopic images of
an IL-Aq compound droplet flowing in microchannel, respectively. e) a schematic
graph indicating increase in fluorescence intensity of IL compartment with time. Scale
bars= 300 µm. 175
Figure 3.15. (a) Stereomicroscope images showing increase in fluorescence intensity
within the ionic liquid compartment of a compound droplet with time as it travels
along the microchannel. Scale bar=300 µm. (b) Plots of normalized fluorescence
intensity of IL compartments flowing at different speeds. (constant concentration of
gold in aqueous compartment for all cases, 8.8mM). (c) Plots of normalized
xxi
fluorescence intensity of IL compartments versus time for two different gold
concentrations in the aqueous compartment, flowing at 4.5 mm/s. 175
Figure 3.16. Plot of normalized fluorescence intensity of IL compartments flowing at
different speeds against the distance (location) along the microchannel (constant
concentration of gold in aqueous compartment for all cases, 8.8mM). 178
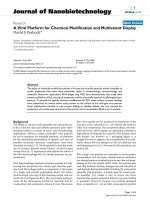
Figure 4.1. a) Schematics illustrating capillary-based microfluidic method to generate
poly (ionic liquid) microgels; inset shows a stereomicroscope image of a pre-polymer
droplet flowing in the transparent capillary tube. (b) Chemical structures of IL
monomer and PEGDA crosslinker. (c-e) Stereomicroscope images of PIL microgels
showing their monodispersity and transparency (average diameters of 1000µm,
515µm, 300µm, respectively). All scale bars are 300µm. (f) FESEM image of
synthesized PIL[Br]. Scale bar is 1mm 190
Figure 4.2. (a) Stereomicroscope images of samples of PIL[Br], PIL[ClO
4
] and
PIL[NTf
2
] microgels with visibly similar sizes in the dried state and with distinct sizes
in the hydrated state. All scale bars are 200µm. (b) Plot of percentage size change
(shrinkage/swelling) of hydrated PIL[Br] microgels after anion exchange with Cl
-
, I
-
,
MO
-
, TfO
-
, (NH
4
)S
2
O
8
-
, ClO
4
-
, PF
6
-
, NTf
2
-
. c) Plot of percentage size change of
PIL[Cl], PIL[NTf
2
] and PEGDA microgels (compared to the dried state) in various
solvents. 50 microbeads were used for each measurement. 200
Figure 4.3. Histograms showing the monodispersity in the size of anion exchanged
PIL microgels for the smallest PIL[NTf
2
], mid-size PIL[ClO
4
] and largest PIL[Cl]
along with the parent PIL microgels PIL[Br]. 201
Figure 4.4. (a) Stereomicroscope images of PIL[MO] microbead at pH 7 and during
controlled release of methyl orange from microbead to the surrounding medium at pH
xxii
0.5 (b) Measured diffusion profiles of MO from the PIL[MO] microbead to the
surrounding environment. All scale bars are 200µm. 203
Figure 4.5. (a) Plot of chromium (VI) adsorption capacity (Q
e
, Weight of adsorbed
component, mg/ weight of adsorbent, g) versus C
e
, concentration of potassium
dichromate solution for both experimental data and Langmuir fitted curve, (b) Plot of
C
e
/Q
e
at different concentrations of potassium dichromate solution. 204
Figure 4.6. Adsorption of Cr(VI): (a) Colorless PIL[Br] microgels before any
adsorption, (b) yellow color solution of 80 ppm Cr(VI) before the adsorption. (c)
disappearance of yellow color of original Cr(IV) solution due to adsorption (d) dark
yellow colored PIL microgels after adsorption of Cr(VI). (e) Br 3d peak is suppressed
and Cr 2P peak is appeared in XPS spectra of PIL microgels after Cr(VI) adsorption.
204
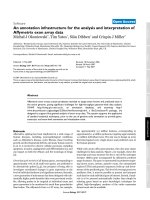
Figure 4.7. Six different sets of PIL[Br] microgels doped with their individual pH
indicators, exposed to successive increments in pH. All scale bars are 300 μm. 205
Figure 4.8. Reversible and recyclable pH-Strip with PIL microgels. (a) 3D pH Strip:
an assortment of six pairs of different pH indicator-doped PIL microgels (two beads
each contain the same pH indicator) are exposed to different pH solutions iteratively.
(b) Reversible pH sensing: pH indicator (Thymol blue)-doped PIL microgels
colorimetrically respond to the pH of the surrounding medium in a reversible fashion.
The reversibility has been successfully tested for at least 10 cycles without any
performance lost. All scale bars are 300μm. 206
Figure 4.9. Capillary-based reversible pH sensing using 3D-structured PIL microgels.
(a) Stereomicroscope images of 6 microgel beads containing individual pH indicators,
embedded in a glass capillary with square cross-section, which is successively
xxiii
exposed to flowing solutions of different pH. (b) Concept of a capillary-based 3D pH-
strip for reversible pH analysis. All scale bars are 1mm. 208
Figure 4.10. FTIR spectra of PEGDA monomer, PEGDA polymer, IL monomer and
poly(ionic liquid) PIL[Br]. 210
Figure 4.11. a) TGA curves for both PIL[Br] and IL monomer show similar primary
decomposition temperatures (~230ºC). The secondary decomposition temperature of
PIL[Br] at ~330 ºC indicates improvement of thermal stability presumably due to
crosslinking. b) XPS spectra show the presence of C-C, C-O, C-N bonds; thereby,
integration of imidazolium group into the polymeric material, and the presence of
counter anion, bromide, in the synthesized polymer PIL[Br]. 211
Figure 4.12. FTIR spectra and the corresponding signature peaks for PIL[NTf
2
],
PIL[I], PIL[PF
6
], PIL[S
2
O
8
], PIL[ClO
4
], PIL[TfO], PIL[MO] and PIL[Cl]. 211
Figure 4.13. EDX analysis confirm the exchange of parent anion, [Br], with anions
such as [MO]
-
, [NTf
2
]
-
and [PF
6
]
-
, The EDX spectra show the presence of
characteristic element(s) on the respective beads (a) Bromide ′Br′ on the surface of
PIL[Br] (b) Sulfur ′S′ on PIL[MO] (inset: EDX spectra of PIL microbead after HCl
induced slow release of MO; absence of the sulfur peak and prominent ′Cl′ peaks
indicate the ion exchange of MO with Cl) (c) Sulfur ′S′ and Fluorine ′F′ for PIL[NTf
2
]
(d) Fluorine ′F′ and Phosphorus ′P′ on the surface of PIL[PF
6
]. 214
Figure B 1.
1
H-NMR of synthesized ionic liquid [EMIM][NTf
2
] 234
Figure B 2.
1
H NMR of synthesized substrate 1. 234
Figure B 3.
1
H NMR of synthesized product 2. 235
Figure B 4.
1
H NMR of synthesized ionic liquid monomer 235
Figure B 5.
13
C-NMR of synthesized ionic liquid monomer 236
xxiv
List of Tables
Table 2.1. Density, viscosity and interfacial tension of [EMIM][NTf
2
] (* denotes
aqueous solution containing Rhodamine B) 126
Table 3.1. Comparison between pH of the aqueous phase (after the partitioning with
the IL phase) and pH of the original aqueous acid solution. (* Measurement
uncertainty ± 0.01) 174
Table 4.1. Comparison between the monomers and the polymerized product. 212
Table 4.2. Characteristic peaks for the corresponding anions in ion-exchanged PIL
microbeads. 213
xxv
List of Publications
JOURNAL ARTICLES
- Md. Taifur Rahman, Zahra Barikbin, Abu Zayed M. Badruddoza, Patrick S.
Doyle, and Saif A. Khan, " Monodisperse Polymeric Ionic Liquid Microgel Beads
with Multiple Chemically Switchable Functionalities “, accepted for publication in
Langmuir, 2013. (ZB and MTR are equal authors)
- Zahra Barikbin, Md. Taifur Rahman, and Saif A. Khan, " Fireflies-On-A-Chip:
Ionic Liquid-Aqueous Microdroplets for Biphasic Chemical Analysis", Small, 2012.
(ZB and MTR are equal authors)
- Zahra Barikbin, Md. Taifur Rahman, Pravien Parthiban, Anandkumar S. Rane,
Vaibhav Jain, Suhanya Duraiswamy, S. H. Sophia Lee, and Saif A. Khan, "Ionic
Liquid-Based Compound Droplet Microfluidics for ‘On-Drop’ Separations and
Sensing", Emerging Investigators Issue, Lab on a Chip, 2010, 10, 2458-2463.
PUBLICATIONS IN PROGRESS
- Zahra Barikbin, and Saif A. Khan, "Compound Droplets Behavior at Microchannel
Networks“, Manuscript under preparation, 2012/2013.
CONFERENCES
- Zahra Barikbin, Md. Taifur Rahman, Dominik Jarde, Abu Zayed M. Badruddoza,
Patrick S. Doyle, and Saif A. Khan, " Microfluidic Fabrication of Polymerized Ionic
Liquid Microgels “, Proceedings of the 16th International Conference on Miniaturized
Systems for Chemistry and Life Sciences (MicroTAS), 2012, Okinawa, Japan,
W.4.120.
- Zahra Barikbin, Md. Taifur Rahman, and Saif A. Khan, " Fireflies-On-A-Chip“,
Proceedings of the 12th International Conference on Microreaction Technology
(IMRET), 2012, Lyon, France, T-O-09, pp. 71-72.
- Zahra Barikbin, Md. Taifur Rahman, Saif A. Khan. “Microfluidics-Based
Compound Droplets: New Platform for Analytical Applications”, Proceedings of the