báo cáo khoa học đề tài Phân tích thông tin di truyền liên quan đến hiệu suất sử dụng đạm ở lúa
Bạn đang xem bản rút gọn của tài liệu. Xem và tải ngay bản đầy đủ của tài liệu tại đây (256.27 KB, 12 trang )
J. Sci. & Devel., Vol. 11, No. 6: 814-825 Tạp chí Khoa học và Phát triển 2013, tập 11, số 6: 814-825
www.hua.edu.vn
814
RICE NITROGEN USE EFFICIENCY: GENETIC DISSECTION
Nguyễn Thị Thúy Hạnh
1*
, Phạm Văn Cường
2
, Bertin Pierre
3
1
Department of Biology, Faculty of Biotechnology, Hanoi University of Agriculture, Vietnam;
2
Department of food crop science, Faculty of Agronomy, Hanoi University of Agriculture, Vietnam;
3
Earth and Life Institute, Faculty of Biological Engineering, Agriculture and Environment,
Université catholique de Louvain, Belgium
Email*:
Received date: 11.07.2013 Accepted date: 22.09.2013
ABSTRACT
A better understanding of genomic region might provide a genetic basic for the improvement of nitrogen use
efficiency (NUE). The objective of this study was to identify the genetic regions affecting NUE in rice through the
study of contrast cultivars and recombinant inbred lines (RILs) for QTLs analysis. A total of 169 RILs and their
parents IR64 and Azucena were cultivated in the same conditions under different nitrogen conditions in two
separated experiments. The WinQTL Cartographer version 2.5 was used to analyze joint QTL for multiple traits of
each experiment. The first mapping experiment showed a total of 44 QTLs for all 15 observed parameters including
number of leaves (NL), number of tillers (NT)
, plant height
(PH),
total fresh matter (FM), dry weight of roots (DWR),
dry weight of leaf
sheaths plus stems
(DWS), dry weight of leaf blades (DWL), total dry matter (DM), chlorophyll content
index (CCI), N concentration in roots (%NR), N concentration in leaf
sheaths plus stems
(%NS), N concentration in leaf
blades
(%NL), absorption NUE (aNUE), physiological NUE (pNUE) and agronomical NUE (agNUE) on chromosome
1, 2, 3, 4, 5, 6, 7, 8, 10 and 12. The second experiment detected 44 QTLs for NL, NT, PH, FM, DWR, DWS, DWL,
DM, CCI, %NR, %NL, aNUE and agNUE on chromosome 1, 2, 3, 5, 6, 7, 8 and 12.
Key words: nitrogen use efficiency (NUE), recombinant inbred lines (RILs), quantitative trait loci (QTL)
Phân tích thông tin di truyền liên quan đến hiệu suất sử dụng đạm ở lúa
TÓM TẮT
Những thông tin đầy đủ hơn về các vùng di truyền trong hệ gen sẽ là cơ sở cho việc nâng cao hiệu suất sử
dụng đạm ở cây trồng. Mục đích của nghiên cứu này nhằm xác định các vùng di truyền trong hệ gen của lúa có liên
quan đến hiệu suất sử dụng đạm thông qua việc phân tích QTL đối với các dòng thuần tái tổ hợp (RILs) từ hai dòng
bố mẹ Azucena và IR64. 169 RILs và hai dòng bố mẹ được trồng trong cùng điều kiệ
n môi trường trong phytotron
với các mức bón đạm khác nhau. Thí nhiệm được lặpp lại hai lần riêng biệt. Phần mềm WinQTL Cartographer
version 2.5 được sử dụng trong việc phân tích QTL với từng thí nghiệm riêng biệt. Thí nghiệm thứ nhất xác định
được 44 QTL cho 15 tính trạng theo dõi bao gồm: số lá (NL), số nhánh (NT), chiều cao cây (PH), tổng khối lượng
chất tươi (FM), khối lượng rễ khô (DWR), khối lượng thân và cuống lá khô (DWS), khối lượng phiến lá khô (DWL),
tổng khối lượng chất khô (DM), hàm l
ượng chlorophyll (CCI), hàm lượng N trong rễ (%NR), hàm lượng N trong thân
và cuống lá (%NS), hàm lượng N trong phiến lá (%NL), hiệu suất sử dụng đạm hấp thụ (aNUE), hiệu suất sử dụng
đạm sinh lý (pNUE), hiệu suất sử dụng đạm nông học (agNUE). Các QTL này nằm trên các nhiễm sắc thể 1, 2, 3, 4,
5, 6, 7, 8,10 và12. Thí nghiệm lặp lại thứ 2 xác định được 44 QTL cho các tính trạng: NL, NT, PH, FM, DWR, DWS,
DWL, DM,CCI, %NR, %NL, aNUE và agNUE trên các nhiễm sắc thể 1, 2, 3, 5, 6, 7, 8 và 12.
Từ khóa: Dòng thuần tái tổ hợp (RILs), hiệu suất sử dụng đạm (NUE), QTL.
Rice nitrogen use efficiency: Genetic dissectio
815
1. INTRODUCTION
Nitrogen (N) is a crucial macro nutrient
needed in the greatest amount of all mineral
elements required by plants. Rice plant takes
up nitrogen directly or indirectly from different
external sources such as nitrate, nitrites,
ammonia in soil (inorganic nitrogen); amino
acids in soil (organic form) and fertilizers.
Application of N is one of the major reasons that
crop production has kept pace with human
population growth. In general, crop plants are
able to utilize only 30- 40% of the applied N
(Raun and Johnson, 1999). Thus, more than
60% of the soil N is lost through a combination
of leaching, surface run-off, denitrification,
volatilization, and microbial consumption.
The excessive use of fertilizer not only
resulted in lower nitrogen use efficiency (NUE)
of plants but also wastes money and cause
adverse effects to our environment as well as to
human health. Overuse of N fertilization often
leads to a reduction in net returns and
groundwater contamination due to
NO
3
-N
leaching (
Hashimoto et al., 2007). These
concerns led the World Health Organization
to set limits on the amount of nitrates in
drinking water.
The
incomplete capture or
poor
conversion or excessive usage of N
fertilizer also plays a large role in
stratospheric ozone depletion and global
warming through
nitrous oxide emissions
(Wuebbles, 2009). The overuse of N
fertilizer is a reason of air pollution of
the
wider environment by ammonia emissions
(Misselbrook et al., 2000).
These are causing
serious N pollution and become a threat to
global ecosystems
(Giles, 2005).
Hence, developing crops that are less
dependent on the heavy application of N
fertilizer with high nitrogen use efficiency
is essential for the sustainability of
agriculture. It is estimated that a 1%
increase in NUE could save about $1.1
billion annually (Kant et al., 2011).
Advances in molecular marker technology
over the past decade have led to the
development of detailed molecular linkage
maps in rice (Harushima et al., 1998). QTL
mapping is the most available method
towards understanding the molecular
genetics mechanisms of complex
quantitative traits behind phenotypic
complexity (Guo et al., 2004; Zhang et al.,
2011). QTL mapping methods have been
adopted in studying nitrogen use efficiency
and related parameters in rice. Fang et al.
(2001) reported 8 QTLs for plant height
under nutrient solution culture and 13
QTLs under soil culture in DH population
of IR64/Azucena. In the research of 239
RILs from a cross between two indica
parents with two N levels, 12 QTLs for root
weight, 14 QTLs for shoot weight, 12 QTLs
for plant weight were identified by Lian et
al. (2005). A total of 7 QTLs for nitrogen
deficiency tolerance traits at seedling stage
(relative shoot dry weight, relative plant
dry weight, relative maximum root length,
relative plant height) in a RIL population of
two indica crosses were detected by Feng et
al. (2010). For NUE-a complex trait, some
QTLs were reported in previous studies.
One QTL on chromosome 6 was detected for
NUE by Shan et al. (2005) in a RIL
population of Zhenshan97/Minghui63- two
indica cultivars. Wei et al. (2011) when
investigated 127 RILs from
Zhenshan97/Minghui63 cross in the field
experiment concluded a total of 4 QTLs and
6 QTLs in another trial for NUE under two
N levels of N supply. Although
NUE has
been defined in various ways (Good et al., 2004):
absorption NUE (aNUE) was calculated by
dividing the total net N absorbed of plant by
unit of N applied; physiological NUE (pNUE)
was defined as the total net dried matter per
unit of N absorbed (Mosier et al., 2004);
agronomic NUE (agNUE) was computed by
dividing the total net dried matter to unit of
available soil N (native and applied) (Mosier et
al., 2004; Samborski et al., 2008),
no study has
been conducted mapping for all three
calculated NUEs under different N
Nguyễn Thị Thúy Hạnh, Phạm Văn Cường, Bertin Pierre
816
conditions. Moreover, information of the
loci or genes related to NUE in different
ways is very useful for breeders in
molecular marker assisted breeding.
Therefore, the objectives of this study were
to identify the QTLs for aNUE, pNUE, agNUE
and related parameters in rice at vegetative
stage under different N conditions and to gain a
better understanding that might be useful for
improving NUE of rice cultivars.
2. MATERIALS AND METHODS
2.1. Plant materials
The QTL analysis was performed using the
segregating population developed by the
Research Institute for Development (IRD) in
Montpellier, consisting of F
9-10
recombinant
inbred lines (RILs) obtained by the single-seed
descent method from a cross between IR64 (O.
sativa L. subsp. indica), considered insensitive
to nitrogen supply under low N condition and
Azucena (O. sativa L. subsp. japonica), an
intermediate cultivar between sensitive and
insensitive group (Namai et al., 2009; Hamaoka
et al., 2013).
2.2. Nitrogen application
The standard Yoshida solution (Yoshida et
al., 1976) with the nitrogen source of 1.43mM
NH
4
NO
3
was used as the control and considered
as 1X.
For the experiment during period
from
February 15
th
to April 10
th
, 2011 (the first
replication) two
different nitrogen
concentrations of Yoshida solution: 1X and ¼X
with 1.43mM and 0.358mM NH
4
NO
3
were
applied.
For the experiment during period
from
October 5
th
to November 30
th
, 2011 (the second
replication) three
different nitrogen
concentrations of Yoshida solution: 1X, ¼X and
1/8X with 1.43mM, 0.358mM, and 0.179mM
NH
4
NO
3
were used.
The choice of the N supplies in the
nutritive solution of the treated plants and
the duration of the treatment was based on the
result obtained from our previous study on
effect of different nitrogen concentration to
components of NUE and related parameters in
rice plants under hydroponic culture.
2.3. Growth conditions and screening of
the population
The experiment was conducted under
hydroponic culture in phytotron at Université
Catholique de Louvain, Belgium and
replicated twice in 2011. The first replication
was implemented from February 15
th
to April
10
th
, 2011and the second, from October 5
th
to
November 30
th
, 2011. Each replication
consisted of three replicate.
The seeds of each RIL and the parent
cultivars were sown in Petri dishes lined with
Whatman
No.1
filter paper
moistened
with 10
ml demineralized water for 3 days. The
germination was maintained at 28
o
C
, 12-h day
length and 120
µ
mol m
-2
s
-1
light intensity
.
The germinated seeds of each RIL and the
parents were selected to ensure the
homogeneous germination.
For all three
independent replicate of each experiment, two
or three seeds of each RILs and the parents
were placed on
each hole within perforated
extruded polystyrene plates. The polystyrene
plates were kept floating on 26L
-
tank
consisting standard rice nutrient solution
(Yoshida et al., 1976) in a phytotron for 2
weeks. Each plate in each tank contained seeds
of 44 RILs, Azucena and IR64 cultivar.
The
growth condition was maintained at 30/25
o
C
day/night, 85-95% relative humidity and 12-h
photoperiod with 360µmol m
-2
s
-1
light intensity.
After two weeks,
one healthy and
homogeneous
seedling per each hole
within
perforated extruded polystyrene plates
was
selected. After two times of selection one for
homogeneous germination
, one for
homogeneous
seedling- 169 RILs observed for the first
experiment and 158 RILs for the second
experiment.
Thus the total of 1,062 plants from
24 tanks for experiment in period
from February
Rice nitrogen use efficiency: Genetic dissectio
817
15
th
to April 10
th
, 2011and 1494 plants from to
36 tanks
for experiment during period
from
October 5
th
to November 30
th
, 2011 were
screened and individually observed.
The nutrient of the control and treated
solutions was renewed once a week. The pH of
the solution was daily adjusted to 4.5 (Wu et
al.,1998) using 1M KOH and 1M HCl.
Treatments and plants in the experiment were
completely randomized towards the
environmental conditions by re-arranging the
tanks every two days in phytotron.
2.4. Phenotypic data
Four weeks after treatment
all the plants
were evaluated for chlorophyll content index
(CCI), plant height
(PH), number of leaves
(NL), number of tillers (NT)
, fresh weight of
leaf blades (FWL), fresh weight of leaf
sheaths
plus stems
(FWS), fresh weight of roots (FWR),
total fresh matter (FM), dry weight of leaf blades
(DWL), dry weight of leaf
sheaths plus stems
(DWS), dry weight of roots (DWR), and total dry
matter (DM) on a single plant basis from all
three replicate across all RILs and the parents
and different nitrogen levels. The chlorophyll
content index was measured on the middle upper
face of the youngest fully expanded leaf using a
Chlorophyll Content Meter (CCM8200 model,
Opti-Sciences, Hudson, USA).
At harvest, the plants were cut at collar,
and then separated into three parts: leaf
blades, leaf sheaths plus stems, and roots. The
fresh weights were measured right after
separating. The dried weights were determined
after oven drying at 60
o
C to a constant weight.
The total dry weight (DM)
was determined as
the sum of dry weight of three separated
organs, i.e. dry weight of leaf blades (DWL), dry
weight of leaf
sheaths plus stems
(DWS), dry
weight of roots (DWR).
A selection procedure was applied to the RILs
in order to study the remaining parameters,
which were too time-consuming and costly to
allow the analysis on each of the 169 RILs and
their parents. The RILs were classified according
to their relative variation of dry matter by
comparing plant dry matter of the control and
the treatments according to the formula:
Relative variation of dry matter = [(DM
control plant - DM treated plant) / DM control
plant)] x 100
The RILs with extreme value were chosen
to analyze N concentration. Ten RILs that
expressed the minimum values of relative
variation and other ten RILs that had the
maximum values were used in the first
experiment and twenty RILs/each extreme sides
were selected for second experiment. For both of
experiments, parental cultivars-IR64 and
Azucena/each tank were analyzed for N tissue
concentrations.
2.5. Nitrogen tissue concentration
The oven-dried leaf blades, leaf sheaths plus
stem and roots of selected RILs and parental
cultivars at two and three different nitrogen
doses of the first and the second experiment,
respectively, were ground separately to obtain
fine powdered samples. Six mg of each sample
were used for analysis of nitrogen concentration
by using FLASH NC Analyzers (Model AE1112,
CE Instruments UK).
2.6. NUE calculation
The nitrogen use efficiencies (NUEs) were
calculated as follows:
Physiological NUE (pNUE) = [Total dry matter
(g plant
-1
)]/[Total N absorbed (g plant
-1
)] [1]
Absorption NUE (aNUE) = [Total N
absorbed (g plant
-1
)]/[Total N applied (g)] [2]
Agronomical NUE (agNUE) = [Total dry
matter (g plant
-1
)]/[Total N applied (g)] [3]
The N absorption in each organ was
calculated by multiplying of N concentration
with dry weight of organ. The total net
absorbed N was determined as the sum of N
accumulation in all three organs. The total
applied N was calculated basing on the N
supply in culture solution in 2 weeks for
germination and 4 weeks for treatments.
Nguyễn Thị Thúy Hạnh, Phạm Văn Cường, Bertin Pierre
818
2.7. Statistical analysis and QTL mapping
Data analysis was performed with the SAS
statistical program (version 9.2, SAS Institute,
North Carolina, USA). The ANOVA assumption
of normality was checked for all analyzed data.
The effect of lines, N deficiency treatment and
repetition on the parameters measured was
tested using a three-way ANOVA, mixed model
with three crossed factors: two fixed factors
(lines and treatments) and one random
factor (repetition).
The map consists of 228 marker loci, the
allelic composition for each of the 169 RILs and
their parents for each marker locus was
determined by Ahmadi et al. (2005). The
average genetic distance between the markers
was about 7cM with a maximum distance of
23cM and a minimum of 0.2cM. QTLs were
analyzed jointly by composite interval mapping
for multiple traits of each experiment (Dufey et
al., 2009) using the Windows QTL Cartographer
software package version 2.5. The walking
speed chosen for all QTL analyses was 2cM. The
threshold for declaring a QTL for the various
traits was from 3.0 as a minimum. If the LOD
score exceeded the threshold, the position with
the highest LOD score on each chromosome was
estimated as the most likely position of the
QTL. To present a QTL on the map, the
chromosome region corresponding to a LOD
greater than the maximum LOD minus 1 was
selected, called an LOD-1 interval (Hirel et al.,
2001) and considered as position interval.
Fort traits that were measured only on 20
RILs (N tissue concentrations and derived
parameters-NUEs) in the first experiment or 40
RILs in the second experiment, phenotypic
values of non-measured individuals were
included into the analysis as missing values
in order to avoid biased estimates of QTL effects
(Lander and Botstein, 1989).
3. RESULTS AND DISCUSSION
3.1. Performance of RILs and parents
Chlorophyll content index (CCI), plant
height
(PH), number of leaves (NL), number
of tillers (NT)
, fresh weight of leaf blades
(FWL), fresh weight of leaf
sheaths plus stems
(FWS), fresh weight of roots (FWR), total fresh
matter (FM), dry weight of leaf blades (DWL),
dry weight of leaf
sheaths and stems
(DWS),
dry weight of roots (DWR), total dry matter
(DM), N concentration in leaf blades (%NL), N
concentration in leaf
sheaths plus stems
(%NS), N concentration in roots (%NR) and
derived parameters, i.e., absorption NUE
(aNUE), physiological NUE (pNUE) and
agronomical NUE (agNUE) were investigated
under normal and low N conditions. All traits
segregated continuously and almost fitted
normal distribution under all N supplied (Data
not shown). The frequency distributions
showed more extreme values than the parents
for most of parameters suggested that both
parents may carry interesting alleles for NUE
and related traits.
3.2. Identifying QTLs for N-related traits
The joint QTL analysis of supplied N levels
for multiple traits of each experiment was
performed. The result of the first experiment
revealed a total of 44 QTLs. Among of them 36
QTLs were detected for NUE-related traits
(Table 1). These QTLs were located on
chromosomes 1, 2, 3, 4, 5, 6, 7, 8, 10 and 12
(Figure 1). The result of second experiment
revealed a total of 44 QTLs with 36 QTLs for
NUE-related traits (Table 2). These QTLs were
located on chromosomes 1, 2, 3, 5, 6, 7, 8 and 12
(Figure 2). The probable position of the QTLs
(Figure 1, 2) was determined as described by
Hirel et al. (2001), by LOD-1 from the
maximum. When two LOD peaks fell in a
common support interval, it was considered that
only one QTL was present and its approximated
position was given by the greatest peak. For
this reason, a total of 42 QTLs are presented in
Figure 1 instead of 44 QTLs for the first
experiment and 35 QTLs are presented in
Figure 2 instead of 44 for the second
experiment.
In the present study, joint QTL for multiple
traits was undertaken using a RIL population of
Rice nitrogen use efficiency: Genetic dissectio
819
Table 1. Joint QTLs analysis for number of leaves (NL), number of tillers (NT), plant
height (PH), total fresh matter (FM), dry weight of roots (DWR), dry weight of sheaths
plus stem (DWS), dry weight of leaf blades (DWL), total dry matter (DM), chlorophyll
content index (CCI), N concentration in roots (%NR), N concentration in sheaths plus
stem (%NS), N concentration in leaf blades (%NL), absorbed NUE (aNUE), physiological
NUE (pNUE), and agronomical NUE (agNUE) of the first experiment
No.QTL Trait
a
Chromosome
number
b
Marker Interval
c
Position(cM)
d
Joint LOD score
e
Interval
Position(cM)
f
1 NL 2 RM250-RM166 136.20 3.36 131.5-136.3
2 7 RM214-RM2819 19.94 3.12 12.4-32.2
3 8 RM080-RM230 124.21 5.17 117.5-128.5
4
12 RM020a-RM004a 11.83 3.16 4.1-19.4
5 NT 5 RM440-RM188 88.46 3.82 76.9-95.7
6 5 RM538-RM274 110.17 4.23 106.8-118.1
7 7 RM481-RM125 5.76 3.49 4.5-11.6
8 8 RM433-RM230 124.21 3.10 118.1-129.9
9
10 RM171-RM294a 74.38 3.91 69.1-78.1
10 PH 1 RM431-RM165 155.06 3.55 148.5-155.1
11
3 RM468-RM143 163.66 3.09 154-169.9
12 FM 5 RM440-RM188 88.46 4.08 79.0-96.1
13 DWR 3 RM2334-RM426 112.21 4.88 105.7-114.6
14 3 RM468-RM143 157.66 3.54 151.6-167.5
15 3 RM514-RM442 170.59 3.29 167.7-170.6
16
5 RM440-RM188 91.46 4.48 86.0-97.7
17 DWS 3 RM293-RM468 151.19 3.23 143.8-165.5
18 5 RM440-RM188 91.46 3.45 77.9-99.5
19 7 RM481-RM125 5.76 4.13 2.0-12.5
20
8 RM433-RM230 124.21 3.10 117.9-129.6
21 DWL 3 RM468-RM143 157.66 3.15 151.6-169.9
22
5 RM440-RM188 91.46 3.16 76.9-98.7
23 DM 3 RM468-RM143 157.66 3.10 144.1-167.0
24
5 RM440-RM188 88.46 3.30 77.3-98.1
25 CCI 4 RM261-RM307 22.97 3.49 20.5-26.2
26 %NR 1 RM476a-RM084 14.09 3.09 12.2-25.4
27 2 RM279-RM423 17.15 4.24 10.5-20.4
28
5 RM289-RM509 46.60 3.54 37.2-54.6
29 %NS 1 RM443-RM403 106.58 4.25 102.9-110.2
30 3 RM016-RM135 102.17 3.54 96.7-106.0
31
6 RM275-RM030 88.83 3.23 86.5-93.7
32 %NL 1 RM265-RM315 129.78 6.33 128-131.1
33 1 RM472-RM431 137.65 11.44 134.7-141.5
34 3 RM135-RM503 105.98 5.54 99.7-115.1
35 3 RM2334-RM426 112.21 5.34 98.5-115.4
36
3 RM055-RM3199 126.82 4.01 121.6-131.1
37 aNUE 2 RM526-RM221 109.63 6.71 106.3-110.5
38 2 RM221-RM318 114.41 6.71 113.2-118.3
39 5 RM413-RM153 13.93 4.20 10.7-16.1
40
5 RM153-RM013 23.07 4.45 18.5-29.0
41 pNUE 1 RM319-RM265 122.46 4.60 120.4-140.7
42
1 RM315-RM472 131.82 5.32 128.0-137.3
43 agNUE 3 RM468-RM143 157.66 3.75 145.7-166.2
44
5 RM440-RM188 91.46 3.56 78.7-98.0
a
Parameter analyzed;
b
Chromosome number where the QTL were detected.;
c
Marker interval in which is located the most
probable position of the QTL (LOD score maximum);
d
Most probable position of the QTL (in cM);
e
Likelihood ratio;
f
Position interval in which is located the probable position of the QTL (by LOD-1 support interval).
Nguyễn Thị Thúy Hạnh, Phạm Văn Cường, Bertin Pierre
820
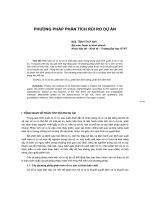
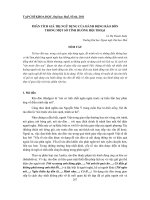
Figure1. Location of joint QTLs for number of leaves (NL), number of tillers (NT), plant
height (PH), total fresh matter (FM), dry weight of roots (DWR), dry weight of sheaths
plus stem (DWS), dry weight of leaf blades (DWL), total dry matter (DM), chlorophyll
content index (CCI), N concentration in roots (%NR), N concentration in sheaths plus
stem (%NS), N concentration in leaf blades (%NL), absorbed NUE (aNUE), physiological
NUE (pNUE), and agronomical NUE (agNUE) of the first experiment
Rice nitrogen use efficiency: Genetic dissectio
821
an IR64/Azucena cross in two separated
experiments under normal and N deficiency
conditions. Several common regions, on which
some QTLs for several traits were located, were
found within each experiment. The
commonalities between two experiments also
were detected.
In the first experiment the common regions
were found on chromosome 1 (from 119cM to
137cM flanked by RM265-RM431); on
chromosome 3 (91-116cM and 142-170cM
positioned from RM016 to RM186 and from
RM468 to RM442); on chromosome 5 (70-102cM
presented for RM440-RM538) and on
chromosome 8 (106-129cM, RM080-RM281)
(Figure 1). The common region on chromosome
1 contained the QTLs of %NL and pNUE. The
common regions on chromosome 3 included the
QTLs of %NS, %NL, PH, DWR, DWS, DWL,
DM. The QTLs of NT, FM, DWR, DWS, DWL,
DM were detected on the common region of
chromosome 5 and the common one on chromosome
8 were the locations of QTLs of NLNT, DWS. In the
second experiment the common regions were
detected on chromosome 3 (126-151cM,
RM3199-RM143) and chromosome 8 (106-
129cM, RM080-RM281) (Figure 2). The common
region on chromosome 3 included the QTLs of
NL, PH, FM, DWR, DWS, DWL and DM. The
QTLs of NL, FM, DWR, DWS, DWL, DM were
detected on the common region of chromosome
8. The common regions for several traits
highlight the linkage between parameters
analyzed (Dufey et al., 2009) and suggested that
these regions should be highly involved in
expression of N effect and NUE traits.
The analysis of the first and second
experiment showed that the QTLs for the traits
detected separately in two experiments were
mostly different, although several QTLs were
found to have the confidence interval
overlapped such as DWS, DWL, DM on
chromosome 3; NL, DWS on chromosome 8 or
on very close regions, i.e., PH on chromosome 1,
3; DWR, DWL on chromosome 3 (Figure 1, 2).
Although it is not possible to rule out the
possibility of two QTLs in close linkage, it is
more likely that it is the same QTL with
pleiotropic effects on these two traits. Besides
that, the commonalities on chromosome 1 (119-
137cM), on chromosome 3 (142-170cM) and on
chromosome 8 (106-129 cM) were also
identified. The certain commonalities existed
within each experiment and between
experiments as reflected by the QTL hotspots
(Lian et al., 2005).
In this study the hotspot flanked by
RM3199- RM514 on chromosome 3 containing
several QTLs of PH, FM, DWR, DWS, DWL,
DM has been reported for QTL of DWR, DWS
by Dufey et al. (2009) using the same RIL
population of an IR64/Azucena cross with the
same marker map. Wei et al. (2012b) found that
this region was associated with grain filling
ratio, 1000-grain weight in the study of RILs
derived from two indica Zhenshan 97 x Minghui
63. The region on chromosome 1 within interval
RM319-RM165 containing QTL for PH has also
been identified by Fang and Wu (2001) in the
research of DH population from across between
IR64 and Azucena. The genomic region RM174-
RM324 on chromosome 2 that was found to
contain the QTL for NT in the first experiment
has been reported to have QTL for PH by Liang
et al. (2011) in RILs of two indica Xieqingzao
B/Zhonghui 9308 cross. The region flanked by
RM475-RM5430 on chromosome 2 found to
contain the QTL for CCI in the second
experiment has been identified for QTLs of
grain yield simultaneously under low and
normal N by Wei et al. (2012b).
3.3. Identifying QTLs for NUE traits
A total of 8 QTLs were detected for pNUE,
aNUE and agNUE on chromosome 1, 2, 3 and 5 in
the first experiment (Table 1 and Figure 1). Two
QTLs for pNUE with LOD peaks fell in a common
support interval, therefore only one QTL with the
greatest peak was present. Four QTLs for aNUE
were located on chromosome 2 and 5; two QTLs
for agNUE were positioned on chromosome 3 and
5. In the second experiment, a total of 8 QTLs
were identified for aNUE and agNUE on
chromosome 3, 6, 7 and 8 (Table 2 and Figure 2).
Among these QTLs, two QTLs for aNUE and
agNUE were detected at the same genomic region
RM3199-RM143 on chromosome 8. This region was
Nguyễn Thị Thúy Hạnh, Phạm Văn Cường, Bertin Pierre
822
Table 2. Joint QTLs analysis for number of leaves (NL), number of tillers (NT), plant
height (PH), total fresh matter (FM), dry weight of roots (DWR), dry weight of sheaths
plus stem (DWS), dry weight of leaf blades (DWL), total dry matter (DM), chlorophyll
content index (CCI), N concentration in roots (%NR), N concentration in sheaths plus
stem (%NS), N concentration in leaf blades (%NL), absorbed NUE (aNUE), physiological
NUE (pNUE), and agronomical NUE (agNUE) of the second experiment
No.QTL Trait
a
Chromosome
number
b
Marker Interval
c
Position(cM)
d
Joint LOD
score
e
Interval
Position (cM)
f
1 NL 3 RM489-RM036 36.40 3.70 31-41.9
2 3 RM416-RM293 135.63 4.22 130-141.1
3 7 RM125-RM214 11.57 3.28 9.6-13.5
4 8 RM210-RM080 115.93 4.97 109.2-130.2
5 8 RM433-RM230 124.21 5.84 119-128.9
6 12 RM453-RM247 32.10 3.13 29.2-31.7
7 12 RM512-RM101 53.75 3.77 44.6-60.3
8
12 RM7018-RM270 91.20 3.06 78.8-97.2
9 NT 2 RM492-RM452 40.15 3.10 34.6-43.4
10
12 RM7018-RM270 91.20 4.87 85-97.9
11 PH 1 RM319-RM265 125.46 5.16 119.4-142.1
12 1 RM315-RM472 134.82 6.16 127.7-139.5
13
3 RM293-RM468 142.19 3.02 137.5-148.9
14 FM 3 RM3199-RM416 132.81 4.25 129.3-150
15 3 RM293-RM468 142.19 5.30 137.2-146.4
16
8 RM433-RM230 121.21 3.60 111-129.6
17 DWR 3 RM3199-RM416 132.81 3.95 128.1-149.1
18 3 RM293-RM468 142.19 4.88 136.8-146.1
19
8 RM433-RM230 124.21 3.44 111.7-129.6
20 DWS 1 RM005-RM034 85.99 3.77 81.1-89.6
21 3 RM055-RM3199 129.82 4.22 127.2-148
22 3 RM055-RM3199 142.19 4.46 128.1-147.1
23 8 RM433-RM230 118.21 3.99 110.8-128.8
24
12 RM453-RM247 32.10 3.05 28.9-36.5
25 DWL 3 RM3199-RM416 132.81 3.59 128.6-151.6
26 3 RM293-RM468 142.19 4.57 136.6-147.7
27
8 RM433-RM230 118.21 4.33 111.8-129.3
28 DM 3 RM3199-RM416 132.81 4.12 127.9-148.9
29 3 RM293-RM468 142.19 4.80 129.5-146.8
30
8 RM433-RM230 121.21 3.99 110.8-130
31 CCI 2 RM561-RM341 64.15 3.42 60.9-68.4
32 2 RM341-RM475 77.55 3.97 70.7-82.4
33 3 RM055-RM3199 129.82 5.37 125.6-132
34
3 RM416-RM293 135.63 4.62 123.8-140.7
35 %NR 3 RM143-RM514 167.70 3.40 157.8-170.5
36 %NL 5 RM473b-RM163 65.18 4.05 57.4-75.4
37 aNUE 3 RM055-RM3199 126.82 3.57 123.6-131.5
38 6 RM527-RM003 54.56 3.66 50.8-56.1
39 6 RM465b-RM541 65.90 3.39 58.9-78.1
40 7 RM118-RM429 77.12 3.80 72.5-83.6
41
8 RM210-RM080 115.93 7.23 110.8-122.6
42 agNUE 3 RM3199-RM416 132.81 4.13 127.9-149.1
43 3 RM293-RM468 142.19 4.82 129.7-146.6
44
8 RM433-RM230 121.21 3.99 111-130
a
Parameter analyzed;
b
Chromosome number where the QTL were detected;
c
Marker interval in which is located the most
probable position of the QTL (LOD score maximum);
d
Most probable position of the QTL (in cM);
e
Likelihood ratio
f
Position interval in which is located the probable position of the QTL (by LOD-1 support interval).
Rice nitrogen use efficiency: Genetic dissectio
823
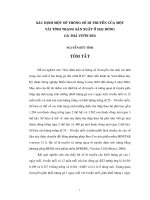
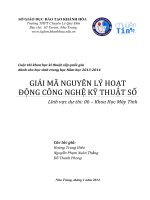
Figure 2. Location of joint QTLs for number of leaves (NL), number of tillers (NT), plant
height (PH), total fresh matter (FM), dry weight of roots (DWR), dry weight of sheaths
plus stem (DWS), dry weight of leaf blades (DWL), total dry matter (DM), chlorophyll
content index (CCI), N concentration in roots (%NR), N concentration in sheaths plus
stem (%NS), N concentration in leaf blades (%NL), absorbed NUE (aNUE), physiological
NUE (pNUE), and agronomical NUE (agNUE) of the second experiment
Nguyễn Thị Thúy Hạnh, Phạm Văn Cường, Bertin Pierre
824
identified as a hotspot containing QTLs of N-
related traits. The presence of common QTLs for
several traits suggested that they can be
improved simultaneously. Two QTLs for agNUE
on chromosome 3 had LOD peaks fell in a
common support interval, so only one QTL was
presented.
In these QTLs, some QTLs were new ones
and some QTLs were matched with the QTLs of
NUE in the previous reports. The genomic region
flanked by RM3199 and RM143 on chromosome
3 was detected for QTLs of aNUE, agNUE and
some N-related traits (NL, PH, FM, DWR, DWS,
DWL and DM). Senthilvel et al. (2008) found
that this region was associated with NUE in
their research of DH population derived from
IR64/Azucena cross. Although it was difficult to
say whether the chromosomal locations of QTLs
are the same due to the lack of common markers,
Wei et al. (2012a) detected a QTL for NUE on
chromosome 3 which is very close to QTL of
agNUE in the first experiment by using RILs
cross from two indica. Wei et al. (2012a) also
identified a QTL for NUE at overlapped genomic
region of aNUE on chromosome 7 in the second
experiment. In the genomic regions of RM 527-
RM003 and RM 465b-RM030 on chromosome 6,
where aNUE QTLs was detected in the present
sudy, two QTLs for PH was positioned by Liang
et al. (2011).
4. CONCLUSION
Among 44 QTLs in the first experiment and
44 QTLs in the second experiment for aNUE,
pNUE, agNUE and other N-related traits under
normal-N and low-N conditions, the QTLs for
agNUE, DWS, DM on chromosome 3 and the
QTLs for NL, DWS on chromosome 8 were
identified in both experiments at the same or
overlapped genomic regions. Several hotspots
flanked by RM265- RM165 on chromosome 1,
by RM3199- RM514 on chromosome 3, by
RM080- RM281 on chromosome 8 containing
QTLs for aNUE, pNUE, agNUE and some other
traits were identified. This suggested that these
genomic regions could be used as targets for a
better understanding of NUE and for improving
NUE traits.
ACKNOWLEDGEMENTS
We thank the Research Institute for
Development (IRD) and the International
Cooperation Center in Agronomical Research
for Development (CIRAD) in Montpellier
(France) for their collaboration in this study by
providing the segregating population and the
genotypic map of the markers for the
recombinant inbred lines (RILs) – European
project EGRAM. This work was supported by
CUD (Commission universitaire pour le
Developpment) scholarship program, Belgium.
REFERENCES
Ahmadi N., Dubreuil-Tranchant C., Courtois B.,
Foncéka D., This D., Mc Couch S.R., Lorieux M.,
Glaszmann J.C. and Ghesquière A. (2005). New
resources and integrated maps for IR64 x
Azucena, a reference population in rice. In:
IRRI 5th International Rice Genetics
Symposium and 3
rd
International Rice Functional
Genomics Symposium, Manila, Philip, 19823
November 2005. sl:sn, 1p. International Rice
Genetics Symposium. 5, 2005811819/2005811823,
Manille, Philippines.
Dufey, I., Hakizimana, P., Drayer, X., Lutts, S. and
Bertin, P. (2009). QTL mapping for biomass and
physiological parameters linked to resistance
mechanisms to ferrous iron toxicity in rice.
Euphytica 167:143-160. DOI 10.1007/s10681-008-
9870-7
Fang P. and Wu P. (2001). QTL × N-level
interaction for plant height in rice (
Oryza
Sativa
L.). Plant and Soil 236: 237-242.
Feng Y., Cao L.Y., Wu W.M., Shen X.H., Zhan X.D.,
Zhai R.R., Wang R.C., Chen D.B. and Cheng S. H.
(2010). Mapping QTLs for nitroge n- deficiency
tolerance at seedling stage in rice (Oryza sativa
L.). Plant Breed 129:652- 656
Giles, J. 2005. Nitrogen study fertilizes fears of
pollution. Nature 433:791.
Glass A.D.M., (2003). Nitrogen use efficiency of crop
plants: physiological constraints upon nitrogen
absorption. Critical Reviews in Plant Sciences 22:
453-470.
Good A.G., Shrawat A.K. and Muench D.G. ( 2004).
Can less yield more? Is reducing nutrient input into
Rice nitrogen use efficiency: Genetic dissectio
825
the environment compatible with maintaining crop
production? Trends in Plant Science 9: 597-605.
Guo L.B., Zhu L.H., Xu Y.B., Zeng D.L., Wu P.
and Qian Q. (2004). QTL analysis of seed
dormancy in rice (Oryza sativa L.). Euphytica
140:155-162.
Hamaoka N., Uchida Y., Tomita M., Kumagai E.,
Araki T. and Ueno O. (2013). Genetic Variations
in Dry Matter Production, Nitrogen Uptake, and
Nitrogen Use Efficiency in the AA Genome Oryza
Species Grown under Different Nitrogen
Conditions. Plant Prod. Sci. 16(2): 107-116.
Hashimoto M., Herai Y., Nagaoka T. and Kouno K.
(2007). Nitrate leaching in granitic regosol as
affected by N uptake and transpiration by corn.
Soil Sci. Plant Nutr. 53:300-309.
Hirel B., Bertin P., Quillere I., Bourdoncle W.,
Attagnant C., Dellay C., Gouy A., Cadiou S.,
Retailliau C. and Falque M.(2001). Towards a
better understanding of the genetic and
physiological basis for nitrogen use efficiency in
maize. Plant Physiol 125: 1258-1270
Kant S., Bi Y.M. and Rothstein S.J. (2011).
Understanding plant response to nitrogen limitation
for the improvement of crop nitrogen use
efficiency. Journal of Experimental Botany. 62 (4):
1499-1509
Lander E.S. and Botstein D. (1989). Mapping
mendelian factors underlying quantitative traits
using RFLP linkage maps. Genet. 121: 185-199.
Lian X., Xing Y., Yan H., Xu C., Li X., Zhang Q.
(2005). QTLs for low nitrogen tolerance at
seedling stage identified using a recombinant
inbred line population derived from an elite rice
hybrid. Theor Appl Genet 112:85– 96
Liang Y., Gao Z., Shen X., Zhan Xi., Zhang Y.,
Wu W., Cao L. and Cheng S. (2011). Mapping
and Comparative Analysis of QTL for Rice
Plant Height Based on Different Sample Sizes
within a Single Line in a RIL Population. Rice
Science, 18(4): 265-272
Misselbrook T.H., van der Weerden T.J., Pain B.F.,
Jarvis S.C., Chambers B.J., Smith K.A., Philips
V.R. and Demmers T.G.M. (2000). Ammonia
emission factors for UK agriculture.
Atmospheric Environment 34: 871-880.
Mosier A., Syers J.K. and Freney J.R. (2004).
Agriculture and the nitrogen cycle. Assessing the
impacts of fertilizer use on food production and the
environment. SCOPE 65. Washington, DC: Island
Press.
Namai S., Toriyama K. and Fukuta Y. (2009). Genetic
variation in dry matter production and
physiological nitrogen use efficiency in rice (Oryza
sativa L.) varieties. Breeding Science 59: 269-276.
Raun W.R., Johnson G.V. (1999). Improving nitrogen
use efficiency for cereal production. Agronomy
Journal 91: 357-363.
Samborski S., Kozak M. and Azevedo R.A. (2008).
Does nitrogen uptake affect nitrogen uptake
efficiency, or vice versa? Acta Physiologiae
Plantarum. 30:419-420.
Senthilvel S., Vinod K.K., Malarvizhi P. and
Maheswaran M. (2008). QTL and QTL ×
Environment Effects on Agronomic and
Nitrogen Acquisition Traits in Rice. Journal of
Integrative Plant Biology.50(9):1108-1117
Shan Y.H., Wang Y.L., Pan X.B. (2005). Mapping of
QTLs for nitrogen use efficiency and related traits
in rice ( Oryza sativa L). Acta Agron Sin.
4(10):721-727.
Wei D., Cui K.H., Pan J.F., Ye G.Y., Xiang J., Nie
L.X., Huang J.L. (2011). Genetic dissection of
grain nitrogen use efficiency and grain yield and
their relationship in rice. Field Crops Res. 124:
340-346.
Wei D., Cui K., Pan J., Wang Q., Wang K., Zhang
X., Xiang J., Nie L. and Huang J. (2012b).
Identification of quantitative trait loci for
grain yield and its components in response to
low nitrogen application in rice. AJCS. 6(6):
986-994. ISSN: 1835-2707.
Wei D., Cui K., Ye G., Pan J., Xiang J., Huang J.
and Nie L. (2012a). QTL mapping for
nitrogen-use efficiency and nitrogen-
deficiency tolerance traits in rice. Plant Soil,
359: 281-295.
Wu P., Hu B., Liao C.Y., Zhu J.M., Wu Y.R.,
Senadhira D. and Paterson A.H. (1998).
Characterization of tissue tolerance to iron by
molecular markers in different lines of rice. Plant
Soil 203: 217-226.
Wuebbles D.J. (2009). Nitrous oxide: no laughing
matter. Science. 326: 56-57.
Yoshida S., Forno D.A., Cock J.H. and Gomez K.A.
(1976). Laboratory manual for physiological
studied of rice. 3
rd
edn. Int Rice Res Inst, Manila.
Zhang X.Q., Zhang G.P., Guo L.B., Wang H.Z., Zeng
D.L., Dong G.J., Qian Q. and Xue D.W. (2011).
Identification of quantitative trait loci for Cd and
Zn concentrations of brown rice grown in Cd-
polluted soils. Euphytica 180:173-179.