master limited partnerships (3rd edition)
Bạn đang xem bản rút gọn của tài liệu. Xem và tải ngay bản đầy đủ của tài liệu tại đây (2.55 MB, 100 trang )
Please see page 93 for rating definitions, important disclosures and required analyst certifications.
WCM does and seeks to do business with companies covered in its research reports. As a result, investors should be aware that the firm may have a conflict of interest
that could affect the objectivity of the report and investors should consider this report as only a single factor in making their investment decision.
MLP071408-233712
A publication of
WACHOVIA CAPITAL MARKETS, LLC
Equity Research
MLP Primer Third Edition
Everything You Wanted To Know About MLPs, But Were Afraid To Ask
• Primer Third Edition – A Framework For Investment. This report is an update
to our second master limited partnership (MLP) primer. In this third edition, we
have added new information based on questions and feedback received from
investors over the past three years. Included in this edition are updated data about
MLPs’ relative performance, the growth of MLPs as an asset class, and
developments within the MLP sector (e.g., legislation, fund flow).
July 14, 2008
Master Limited Partnerships
Michael Blum, Senior Analyst
(212) 214-5037 /
Sharon Lui, CPA, Senior Analyst
(212) 214-5035 /
Eric Shiu, Associate Analyst
(212) 214-5038 /
Praneeth Satish, Associate Analyst
(212) 214-8056 /
Ronald Londe, Senior Analyst
(314) 955-3829 /
Jeffrey Morgan, CFA, Associate Analyst
(314) 955-6558 /
WACHOVIA CAPITAL MARKETS, LLC
MLP Primer Third Edition EQUITY RESEARCH DEPARTMENT
3
Table Of Contents
I. Introduction A Framework For Investment 5
II. Why Own MLPs? 5
A. Above-Average Performance And Good Portfolio Diversification 5
B. MLP Value Proposition Tax-Efficient Income Plus Growth 8
C. MLPs Have Been Defensive During Economic Slowdowns 10
D. MLPs Are An Effective Hedge Against Inflation 11
E. Demographics 11
F. MLPs Are An Emerging Asset Class 12
III. Who Can Own MLPs? 16
A. Mutual Funds Can Own MLPs… But Most Do Not 17
B. Challenges Remain For Mutual Fund Ownership Of MLPs 17
C. Tax Exempt Vehicles Should Not Own MLPs 17
IV. How To Build An Effective MLP Portfolio 18
V. Types Of Assets In Energy MLPs And Associated Commodity Exposure 18
A. A Brief Review Of The Evolution Of The MLP Sector 18
B. Asset Overview 19
Midstream (e.g., Pipelines, Storage, And Gathering And Processing) 20
Propane 26
Shipping 27
Coal 29
Upstream 29
Refining 30
Compression 31
Liquefied Natural Gas (LNG) 31
General Partner Interest 31
VI. The Basics 32
A. What Is An MLP? 32
B. Why Create An MLP? 33
C. What Qualifies As An MLP? 33
D. What Are The Advantages Of The MLP Structure? 33
E. How Many MLPs Are There? 33
F. What Is The K-1 Statement? 34
G. What Is The Difference Between A LLC And MLP? 34
H. Are MLPs The Same As U.S. Royalty Trusts And Canadian Royalty Trusts? 34
I. What Are I-Shares? 35
VII. Drivers Of Performance 37
A. Distribution Growth 37
B. Access To Capital 37
C. Interest Rates 38
D. Commodity Prices 39
VIII. Key Terms 39
A. What Are Distributions 39
B. What Are Incentive Distribution Rights (IDR) 39
C.
Calculating Incentive Distribution Payments 40
D. Available Cash Flow Versus Distributable Cash Flow 41
E. Are MLPs Required To Pay Out “All” Their Cash Flow? 41
F. What Is The Distribution Coverage Ratio And Why Is It So Important? 41
G. What Is The Difference Between Maintenance Capex And Growth Capex? 42
WACHOVIA CAPITAL MARKETS, LLC
Master Limited Partnerships EQUITY RESEARCH DEPARTMENT
4
IX. Tax And Legislative Issues 42
A. Who Pays Taxes? 42
B. What Are The Tax Advantages For The LP Unitholder (The Investor)? 42
C. The Mechanics Of A Purchase And Sale Of MLP Units And The Tax Consequences 44
D. Can MLPs Be Held In An IRA? 45
E. State and Local Taxes and State Filing Requirements 45
F. Foreign Investor Ownership 46
G. MLPs As An Estate Planning Tool 46
H. Current Tax and Legislative Issues 46
What Is The NAPTP? 46
What Is The Risk Of MLPs’ Losing Their Tax Advantaged Status 46
Canadian Royalty Trusts Tax Status Expected To Change In 2011 46
NAPTP Is Working To Ensure GPs Are Not Impacted By Carried Interest 46
FERC Includes MLPs In Determining Pipeline ROEs 47
MLPs Income Tax Allowance In Pipeline Ratemaking 47
X. Sector Trends 48
A. Dramatic Growth Of MLPs 48
B. MLP Investor Base Is Changing 48
C. Shift In Supply Resources Is Driving Energy Infrastructure Investment 50
D. MLPs Have Been Successful In Making Acquisitions And Investing Organically 51
E. Emergence Of “Dropdown” MLPs 53
F. MLPs Continue To Enjoy Good Access To The Capital 54
G. MLPs Are Employing Creative Financing Solutions To Fund Growth
56
PIPE Mania 56
A Paradigm Shift In PIPE Dynamics 56
Hybrid Securities 57
Paid-In-Kind (PIK) Equity 57
GP Subsidies 57
H. Publicly Traded General Partners Recognizing The Value Of The GP 58
Power Of The IDRs 58
The Multiplier 58
Not All GPs Are Created Equal 60
General Partners Are Held In Different Entities 60
I. Return Of Upstream MLPs 61
Upstream MLPs Failed In The 1980s. Why? 61
What Should Be The Criteria To Invest Today? 61
Upstream MLPs Are Faced With Unique Challenges And Risks 61
J. Cost Of Capital Is Becoming A More Prominent Issue 62
K. Emergence Of MLP Indices 64
L. Financial Products Facilitate Participation In MLPs 65
XI. Valuation Of MLPs 66
A. Distribution Yield 66
B. Two-Stage Distribution (Dividend) Discount Model 66
C. Price-To-Distributable Cash Flow 66
D. Enterprise Value-To-Adjusted EBITDA 66
E. Spread Versus The Ten-Year Treasury 67
F. What Is Maximum Potential Distribution (MPD)? 67
XII. Risks 69
XIII.
Appendix 71
WACHOVIA CAPITAL MARKETS, LLC
MLP Primer Third Edition EQUITY RESEARCH DEPARTMENT
5
I. Introduction A Framework For Investment
This report provides an update to our previous MLP primer published in August 2005. We provide a
reference guide to familiarize investors with the MLP investment. In this third edition, we have added new
information to our “basics” section based on questions and feedback we have received from investors over
the past few years. In addition, we have added new sections detailing upstream MLPs, pure-play publicly
traded general partners, dropdown stories, and developments within the MLP sector related to legislation,
fund flow, financing, etc. As always, feel free to call us with any questions or feedback.
II. Why Own MLPs?
While interest and ownership of MLPs has certainly increased since the publication of our last primer, we
suspect that relative to other asset classes, MLPs are still relatively under-owned. Therefore, before delving
into the details, we think it is important to answer the fundamental question of why should investors care
about MLPs? The case for MLP ownership can be grouped into the following broad categories:
(1) Performance and diversification;
(2) Attractive value proposition of tax-efficient current income plus growth = a sustainable low-double-digit
total return;
(3) A defensive investment;
(4) An effective way to hedge inflation;
(5) Demographics trends; and
(6) An emerging asset class.
A. Above-Average Performance And Good Portfolio Diversification
From 1998 to 2007, MLPs outperformed the S&P 500 in seven out of ten years. During this time frame,
MLPs have delivered above-average total returns (an average of 17.3%, versus 5.9% for the S&P 500) with
lower risk (beta of 0.31). During the past three years (2005-08), the Wachovia MLP Index has generated an
average total return of 6.2%, versus 2.5% for the S&P 500.
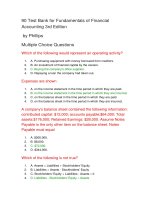
Figure 1. MLP Total Returns Versus S&P 500
0
400
800
1200
1600
2000
Dec-89
Dec-90
Dec-91
Dec-92
Dec-93
Dec-94
Dec-95
Dec-96
Dec-97
Dec-98
Dec-99
Dec-00
Dec-01
Dec-02
Dec-03
Dec-04
Dec-05
Dec-06
Dec-07
Index performance
WCM MLP Index (TR) S&P 500 Index (TR)
(14%)
27%
24%
39%
(10%)
22%
19%
32%
2%
(5%)
43%
42%
(0%)
45%
17%
5%
27%
12%
(7%)
(3%)
30%
8%
10%
1%
38%
23%
33%
29%
21%
(9%)
(12%)
(22%)
29%
11%
5%
16%
5%
(15%)
(30%)
(20%)
(10%)
0%
10%
20%
30%
40%
50%
1990 1992 1994 1996 1998 2000 2002 2004 2006 2008YTD
Percent total return
WCM MLP Index (TR) S&P 500 Index (TR)
Wachovia MLP TR Index +15.8%
S&P 500 TR Index +9.3%
Source: FactSet
Over the past five years, MLPs have also outpaced the broader market and most income-oriented investments
with an average total return of 13%, versus 12% for the S&P 500 REIT Index and 6% for the S&P 500 Index.
During the past three years, Wachovia MLP Index generated an average total return of 6%, versus 3% and
3%, respectively.
WACHOVIA CAPITAL MARKETS, LLC
Master Limited Partnerships EQUITY RESEARCH DEPARTMENT
6
Figure 2. Total Return Performance Versus Other Indices
(7%)
(16%)
6%
13%
(6%)
(16%)
3%
12%
(3%)
5%
12%
18%
(15%)
(17%)
3%
6%
(30%)
(15%)
0%
15%
30%
YTD 1-year 3-year 5-year
% total return
Wachovia MLP TR Index
S&P 500 (TR) / Real Estate Investment Trusts
S&P 500 (TR) / Utilities
S&P 500 (TR) Index
Source: Bloomberg
Performance As Measured By The Wachovia MLP Index
We gauge energy master limited partnerships’ (MLP) performance using our Wachovia MLP Composite
Index, which was introduced in December 2006. The index is designed to give investors and industry
participants the ability to track both price and total return performance for energy MLPs relative to the
broader market. The Index comprises energy master limited partnerships that are listed on the New York
Stock Exchange (NYSE), the American Stock Exchange (AMEX) or NASDAQ, and that meet market
capitalization and other requirements.
The Wachovia MLP Composite Index currently consists of 73 energy MLPs, including 11 general
partnerships (GP), and is also subdivided into 13 subsectors. To be eligible for the index, the company must
be structured as a limited partnership or limited-liability company and have a market capitalization of greater
than $200 million. The Index composition is determined by Wachovia Capital Markets, LLC, and the Index is
independently calculated by Standard and Poor’s using a float-adjusted market capitalization methodology.
The Index is reviewed quarterly, with changes effective after the close of trading on the third Friday of
March, June, September, and December. For each review date, securities are evaluated based on the close of
trading on the last trading day (the evaluation date) of the month preceding the review (February, May,
August, and November). Following a review, all securities already included in the Index that continue to meet
the eligibility criteria remain in the Index. All other securities that meet all eligibility criteria are added to the
Index and all securities included in the Index that do not continue to meet the eligibility requirements are
removed from the Index.
Real-time price quotes for the index are available on Bloomberg and Reuters under the symbol WMLP (and
WMLPT for total return) and on FactSet Marquee under the symbol WML-CME. For further information and
historical performance data from 1990 (downloadable), please visit www.wachoviaresearch.com
.
WACHOVIA CAPITAL MARKETS, LLC
MLP Primer Third Edition EQUITY RESEARCH DEPARTMENT
7
Figure 3. Historical Wachovia MLP Index Performance By Subsector
WCM MLP Indices Performance Since 2005
Price
Total
Return
WCM MLP Index 4% 10%
1. GP Composite Index 16% 20%
2. Coal MLP Index 7% 13%
3. Oil & Gas MLP Index (3%) 5%
4. Marine Transportation MLP Index (10%) (4%)
5. Propane MLP Index (1%) 6%
6. Midstream MLP Index 5% 11%
A. Natural Gas MLP Index 6% 12%
i. Gathering & Processing MLP Index 4% 11%
ii. Natural Gas Pipelines MLP Index 12% 18%
B. Petroleum MLP Index 4% 10%
i. Crude Oil MLP Index 2% 9%
ii. Refined Products MLP Index 4% 10%
7. Oilfield Service Index (22%) (18%)
S&P 500 Index 1% 3%
Note: The WCM Oilfield Service Index is as of June 18, 2007
Wachovia MLP Index
Oil & Gas
Midstream
Propane
Coal
Marine Transportation
Oil Field Services
Natural Gas
Petroleum
Natural Gas Pipelines
Refined Products
Gathering, Processing, and NGLs
Crude Oil
General Partnerships
Source: Standard & Poor's and Wachovia Capital Markets, LLC
Portfolio Diversification
MLPs exhibit low correlation to most asset classes and thus, provide good portfolio diversification, in
our view. Historically, the movements in MLP prices have not been highly correlated with changes in the
broader stock market, interest rates, commodity prices or other yield-oriented investments. The correlation
between MLPs and these variables has been fairly consistent and below 0.50 over the last one-year, three-
year, and five-year periods.
Relationship with the S&P 500 has been fairly consistent, but not that strong. The correlation between
MLPs and the S&P 500 over the one- and five-year periods was 0.43 and 0.40, respectively. While this is
high relative to other asset classes, on an absolute basis, the correlation to the overall market is still less than
one-half (see Figure 4).
Low correlation with the ten-year treasury. Over the past one- and five year periods, the correlation
between the MLPs and the ten-year treasury yield was 0.36 and only 0.07, respectively. Although the
correlation between MLPs and the ten-year treasury has increased over time, it is still relatively low. The low
degree of association reflects the transformation of MLPs from primarily ‘income’ investments to ‘growth
and income’ investments, in our view. We believe a moderate rise in interest rates should be manageable for
MLPs as any increase in rates should be partially offset by the increase in distributions throughout the year.
Although the historical correlation to actual interest rate trends has been relatively low, changes in investor
WACHOVIA CAPITAL MARKETS, LLC
Master Limited Partnerships EQUITY RESEARCH DEPARTMENT
8
psychology toward potential movements in interest rates (both the magnitude and timing) can affect the short-
term performance of MLPs.
Relatively weak correlation with commodity prices. The influence of commodity price movements on
MLPs is also relatively low, in our view. Over the past five years, the correlation with crude oil and natural
gas prices was 0.31 and 0.14, respectively. For the past year, the correlation with crude oil and natural gas
prices was 0.34 and 0.10, respectively. Although MLPs’ exposure to commodity price risk varies, overall, we
believe it is generally low relative to other companies in the energy industry. Clearly though, the perception
of commodity price risk can influence stock prices (over the short-term), in our view.
Link to bonds is diminishing. Over the past one and five years, the correlation between MLPs and Moody’s
Corporate Bond Index was only about (0.01) and (0.07), respectively. As the number of publicly traded MLPs
has grown in recent years and MLPs have established a track record of distribution increases, the movement
of MLP unit prices have become tied more closely to the equities market than the bond markets. Unlike
bonds with fixed interest payments, MLPs can increase distributions paid to unitholders and increase their
asset base via acquisitions and/or internal growth projects.
Relationship with other yield-oriented investments also trending lower. The correlation between MLPs
and REITs was 0.21 and 0.32 over the past one and five years, respectively, and MLPs and the S&P Utilities
Index were 0.29 and 0.40, respectively.
Figure 4. MLP Correlation With Other Asset Classes
Correlation Of MLPs With Other Asset Classes
S&P 500 Natural Gas Crude Oil 10 Yr Treas Utilities REITs Corp. Bonds
2005 0.42 0.21 0.36 (0.05) 0.59 0.41 (0.14)
2006 0.42 0.12 0.36 (0.12) 0.42 0.34 0.02
2007 0.43 0.02 0.26 0.24 0.36 0.35 0.03
2008 YTD 0.47 0.33 0.38 0.42 0.31 0.16 (0.01)
Last year 0.43 0.10 0.34 0.36 0.29 0.21 (0.01)
Last 3 years 0.43 0.13 0.31 0.19 0.41 0.30 (0.00)
Last 5 years 0.40 0.14 0.31 0.07 0.40 0.32 (0.07)
Source: FactSet
B. MLP Value Proposition Tax-Efficient Income Plus Growth
MLPs provide an attractive value proposition, in our view, with high current and tax-deferred income, and
visible distribution growth. Given median yields of 6-8% and a long-term sustainable distribution growth rate
of 4-6%, MLPs should be able to deliver low-double-digit total returns, annually, in our view, all else being
equal. Investors also benefit from lower risk, as measured by beta, and a partially tax-deferred distribution.
The MLP value proposition is underpinned by the sector’s growing role in providing the backbone of U.S.
energy infrastructure to deliver natural gas, crude oil, and refined products to a growing domestic market.
Current income plus growth. MLPs provide investors with current income, with a median yield of 7.8%.
MLP distributions have increased at a median five-year compound annual growth rate (CAGR) of 8.6%
(2003-07). Utility stocks, with their regulated earnings stream and significant dividend yields, are the most
comparable energy securities relative to the MLPs, in our view. Utilities provide a median yield of about
3.2% and have increased dividends at an annual growth rate of approximately 9.2%, on average, over the past
five years. For the next three years, we forecast distribution growth of 9% (10% including GPs) supported by
a large slate of organic investments tied to the ongoing buildout of U.S. energy infrastructure. In Figures 5
and 6, we highlight the median yield of MLPs relative to other indices and the upward trend of MLP
distribution growth over the past eight years.
WACHOVIA CAPITAL MARKETS, LLC
MLP Primer Third Edition EQUITY RESEARCH DEPARTMENT
9
Figure 5. Wachovia MLP Index Yield Versus Other Indices
6.6%
3.2%
2.9%
2.3%
7.6%
0.0%
2.0%
4.0%
6.0%
8.0%
Wachovia
MLP In d ex
FTSE
NAREIT All
REIT Index
S&P 500
Utilities
Index
Dow Jones
Industrial
30
S&P 500
Index
Yield
Source: Bloomberg and FactSet
Figure 6. MLP Annual Distribution Growth (2000-07)
3%
5%
5%
5%
6%
9%
10%
9%
0.0%
2.0%
4.0%
6.0%
8.0%
10.0%
12.0%
14.0%
2000A 2001A 2002A 2003A 2004A 2005A 2006A 2007A
Annual Distribution Growth (Excl. GPs) (%
MLP Distribution Growth
Source: Partnership reports
Tax efficient. MLPs offer investors a tax-efficient means to invest in the energy sector. An investor will
typically receive a tax shield equivalent to (in most cases) 80-90% of cash distributions received in a given
year. The tax-deferred portion of the distribution is not taxable until the unitholder sells the security.
Low risk. MLPs offer investors an alternative way to invest in energy with lower fundamental risk. MLPs
have averaged a beta of just 0.31 over the past year and an average beta of 0.30 over the past five years.
Traditional energy companies such as those involved in exploration and production, oilfield services, and
utilities have exhibited comparably more volatility with an average beta of 0.95, 1.09, and 0.75, respectively,
over the past five years (2004-2008). During this time frame, the beta for the S&P 500 Oil & Gas Exploration
& Production Index ranged from 0.32 to 1.36, while the beta for the S&P 500 Oil & Gas Equipment &
Services Index ranged from 0.58 to 1.60. The beta for the S&P 500 Utilities Index was between 0.56 and
1.01. This compares with a range of 0.14 and 0.31 for the Wachovia MLP Index.
WACHOVIA CAPITAL MARKETS, LLC
Master Limited Partnerships EQUITY RESEARCH DEPARTMENT
10
Figure 7. MLP Beta Relative To Other Energy Sectors
0.09
0.14 0.14
0.19
0.11
0.08
0.20
0.25
0.14
0.34
0.42
0.30
0.31
0.64
0.83
0.98
1. 14
0.59
0.39 0.39
1. 10
0.58
0.78
1. 2 8
1. 6 0
1. 2 0
0.76
0.61
0.57
0.81
0.39
0.22
0.25
0.71
0.32
0.78
1. 3 6
1. 3 2
0.98
0.66
0.68
0.47
0.26
0.34
0.28
0.33
0.77
0.66
0.56
1. 0 1
0.64
0.88
0.00
0.20
0.40
0.60
0.80
1.00
1.20
1.40
1.60
1.80
1996 1997 1998 1999 2000 2001 2002 2003 2004 2005 2006 2007 2008YTD
Beta
MLP Compos it e S&P 500 Oil & Gas Equipment & Services
S&P 500 Oil & Gas Exploration & Production S&P 500 Utilities
Source: FactSet
C. MLPs Have Been Defensive During Economic Slowdowns
Our colleagues (Wachovia’s E&P energy research team) examined the performance of energy stocks and the
energy subsector's performance during periods of slowing GDP growth. For purposes of this study, periods
during which the GDP was 2% or less were analyzed, rather than just periods of true economic recession (i.e.,
a decline in GDP for two or more consecutive quarters). Over the past 15 years, there were four periods
during which GDP growth was 2% or less: Q1-Q4 1995, Q2 2001 to Q2 2002, Q4 2002 to Q3 2003, and Q2
2006 to Q1 2007.
Over the past 15 years, MLPs have outperformed the market (S&P 500) in three of four periods of economic
slowdown, with a combined higher total return of 13.3% during all four periods (the S&P 500’s total return
during these four periods was 12.2%, on average). Thus, the data do suggest that MLPs are defensive in
nature given their relatively high yields and prospects for distribution growth, in our view. We caution that
these data do need to be viewed with a skeptic’s eye, as the MLP sector has changed dramatically during the
past 15 years. In 1994, there were just seven MLPs, with total sector market cap of $2.1 billion. That year,
MLPs grew distributions by 7.7%. In contrast, there are currently 78 MLPs with a combined market cap of
approximately $134 billion. The median distribution growth was 9.2% in 2007.
Figure 8. Energy Sub-Sector Performance During Economic Slowdowns
Note: Index Reference: E&P Index (S15OILP); Drillers (SPOILD); Service (S15OILE); Integrated (XOI); Utilities (UTIL); MLP (WCM
Index Wachovia) Total Energy (S&P 500 - Energy)
Source: Bloomberg, FactSet, Wachovia Capital Markets LLC, and Wachovia Economics Group
WACHOVIA CAPITAL MARKETS, LLC
MLP Primer Third Edition EQUITY RESEARCH DEPARTMENT
11
D. MLPs Are An Effective Hedge Against Inflation, In Our View
MLPs current (and growing) income stream can provide an effective hedge against inflation. Current yields
range from 5% to 13% (excluding GPs). For example, inflation was 4.1% in 2007 (as measured by the CPI),
while MLPs increased distributions at a median of 9% (11% including GPs). We estimate 10% distribution
growth (12% including GPs) in 2008 and 9% growth (10% including GPs) in 2009.
Figure 9. Historical MLP Distribution Growth (Excluding GPs) Versus The CPI
4%
4%
3%
5%
5%
5%
6%
9%
10%
9%
0%
2%
4%
6%
8%
10%
12%
1998A 1999A 2000A 2001A 2002A 2003A 2004A 2005A 2006A 2007A
Distribution Growth (Excl. GPs) (%)
MLP Distribution Grow th CPI
Source: Bureau of Economic Analysis and Bureau of Labor Statistics and Partnership reports
E. Demographics
Demographics should continue to drive demand for income-oriented investments, in our view, as retiring
Baby Boomers seek current income in a tax-efficient structure. Many income-oriented investments such as
REITs, utilities, and high-yield bonds have outperformed the market over the past few years.
According to the U.S. Census Bureau, the number of seniors (ages 65 and older) will increase sharply
beginning after 2010 as the Baby Boom generation (those born between 1946 and 1964) begins to turn 65
years of age. By 2030, when the entire Baby Boom generation has reached the age of 65, seniors are expected
to account for about 20% of the U.S. population. We believe MLPs represent an attractive investment class
for retirees due to their significant (and growing) income stream, relatively low risk (beta), and tax-
advantaged structure. In addition, MLPs are an effective estate planning tool, in our opinion, as MLP units
can be passed to heirs with significant tax savings.
Figure 10. Projected U.S. Population Over The Age Of 65
80,049
35,061
40,243
54,632
71,453
86,705
12.4%
13.0%
16.3%
19.7%
20.4%
20.7%
0
20,000
40,000
60,000
80,000
100,000
2000A 2010E 2020E 2030E 2040E 2050E
Population (in thousands)
0%
5%
10%
15%
20%
25%
65+ % of total U.S. population
Source: U.S. Census Bureau
WACHOVIA CAPITAL MARKETS, LLC
Master Limited Partnerships EQUITY RESEARCH DEPARTMENT
12
F. MLPs Are An Emerging Asset Class
MLPs are emerging as a distinct asset class, akin to the development in the 1990s of real estate investment
trusts (REIT). This is evident by the growth exhibited by MLPs over the past ten years in terms of number,
size, and liquidity. In 1994, there were just seven energy MLPs with an aggregate market capitalization of
approximately $1 billion. Currently, there are 78 energy MLPs, with a total market capitalization of
approximately $134 billion. In 1994, average trading volume of our MLP universe was just 34,819 units per
day. Year to date, our MLP Composite is trading an average of 153,442 units per day.
Figure 11. Number And Market Capitalization Of Energy MLPs
$134
$38
$30
$19
$18
$11
$8
$8
$5
$3
$2
$1
$112
$70
$147
78
7
9
12 12
15
17
18
23
29
30
34
42
60
73
$0
$20
$40
$60
$80
$100
$120
$140
$160
1994 1995 1996 1997 1998 1999 2000 2001 2002 2003 2004 2005 2006 2007 2008YTD
Market capitalization ($ in billions)
0
10
20
30
40
50
60
70
80
90
100
Number of MLPs
Total market capitalization of energy MLPs
Number of energy MLPs
Source: FactSet and National Association of Publicly Traded Partnerships
Could The MLP Sector Develop Like The REITs?
The modern-day REIT was created through the real estate investment trust tax provision, which established
REITs as pass-through entities, thus eliminating double taxation of dividends. In the 1980s, certain real estate
tax shelters were eliminated, increasing the investment in REITs. The Tax Reform Act of 1986 enabled REITs
to manage properties directly, creating further incentives for the creation of additional REITs. Finally, in
1993, REITs’ investment barriers to pension funds were eliminated. This trend of reforms continued to
increase the interest in and value of REIT investments.
At the end of 2007, there were 152 publicly traded REITs operating in the United States with a total market
capitalization of approximately $312 billion. (Source: National Association of Real Estate Investment Trusts)
Figure 12. Historical Number Of REITs And Market Capitalization
$1 $2 $1 $1 $1 $1 $2 $1 $2 $2 $2 $3 $4 $5 $8 $10 $10 $11 $12 $9 $13 $16 $32 $44
$58
$89
$141
$138
$124
$139
$155
$162
$224
$308
$331
$438
$312
15 2
18 3
19 7
19 3
17 1
17 6
18 2
203
210
211
19 9
219
226
18 9
14 2
13 8
11912 0
117
110
96
82
5959
66
76
75
7171
69
62
46
5353
46
34
18 9
$0
$50
$100
$150
$200
$250
$300
$350
$400
$450
$500
1971
1972
1973
1974
1975
1976
1977
1978
1979
1980
1981
1982
1983
1984
1985
1986
1987
1988
1989
1990
1991
1992
1993
1994
1995
1996
1997
1998
1999
2000
2001
2002
2003
2004
2005
2006
2007
$ in billions
0
25
50
75
100
125
150
175
200
225
250
Number of REIT
s
Total market capitalization of REITs
Number of REITs
Source: National Association of Real Estate Investment Trusts®, Inc.
WACHOVIA CAPITAL MARKETS, LLC
MLP Primer Third Edition EQUITY RESEARCH DEPARTMENT
13
Figure 13. Historical And Projected MLP Market Capitalization
$1 $2 $3 $5 $8 $8 $11 $18 $19 $30 $38
$70
$112
$147
$134
?
?
?
7
9
12 12
15
17
18
23
29
30
34
42
60
73
78
?
?
?
$0
$50
$100
$150
$200
$250
$300
$350
$400
1994 1995 1996 1997 1998 1999 2000 2001 2002 2003 2004 2005 2006 2007 2008
YTD
2009E 2010E 2011E
$ in billions
0
20
40
60
80
100
120
140
Number of MLPs
Total market capitalization of energy MLPs
Number of energy MLPs
Source: National Association of Publicly Traded Partnerships and Wachovia Capital Markets, LLC estimates
Could MLPs Be On A Similar Trajectory?
We think it is possible. The MLP sector has achieved several milestones that closely parallel milestones
achieved by the REIT sector. These milestones led to the growth and prominence of the REIT industry, in our
view. Figure 14 outlines the REIT/MLP parallels:
Figure 14. REIT Versus MLP Milestones
REITs MLPs
- Omnibus Reconciliation Act of 1993 allowed pension funds
to own REITs
- REIT Modernization Act of 1999
- With the passage of the American Jobs Creation Act in
October 2004, mutual funds are now allowed to own MLPs
- Equity Office Properties Trust (EOP) was the first REIT
added to the S&P 500 Index on October 1, 2001
- EPD has made the case to qualify for inclusion into the S&P
500 Index
- NAREIT All REIT Index yield has compressed to 6.6% from
8.0% in 2000
- The midstream MLP yield has compressed to 7.8% from an
average of 9.1% in 2000
Source: FactSet and National Association of Real Estate Investment Trusts
As more assets are placed into the structure, we expect MLPs to proliferate. Two notable areas of potential
growth are pipelines, and oil and gas reserves. Currently, about 37% of all energy pipelines in the United
States are held by MLPs, implying room for consolidation within the sector. Increasingly, pipeline companies
are recognizing that the MLP structure is most efficient for holding midstream assets. This is evident by the
sale of two interstate pipelines to MLPs in 2006-07 and three initial public offerings of interstate pipeline
MLPs over the past two years.
Figure 15. U.S. Pipelines Owned By MLPs
MLP owned
pipeline miles
37%
Note: Based on crude oil, natural gas, natural gas liquids, refined products pipeline miles
Source: Department of Transportation, American Petroleum Institute (API), Association of Oil Pipe Lines (AOPL), and Partnership reports
On December 22, 2006, El Paso sold ANR Pipeline to TransCanada Corp. and TC Pipelines, L.P. (TCLP) for
$3.3 billion. On September 15, 2006, GE Energy Financial Services and Southern Union Company sold
Transwestern Pipeline to Energy Transfer Partners for $1.0 billion. According to the National Association of
Publicly Traded Partnership estimates, energy related MLPs, currently own approximately 200,000 miles of
WACHOVIA CAPITAL MARKETS, LLC
Master Limited Partnerships EQUITY RESEARCH DEPARTMENT
14
pipelines: gathering and transmission, onshore and offshore pipelines, carrying natural gas, natural gas
liquids, crude oil, and refined products (See Figure 16).
El Paso Pipeline Partners, L.P. (EPB), Spectra Energy Partners, L.P. (SEP), and Williams Pipeline Partners,
L.P. (WMZ) are three interstate pipeline MLPs, that held successful initial public offerings on November 16,
2007, June 27, 2007, and January 18, 2008, respectively. EPB sold approximately 33.2% of the partnership or
28.75 million common units at $20 per unit. SEP sold about 17% of the partnership or 11.5 million common
units at $22 per unit, and WMZ sold approximately 47.5% of the partnership, or 16.25 million common units
at $20 per unit.
Figure 16. Miles Of Pipeline Owned By Energy MLPs
Total MLP pipeline miles owned
Natural gas pipelines 70,000
Refined products pipelines 40,000
NGL/LPG pipelines 20,000
Crude oil pipelines 70,000
Total pipelines 200,000
Source: U.S. Department of Transportation, American Petroleum Institute (API), the Association of Oil Pipe Lines (AOPL), and
Partnership reports
MLPs are the logical structure to house interstate pipelines and other midstream assets, in our view, due to
their low-maintenance capital requirements and tax-advantaged status, which enables cash flow to be
distributed to investors in a tax-efficient manner. Because MLPs do not pay corporate income tax, they can
generate more free cash flow than a corporation given the same amount of operating income. Assets that
generate stable cash flow and that require minimal capital reinvestment to sustain are ideally suited for the
MLP structure, which pays the majority of its cash flow to unitholders on a quarterly basis.
MLPs Are Also Suitable Investment Vehicles For Certain Oil And Gas Assets
Upstream MLPs can play an important role in the recycling of cash flow associated with the exploration (at
the C-Corp level) and production of oil and gas assets in the United States. By selling mature
production/reserves to MLPs, E&P companies are able to reinvest cash proceeds into properties that have
better geologic upside potential to which they can significantly add value by drilling wells. This process
allows E&P companies to efficiently explore for new reserves without having to invest significant resources
in the upkeep of mature reserves. The mature, low-decline production is placed into the MLP structure, where
reserves can be harvested to support steady cash flow and divestitures. Upstream MLPs also benefit from this
process as most E&P companies have historically underexploited mature fields, given the opportunity for
higher returns (and higher risk) elsewhere. As a result, upstream MLPs receive not only a base of stable
producing assets, but also an inventory of low-risk development drilling opportunities through which to
maintain or modestly increase production.
WACHOVIA CAPITAL MARKETS, LLC
MLP Primer Third Edition EQUITY RESEARCH DEPARTMENT
15
Figure 17. Upstream MLPs Fill A Niche
Oil & Gas Company (C-
Corp) discovers new
reserves via exploratory
drilling
Oil & Gas Company
develops reserves and
captures higher initial
production and cash flow
(and higher decline rates)
Oil & Gas Company sells the
mature reserves to an Upstream
MLP after production rates have
declined to a more manageable
and stable level (5-6%)
Oil & Gas Company
redeploys capital
received from MLP
Common unitholders
receive distributions
Upstream MLP distributes
predictable cash flow to
unitholders from proved
developed producing
reserves
Source: Wachovia Capital Markets, LLC
Typically, initial production rates from new wells are high, but decline rapidly for several years before
leveling off. At this point, it makes sense for E&P companies to sell their mature properties and redeploy the
proceeds into new plays with higher potential returns.
Figure 18. Appropriate Production Profile For The MLP Structure
Time
Oil And Natural Gas
Production Curve
C-Corp Structure MLP Structure
Source: Wachovia Capital Markets, LLC
Upstream MLPs Well Positioned To Compete For Mature Reserves
Upstream MLPs are better positioned to compete in the oil and gas market for mature reserves than E&P
companies, in our view. Upstream MLPs do not pay corporate taxes and the majority of partnerships do not
have incentive distribution rights (IDR) or management incentive interests (MII) (those that do have a max
tier of 25%). Accordingly, these partnerships should be able to outbid E&P companies for acquisitions, while
WACHOVIA CAPITAL MARKETS, LLC
Master Limited Partnerships EQUITY RESEARCH DEPARTMENT
16
still generating a similar level of cash flow accretion to unitholders. All else being equal, we expect mature
reserves held in the MLP structure to trade at a slight premium to the same set of reserves under a C-Corp
structure given the elimination of corporate level taxation.
Market For MLP Suitable Oil & Gas Reserves Exceeds 75 Tcfe, Of Which MLPs Own 7%
According to the Energy Information Administration (EIA), there are approximately 211.1 trillion cubic feet
(Tcf) of proved natural gas reserves and 21.0 billion barrels of proved crude oil reserves in the United States
(as of December 31, 2006). This includes approximately 29 Tcf and 0.8 billion barrels of proved reserves
located offshore and in Alaska, both of which are likely not suitable for the MLP structure. After stripping
these reserves out, proved natural gas reserves totaled 182 Tcf and proved crude oil reserves totaled 20 billion
barrels in 2006 for the onshore/lower 48 states. Based on the average PDP ratio of large independent E&P
companies in the United States, we estimate that approximately half of these reserves are proved developed
producing, or approximately 152 Tcfe (91 Tcf of natural gas and 10 BBbls of crude oil/NGLs).
Even assuming only 50% of these PDP reserves are suitable for the MLP structure implies a total potential
reserve base of 46 Tcf of natural gas and 5 billion barrels of crude oil. Total crude oil and gas reserves in the
MLP structure currently total only 3.3 Tcf of natural gas and 299 million barrels of crude oil. This implies
that of the “MLP-able” reserves, only 6% of crude oil and 7% of natural gas have been placed in the
structure.
Figure 19. Potential Oil And Natural Gas Reserves Suitable For The MLP Structure
Est. oil
reserves in
MLP
structure
6%
Est. natural
gas reserves
in MLP
structure
7%
Note: Assumes 50% of total proved U.S. reserves (excluding offshore and Alaska) are proved developed producing (PDP) and about
50% of this amount is suitable for the MLP structure.
Source: EIA, Partnership reports, and Wachovia Capital Markets, LLC estimates
III. Who Can Own MLPs?
MLPs have traditionally been owned by retail investors. This is still true today. Approximately 69% of total
MLP units outstanding are currently held by retail investors, with the remaining 31% of units held by
institutions.
Figure 20. Institutional And Retail Ownership Of MLPs
Institutional
31%
Retail
69%
Note: Retail percentage include 7% ownership by foreign investors
Source: Vinson and Elkins and Wachovia Capital Markets, LLC estimates
Until 2004, institutional investors such as mutual funds and other registered investment companies (RIC)
were restricted from investing in MLPs because distributions and allocated income from publicly traded
partnerships were considered non-qualifying income. To retain their special tax status as regulated investment
companies (RIC), mutual funds are required to receive at least 90% of their income from qualifying sources
listed in the tax laws.
WACHOVIA CAPITAL MARKETS, LLC
MLP Primer Third Edition EQUITY RESEARCH DEPARTMENT
17
Institutional Interest Is Growing
MLPs are undergoing a transition in ownership from a predominantly retail base to more institutional
ownership. Institutional interest in MLPs has increased with the formation of 11 MLP-focused closed-end
funds ($4.7 billion of equity raised), and the passage of legislation that allows mutual funds to own MLPs.
These closed-end funds offer investors a number of advantages, in our view, including the ability to
participate in MLPs without the burden of K-1s (processed by the funds investors receive a 1099),
professional management, and access to private market transactions typically at discounts to the market price.
In addition, professional investors with pools of private funds (e.g., hedge funds, high net worth brokers, etc.)
have increased participation in the sector.
A. Mutual Funds Can Own MLPs…But Most Do Not
With the passage of the American Jobs Creation Act in October 2004, mutual funds can now own MLPs.
However, there are some restrictions to investment: (1) no more than 25% of a fund’s asset value may be
invested in MLPs and (2) a fund may not own more than 10% of any one MLP.
B. Challenges Remain For Mutual Fund Ownership Of MLPs
Despite the passage of the American Jobs Creation Act, mutual funds have not participated in the MLP sector
in large numbers to date. This is due to a number of administrative challenges, a list of which follows:
• Timing issues. Mutual funds begin processing their investors’ 1099s in November, but may not receive
their MLP K-1s until late February or early March. Mutual funds are required to designate investors’
income as ordinary income, long-term capital gains, and return of capital. However, without the K-1s, a
mutual fund would have to make estimates that could prove incorrect. In certain instances, this could lead
to excise tax liability for the mutual fund or a mutual fund investor paying taxes not owed.
• Federal/state law discrepancies. While the mutual fund provision was adopted as federal law, some
states have not adopted the legislation as law. As a result, mutual funds domiciled in certain states may
still be restricted from owning MLPs. For example, Massachusetts (a state that is home to many mutual
funds) has not adopted the federal Mutual Fund Act as law, creating potential legal issues for mutual
funds domiciled in that state.
• State filing requirements. There are potential administrative burdens related to state filing requirements.
Since some MLPs have operations (e.g., pipelines and storage tanks) in many states, a mutual fund
owner of a partnership may be required to file income tax returns in every state in which the MLP
conducts business (even if no taxes are owed). Clearly, the administrative burden required for such an
undertaking could be prohibitive. Please see the Appendix for a list of states in which each MLP
operates.
C. Tax-Exempt Vehicles Should Not Own MLPs
Tax-exempt investment vehicles such as pension accounts, 401-Ks, IRAs, and endowment funds should not
own MLP units because MLPs generate unrelated business taxable income (UBTI). This means MLP income
is considered income earned from business activities unrelated to the entity’s tax-exempt purpose. If a tax-
exempt entity receives UBTI (e.g., income from an MLP) in excess of $1,000 per year, the investor would be
required to file IRS form 990-T and may be liable for tax on the UBTI. We recommend consulting a tax
advisor before investing in MLPs within any of these structures.
WACHOVIA CAPITAL MARKETS, LLC
Master Limited Partnerships EQUITY RESEARCH DEPARTMENT
18
IV. How To Build An Effective MLP Portfolio
In building an effective MLP portfolio, we believe there are three primary factors that investors should take
into consideration. These factors include the following:
• “Anchor tenants.” Investing in “anchor” or core MLPs is an effective way to build a solid foundation
for an MLP portfolio. The anchor tenants are companies that have established a successful track record
of delivering solid and sustainable results year after year. In addition, these MLPs are typically large-cap
companies that have grown and diversified their asset base to limit cash flow volatility during changes in
economic cycles.
• Invest with top management. Prior to making any investment, individuals should evaluate the strength
of the company’s management team. Investors should consider a management team’s (1) track record in
successfully managing its business, (2) project management capabilities (i.e., ability to keep projects on
time and on budget), and (3) ownership interests (i.e., aligned with those of the unitholder).
• Balance risk and growth. Like all investments, MLPs present risk/reward propositions. Investors should
consider their risk-tolerance level and make investments accordingly. In general, a balanced portfolio,
which includes lower-risk, but potentially lower-return MLPs and higher-risk MLPs with potentially
higher returns, should be considered. In assessing risk/reward, prospective investors should consider
factors outlined in Figure 21 when building an MLP portfolio:
Figure 21. Risk And Growth
Risk and Growth
- Capital requirements - Market position
- Leverage - Organic versus acquisition dependent
- Stock liquidity - Visibility
- Execution - Track record
- Commodity exposure - Size
- Weather - Strength of sponsor
Source: Wachovia Capital Markets, LLC
V. Types Of Assets In Energy MLPs And Associated Commodity Exposure
A. A Brief Review Of The Evolution Of The MLP Sector
In the 1980s, MLPs were involved in various businesses including exploration and production (E&P) of oil
and natural gas, restaurants, sports teams, and other consumer activities. These businesses were more cyclical
in nature, or in the case of E&P companies, were victims of low commodity prices, a volatile natural gas
market, and depleting reserve base, which relied on exploratory drilling to sustain cash flow (current
upstream MLPs own longer life reserves and employ a lower-risk, more factory-like, exploitation and
production operation). Without reinvestment, the predecessor upstream MLPs were essentially self-
liquidating partnerships and were unable to sustain their distributions.
In the late 1980s, MLPs were reincarnated as entities that generally own midstream assets that are used to
transport, process, and store natural gas, crude oil, and refined petroleum products and have limited exposure
to commodity price risk. These assets were typically spun out of larger entities that could realize a higher
value from these assets as publicly traded MLPs. The early MLPs consisted primarily of refined-product
pipelines that were characterized as mature assets that required modest maintenance capital and generated
stable cash flow that was distributed to unitholders with very modest growth expectations.
The modern day MLP got its start in 1986-87, when Congress passed the Tax Reform Act of 1986 and the
Revenue Act of 1987. The new laws stated that to qualify as a master limited partnership, an entity had to earn
at least 90% of its income from “qualified sources.” These sources were generally limited to natural resources
or mineral activities including exploration, development, mining, processing, refining, transportation, or
marketing. Other qualifying income includes interest, dividend, real property rents, income from the sale of
property, gain from the sale of assets, income from the sale of stock, and gains from commodities, futures,
(commodity related) forwards, and options (with certain limitations).
WACHOVIA CAPITAL MARKETS, LLC
MLP Primer Third Edition EQUITY RESEARCH DEPARTMENT
19
The MLP has seen a progression of different types of assets placed into the structure, beginning with refined
products pipeline assets in 1986 (Buckeye Partners, L.P.). Some asset types such as refining, and oil and gas
reserves (introduced in the 1980s) were re-introduced to the MLP structure in 2006. Other MLPs, involved in
the plastics and fertilizer industry did not survive as partnerships due, in part, to the cyclical nature of their
businesses. These partnerships were dissolved, merged, or restructured. Nevertheless, the majority of energy
assets introduced into the MLP structure since 1986 have evolved from more stable pipelines to increasingly
more volatile cash flow businesses with greater risk, in our view. In a sense, the MLP structure has evolved to
include assets that operate progressively closer to the wellhead, the prototypical energy asset with the greatest
degree of commodity, drilling, reserve, and re-investment risk.
Beginning in the late 1990s, MLPs began reorienting their focus toward growth, making significant
acquisitions, pursuing internal growth projects, and aggressively raising distributions. This change in focus
was partially due to the sudden availability of midstream assets on the market. For example, majors and large
diversified energy players decided to monetize their mature assets with the intent of redeploying proceeds
from the sale into higher-return investments. MLPs were able to take advantage of their unique tax-exempt
structure, and lower cost of capital, to achieve returns superior to those of corporations.
Although investors are becoming more comfortable with the MLP investment structure, the risk profile of
MLPs has been increasing. Specifically, the cash flow of some MLPs has been becoming more sensitive to
commodity prices. MLPs formed in the late 1980s and early 1990s generally owned pipeline and storage
assets that were largely fee-based, with limited exposure to commodity price risk. Currently, MLPs own
assets involved in almost all aspects of energy, across all commodities, with varying degrees of commodity
price sensitivity. These include onshore and offshore pipelines that transport natural gas, crude oil, refined
products, and ammonia, gathering and processing operations, fractionation facilities, storage assets,
marketing businesses, propane distribution, natural gas, oil and coal production, LNG, and waterborne
transportation.
B. Asset Overview
In aggregate, the master limited partnership universe is made up of approximately 102 companies that are
classified as publicly traded partnerships, with 78 being energy related. The MLP structure has evolved from
stable cash flow generating assets (i.e., pipelines and storage) to more commodity-sensitive businesses (e.g.,
oil and natural gas assets, asphalt, refining, etc.) with higher risk, in our view. Currently, MLPs are engaged
in every aspect of the energy value chain. Thus, the impact of commodity prices on MLP cash flow varies
according to asset class. In the following sections, we outline the effect of commodity prices on each major
asset class owned by MLPs.
Figure 22. MLP Risk Profiles
BWP MMP APL APU CPLP ARLP ATN
BPL NS CPNO FGP KSP NRP BBEP
DEP PAA DPM GLP NMM PVR CEP
EEP SEP EROC NRGY OSP DMLP
EPB SGLP HLND SGU TGP ENP
EPD SXL KGS SPH TOO EVEP
ETP TCLP MWE USS LGCY
GEL TLP NGLS LINE
HEP TPP RGNC PSE
KMP WMZ WES QELP
OKS WPZ VNR
XTEX
MMLP
Less risk More risk
Pipelines and
Storage/Terminals
Gathering &
Processing
Propane and
Heating Oil
Shipping Coal Upstream
Note: Classification does not take into account hedging activities or parent/sponsor relationships
Source: Wachovia Capital Markets, LLC
WACHOVIA CAPITAL MARKETS, LLC
Master Limited Partnerships EQUITY RESEARCH DEPARTMENT
20
The types of assets in energy MLPs include the following:
(1) Midstream (pipeline, gathering and processing, and storage/terminals)
(2) Propane and heating oil
(3) Shipping (marine transportation)
(4) Coal and aggregates (operators and royalty model)
(5) Upstream (exploration and production)
(6) Refining
(7) Compression
(8) Liquefied natural gas (LNG)
(9) General partner interests
Midstream. Midstream MLPs are involved in the gathering and processing, transportation, and/or storage of
crude oil, natural gas, natural gas liquids (NGL), and/or refined petroleum products.
Midstream MLPs with pipeline and storage/terminal assets are typically characterized as generating stable,
fee-based cash flow with minimal volatility in earnings. Interstate natural gas pipelines are regulated by the
Federal Energy Regulatory Commission (FERC), a government body that regulates tariffs and allowed rates
of returns for pipeline companies. In theory, the pipeline is allowed to earn a reasonable return on its
investment to cover operating costs, depreciation, and taxes. Historically these rates have averaged 11-13%.
Typically, natural gas pipelines receive demand charges, whereby shippers reserve capacity on the pipeline
and must pay the tariff regardless of their actual use of the capacity. Intrastate natural gas pipelines are
monitored by state agencies (e.g., Railroad Commission of Texas), but overall operate in competitive markets
with less regulatory oversight.
The FERC also regulates crude oil and refined products pipelines (e.g., gasoline, diesel, jet fuel, distillates).
Rates for these pipelines are established in four ways:
(1) Indexing. The maximum rate a pipeline can charge is adjusted annually based on changes in the
Producer Price Index (PPI). The FERC determined that the PPI for Finished Goods plus 1.3% (PPI plus
1.3%) should be the oil pricing index for the five-year period beginning July 1, 2006, which helps to
provide a growing stream of income in excess of inflation trends.
(2) Cost of service. The rate is based on the actual costs experienced by the pipeline.
(3) Settlement rate. The rate is agreed upon by the pipeline’s customers; and
(4) Market-based rates. The rate is established by supply and demand dynamics in a competitive market.
Some crude oil pipelines operate under buy/sell arrangements. This means shippers or the pipeline operator
itself will purchase crude at one point on the pipeline and then simultaneously enter into a sales contract for
that crude at another point on the pipeline.
Finally, storage assets (for natural gas, crude oil, and refined products) typically have fee-based revenue
structures whereby the customer reserves storage capacity and pays an additional fee to blend, inject, or
withdraw the product from storage.
The growth in pipeline volumes typically average 2-3% per year, which is in line with historical growth in
demand for energy. However, energy demand typically tracks GDP growth. Growth can be higher depending
on regional demographic growth patterns and expansions.
Drivers. Acquisitions and major organic growth projects are generally required to meaningfully increase
overall growth.
Risks. In general, risks related to investing in midstream MLPs include an economic slowdown, which could
negatively affect energy demand, (1) rising raw material and labor costs, (2) an over build of U.S. energy
infrastructure, (3) regulatory risk related to allowed rates of return, and (4) a decline in commodity prices
(resulting in a decline in drilling activity).
Commodity price sensitivity. In general, MLPs with pipeline and storage assets do not take title to the
commodity, and hence, high commodity prices have minimal (if any) direct effect. Interstate natural gas
WACHOVIA CAPITAL MARKETS, LLC
MLP Primer Third Edition EQUITY RESEARCH DEPARTMENT
21
pipelines’ earnings are typically based on demand charges (similar to rent) and a small portion of earnings
may vary with volume; however, commodity prices do have an indirect impact on pipeline volume. High
natural gas prices may spur drilling activity and benefit pipeline companies that can expand their systems that
connect to basins of increasing supply. However, high prices could also have the effect of causing
conservation and curtailing demand. Pipeline and storage assets have historically been less exposed to
economic cycles (i.e., downturns), due to their low cost structure (versus other transporters, such as truck,
rail, and barge) and government-regulated nature.
Earnings for crude and petroleum products pipelines are tied primarily to throughput (volume). Thus,
consumer demand for refined products (i.e., gasoline, diesel, and jet fuel) and refinery demand for crude oil
are the main drivers of pipeline volume. Interstate petroleum products pipelines may benefit from higher
commodity prices via regulations that allow pipelines to annually increase tariffs at a rate of producers’ price
index (PPI + 1.3%).
The following is a summary of the sub-sectors of the midstream segment:
• Natural gas pipelines. Natural gas transportation pipelines are generally large diameter interstate
pipelines used for long-distance transportation. Natural gas transportation pipelines receive natural gas
from gathering systems and other pipelines and deliver it to industrial end users, utility companies, or
storage facilities. Utilities or local distribution companies, then distribute the natural gas to residential
and/or commercial customers. Throughput in mainline natural gas transportation pipelines tends to be
relatively stable due to continued growth in demand for natural gas from industrial, commercial, electric
power sector, and residential end users.
Figure 23. Natural Gas Pipeline MLPs
MLP Ticker Primary Business Line
Boardwalk Pipeline Partners, L.P. BWP Natural Gas Pipelines
El Paso Pipeline Partners, L.P. EPB Natural Gas Pipelines
Energy Transfer Partners, L.P. ETP Natural Gas Pipelines
Spectra Energy Partners, L.P. SEP Natural Gas Pipelines
TC Pipelines, L.P. TCLP Natural Gas Pipelines
Williams Pipeline Partners, L.P. WMZ Natural Gas Pipelines
Source: Partnership reports
•
Refined products pipelines. Refined products pipelines are common carrier transporters of refined
petroleum products, such as gasoline, diesel fuel, and jet fuel. Primary pipeline customers are refiners
and marketers of the product being shipped. End-user destinations include airports, rail yards, and
terminals/truck racks, for further distribution to retail outlets. Refined product pipeline cash flow is stable
based on the relatively inelastic baseload demand from end users of gasoline, diesel fuel, etc. Throughput
can exhibit minor fluctuations, depending upon economic cycles.
Figure 24. Refined Products Pipeline MLPs
MLP Ticker Primary Business Line
Buckeye Partners, L.P. BPL Refined Products
Holly Energy Partners, L.P. HEP Refined Products
Kinder Morgan Energy Partners, L.P. KMP Refined Products
Kinder Morgan Management, LLC KMR Refined Products
Magellan Midstream Partners, L.P. MMP Refined Products
Martin Midstream Partners, L.P. MMLP Refined Products
NuStar Energy, L.P. NS Refined Products
Sunoco Logistics Partners, L.P. SXL Refined Products
TEPPCO Partners, L.P. TPP Refined Products
TransMontaigne Partners, L.P. TLP Refined Products
Source: Partnership reports
WACHOVIA CAPITAL MARKETS, LLC
Master Limited Partnerships EQUITY RESEARCH DEPARTMENT
22
• Crude oil pipelines. Crude oil gathering pipelines transport crude from the wellhead to larger mainlines.
Main crude oil trunkline systems feed refiners from waterborne imports, Canadian imports, and domestic
production. U.S. refiners are more dependent upon waterborne and Canadian imports because inland
domestic crude oil production peaked during the 1970s. Crude oil is also gathered via tank trucks from
older, less productive wells where gathering pipelines are not economical. Crude oil pipelines provide
stable, fee-based cash flow. Given the difficulty in building new refineries in the United States, existing
refining capacity tends to be consistently used, providing a steady source of demand for crude oil
pipeline throughput.
Figure 25. Crude Oil Pipeline MLPs
MLP Ticker Primary Business Line
Enbridge Energy Management, LLC EEQ Crude Oil
Enbridge Energy Partners, L.P. EEP Crude Oil
Genesis Energy, L.P. GEL Crude Oil
Plains All American Pipeline, L.P. PAA Crude Oil
SemGroup Energy Partners, L.P. SGLP Crude Oil
Source: Partnership reports
Figure 26. Crude Oil Value Chain
Source: Plains All American Pipeline, L.P.
•
NGL pipelines. Natural gas liquids (NGL) pipelines transport mixed NGL products, such as ethane,
propane, butane, iso-butane, natural gasoline, and other hydrocarbons. NGL pipelines typically move
NGLs from natural gas processing plants, refineries, and import terminals to fractionation plants and
storage facilities. Most NGL pipelines generate cash flow based on a fixed fee per gallon of liquids
transported and volumes delivered. NGL pipeline fees are either contractual or regulated by a
government agency (e.g. FERC).
• Storage/terminals. Terminalling operations provide storage, distribution, blending and other ancillary
services to pipeline systems. Terminals consist of either inland or marine terminals. Inland terminals
generally receive product from pipelines and distribute them to third parties at the terminal, which, in
turn, deliver them to end users, such as retail gasoline stations. Marine terminals, usually located near
refineries, are large storage and distribution facilities that handle crude oil or refined petroleum products.
Terminal cash flow is affected by the amount of petroleum products stored, which, in turn is dependent
upon petroleum product pipeline throughput, as well as the amount of blending activity that takes place
at the facility. Crude oil terminal operators may use terminals as a natural extension of their pipeline
system or may actively seek terminal throughput from third parties. In the latter case, terminal cash flow
is more subject to the operational expertise of the terminal operator/marketer.
Unlike refined products and crude oil storage, which are stored in above-ground facilities, natural gas is
primarily stored underground using (1) depleted reservoirs, (2) aquifers, or (3) salt cavern formations.
However, natural gas can also be stored in liquid form (LNG) using above-ground storage facilities. The
most common form of natural gas storage in the United States is the use of depleted natural gas or crude
oil fields because of their availability. The advantages of a depleted natural gas or oil field are that it uses
existing infrastructure (i.e., wells, gathering systems, and pipeline connections), and some are located
near consuming markets.
There are also terminalling facilities that handle products other than crude oil, natural gas, and refined
products. These other products include asphalt, petrochemicals, industrial chemicals, vegetable oil
products, coal, petroleum coke, fertilizers, steel, ore, and other dry-bulk materials.
WACHOVIA CAPITAL MARKETS, LLC
MLP Primer Third Edition EQUITY RESEARCH DEPARTMENT
23
Terminals are affected by backwardated and contango markets. In a backwardated market, the future
delivery price of the commodity (i.e., natural gas or crude oil) is below the current spot price, resulting in
less incentive to store the commodity. In a contango market, the future delivery price of the commodity
is above the current spot price, giving producers and marketers incentive to store the commodity.
• Natural gas gathering. Natural gas gathering pipelines consist of small diameter (4”-6”) pipelines that
connect completed natural gas wells to larger diameter (10”-30+”) natural gas pipelines. As natural gas
wells age, production naturally declines. To offset this decline and maintain overall gathering system
volume, the natural gas gathering system must hook up additional wells. The cash flow stability of
natural gas gathering and processing systems is dictated, in part, by natural gas prices. Natural gas prices
influence producer drilling activity and the type of contract pricing.
Figure 27. Gathering, Processing, and NGL MLPs
MLP Ticker Primary Business Line
Atlas Pipeline Partners, L.P APL Gathering, Processing, and NGLs
Copano Energy, LLC CPNO Gathering, Processing, and NGLs
Crosstex Energy, L.P. XTEX Gathering, Processing, and NGLs
DCP Midstream Partners, L.P. DPM Gathering, Processing, and NGLs
Duncan Energy Partners L.P. DEP Gathering, Processing, and NGLs
Eagle Rock Energy Partners, L.P. EROC Gathering, Processing, and NGLs
Enterprise Products Partners, L.P. EPD Gathering, Processing, and NGLs
Hiland Partners, L.P. HLND Gathering, Processing, and NGLs
MarkWest Energy Partners, L.P. MWE Gathering, Processing, and NGLs
ONEOK Partners, L.P. OKS Gathering, Processing, and NGLs
Quicksilver Gas Service, L.P. KGS Gathering, Processing, and NGLs
Regency Energy Partners, L.P. RGNC Gathering, Processing, and NGLs
Targa Resources Partners L.P. NGLS Gathering, Processing, and NGLs
Western Gas Partners, L.P. WES Gathering, Processing, and NGLs
Williams Partners, L.P. WPZ Gathering, Processing, and NGLs
Source: Partnership reports
Figure 28. Gathering And Processing Value Chain
Natural gas
production
Gathering
and
compression
Natural gas
processing
and treating
Residue gas
and raw NGL mix
transportation
Raw NGL mix
Residue gas
Natural gas
production
Gathering
and
compression
Natural gas
processing
and treating
Residue gas
and raw NGL mix
transportation
Raw NGL mix
Residue gas
Source: Targa Resources Partners, L.P.
•
Natural gas processing and fractionation. Natural gas is gathered at the wellhead and then collected at
central delivery points and transported to treating and processing plants. Prior to long-haul transportation,
natural gas from the wellhead must often be processed, or refined, to remove impurities in order to meet
requirements for pipeline transportation. Raw natural gas may be dehydrated to remove water, treated to
remove chemical impurities, sulfur, carbon dioxide, and hydrogen sulfide, and/or processed to remove
natural gas liquids, commonly referred to as NGL raw mix or ‘y’ grade.
WACHOVIA CAPITAL MARKETS, LLC
Master Limited Partnerships EQUITY RESEARCH DEPARTMENT
24
Natural gas liquids. NGLs are hydrocarbons that are separated from natural gas through various
processes at natural gas processing plants. These liquids include ethane, propane, butane, iso-butane, and
natural gasoline.
Fractionation. NGLs are then further refined or fractionated into separate liquids (i.e., ethane, propane,
iso-butane, normal butane, and natural gasoline) at fractionation facilities. Once separated, the liquids
serve a variety of purposes.
• Ethane is not used as a fuel, but as a feedstock for the production of ethylene. Ethylene is used in the
production of detergents, plastic packaging materials, insulation, synthetic lubricants, and other
chemical products.
• Propane is used for heating homes, heating water, cooking and refrigerating food, drying clothes,
and fueling gas fireplaces and barbecue grills. It is also used as vehicle fuel and petrochemical
feedstock.
• Iso-butane is used as a gas in refrigeration systems (i.e., refrigerators and freezers), a propellant in
aerosol sprays, and as a feedstock for the petrochemical industry (i.e., for the production of
isooctane a clean source of octane enhancement for gasoline).
• Normal butane is typically used for motor gasoline blending and as a feedstock for the production of
plastics.
• Natural gasoline is used primarily in motor gasoline blending and as a petrochemical feedstock.
Commodity price sensitivity. In general, partnerships with gathering and processing assets have more
commodity price exposure and tend to benefit during periods of high commodity prices. High prices are
likely to stimulate drilling activity and should increase production, which should, in turn, increase
volume on gathering systems. Gas processors with primarily keep-whole contracts benefit most in an
environment of high commodity prices because they are direct sellers of natural gas liquids.
Natural gas is typically processed under three primary contracts that expose the processor to varying
degrees of commodity price risk. A list of some of the most common types of contracts follows:
• Fee-based contracts. MLPs receive a fee for the volume of natural gas or NGLs that flows through
its systems. Gross margin is directly related to the volume, not the price, of the commodity flowing
through the system and the contracted fixed rate.
• Percent-of-proceeds contracts. The partnerships gather and process natural gas on behalf of
producers. The MLP sells the resulting residue gas (dry, pipeline quality gas) and NGLs at market
prices and remits to the producer an agreed upon percentage of the proceeds based on an index price.
A typical contract would entitle the producer to 80% of the proceeds from the sale of natural gas and
NGLs through the plant. The remaining 20% would be captured by the processing plant operator.
Gross margin increases as natural gas prices and NGL prices increase and decrease as natural gas
prices and NGL prices decrease.
• Percent-of-index contracts. The natural gas processor purchases natural gas at a percentage
discount to a specified index price or a specified index price less a fixed amount. The processor
gathers and delivers the natural gas to pipelines where the company resells the natural gas at the
index price. Under the percentage discount, gross margin increases when the price of natural gas
increases and decreases when the price of natural gas decreases.
• Keep-whole contracts. The partnership gathers natural gas from the producer, processes the natural
gas, and sells the resulting NGLs to third parties at market prices. Because the extraction of the
NGLs from the natural gas stream reduces the energy (Btu) content of the natural gas, the processor
must replace the natural gas (on the basis) that was extracted while processing. The processor either
purchases natural gas at the market price to return to the producer or makes a cash payment to the
producer equal to the reduced energy content. Put another way, the processor must keep the producer
“whole” on his natural gas that goes in and comes out of the processing plant. Increases in the price
of NGLs relative to natural gas increases gross margin, commonly referred to as the “frac spread,”
while decreases in the price of NGLs relative to natural gas reduces gross margin.
WACHOVIA CAPITAL MARKETS, LLC
MLP Primer Third Edition EQUITY RESEARCH DEPARTMENT
25
Hedging commodity price exposure. Gathering and processing MLPs with commodity price exposure
typically have hedging programs to mitigate a substantial portion of that price risk. MLPs, in general,
tend to hedge 70-80% of their near-term exposure and, to a lesser degree, on a 3-5 year basis.
Partnerships use a variety of derivative contracts and option strategies to mitigate their exposure,
including swaps, puts, calls, collars, etc.
Price relationship between crude oil and natural gas liquids. Over the past three years, NGL prices
have been, on average, approximately 68% correlated with crude prices. This price relationship between
natural gas liquids and crude oil is meaningful for gathering and processing MLPs that use “dirty” crude
oil hedges as a proxy to hedge NGL exposure (as opposed to hedging the individual NGL components).
Some gathering and processing MLPs prefer to use dirty hedges to manage their NGL exposure due to a
more liquid crude oil derivatives market (i.e., the NGL market has limited liquidity) and a historically
strong correlation between crude oil and NGL prices. However, the use of dirty hedges could prove
ineffective if the correlation between NGL and crude oil prices deteriorates.
Figure 29. Historical NGL-To-Crude Oil Ratio
50%
60%
70%
80%
90%
100%
Jan-04 Jan-05 Jan-06 Jan-07 Jan-08
NGL (Mt. Belvieu) To Crude Oil (WTI) Ratio (%)
2004 Average: 73%
2005 Average: 67%
2006 Average: 63%
2007 Average: 70% (*)
2008 YTD Avg: 59%
Current: 59.0%
Data
Missing
Current NGL price ($/g): 1.96
Current oil price ($/Bbl): $140.00
Source: Bloomberg
Mark-to-market hedge accounting. A company that uses mark-to-market accounting could report
significant earnings’ volatility; however, a majority of the volatility is usually non-cash. We do not pay
as close attention to earnings per unit (EPU), as we believe the focus for MLPs should be on cash flow
rather than earnings.
Mark-to-market hedge accounting assigns a value to a company’s derivatives positions based on the
current market prices for those derivative instruments. For example, the value of a futures contract with
an expiration date of one year from today is not known until it expires. However, if the contract is
marked-to-market, the futures contract is assigned a value based on current market prices.
The impact of mark-to-marketing accounting affects different parts of a company’s financial statements
depending on whether the derivative is classified as “trading” or “other than trading.” Derivatives
classified as trading are recognized as assets or liabilities with the corresponding loss or gain recognized
in the income statement. Derivatives classified as other than trading are also measured at fair value and
recognized as assets or liabilities, with the changes in value included as a component of stockholders’
equity until realized. Realized gains and losses would be included in earnings.
In order to offset the mark-to-market movement of derivatives, some companies may employ hedge
accounting (i.e., if the company is able to qualify).
Hedge accounting. Financial Accounting Standards Board (FASB) Statement No. 133 allows companies
to recognize all derivatives as assets or liabilities and at fair value. The changes in the fair value of the
derivatives are recognized in the company’s earnings over time unless certain hedging criteria are met.