Báo cáo khoa học: "Changes in central venous saturation after major surgery, and association with outcome" pdf
Bạn đang xem bản rút gọn của tài liệu. Xem và tải ngay bản đầy đủ của tài liệu tại đây (217.22 KB, 6 trang )
Open Access
Available online />R694
Vol 9 No 6
Research
Changes in central venous saturation after major surgery, and
association with outcome
Rupert Pearse, Deborah Dawson, Jayne Fawcett, Andrew Rhodes, R Michael Grounds and E
David Bennett
Adult Intensive Care Unit, 1st floor St James' Wing, St George's Hospital, Blackshaw Road, London SW17 0QT, UK
Corresponding author: Rupert Pearse,
Received: 8 Sep 2005 Accepted: 30 Sep 2005 Published: 8 Nov 2005
Critical Care 2005, 9:R694-R699 (DOI 10.1186/cc3888)
This article is online at: />© 2005 Pearse et al.; licensee BioMed Central Ltd.
This is an open access article distributed under the terms of the Creative Commons Attribution License ( />),
which permits unrestricted use, distribution, and reproduction in any medium, provided the original work is properly cited.
Abstract
Introduction Despite recent interest in measurement of central
venous oxygen saturation (ScvO
2
), there are no published data
describing the pattern of ScvO
2
changes after major general
surgery or any relationship with outcome.
Methods ScvO
2
and other biochemical, physiological and
demographic data were prospectively measured for 8 hours
after major surgery. Complications and deaths occurring within
28 days of enrolment were included in the data analysis.
Independent predictors of complications were identified with
the use of logistic regression analysis. Optimum cutoffs for
ScvO
2
were identified by receiver operator characteristic
analysis.
Results Data from 118 patients was analysed; 123 morbidity
episodes occurred in 64 these patients. There were 12 deaths
(10.2%). The mean ± SD age was 66.8 ± 11.4 years. Twenty
patients (17%) underwent emergency surgery and 77 patients
(66%) were male. The mean ± SD P-POSSUM (Portsmouth
Physiologic and Operative Severity Score for the enUmeration
of Mortality and morbidity) score was 38.6 ± 7.7, with a
predicted mortality of 16.7 ± 17.6%. After multivariate analysis,
the lowest cardiac index value (odds ratio (OR) 0.58 (95%
confidence intervals 0.37 to 0.9); p = 0.018), lowest ScvO
2
value (OR 0.94 (0.89 to 0.98); p = 0.007) and P-POSSUM
score (OR 1.09 (1.02 to 1.15); p = 0.008) were independently
associated with post-operative complications. The optimal
ScvO
2
cutoff value for morbidity prediction was 64.4%. In the
first hour after surgery, significant reductions in ScvO
2
were
observed, but there were no significant changes in CI or oxygen
delivery index during the same period.
Conclusion Significant fluctuations in ScvO
2
occur in the
immediate post-operative period. These fluctuations are not
always associated with changes in oxygen delivery, suggesting
that oxygen consumption is also an important determinant of
ScvO
2
. Reductions in ScvO
2
are independently associated with
post-operative complications.
Introduction
The successful use of central venous oxygen saturation
(ScvO
2
) as a haemodynamic goal in the management of early
sepsis has led to interest in the use of this parameter in surgi-
cal patients [1]. ScvO
2
measurement requires placement of a
central venous catheter so that the tip lies in the superior vena
cava. Readings may be taken intermittently by blood sampling
and co-oximetry, or continuously with a spectrophotometric
catheter. Experimental studies have shown that changes in
ScvO
2
closely reflect circulatory disturbances during periods
of hypoxia, haemorrhage and subsequent resuscitation [2,3].
Fluctuations correlate well with those of mixed venous satura-
tion (SvO
2
), although absolute values differ [2,3]. Observa-
tional studies have described changes in ScvO
2
in various
groups [4]. In particular, the prognostic significance of ScvO
2
reductions to below 65% has been demonstrated in trauma
APACHE = Acute Physiology and Chronic Health Evaluation; CI = cardiac index; DO
2
I = oxygen delivery index; GDT = goal-directed therapy; ICU =
intensive care unit; OR = odds ratio; P-POSSUM = Portsmouth Physiologic and Operative Severity Score for the enUmeration of Mortality and mor-
bidity; ScvO
2
= central venous saturation.
Critical Care Vol 9 No 6 Pearse et al.
R695
[5], severe sepsis [6], myocardial infarction [7] and cardiac
failure [8]. However, the only interventional trial of ScvO
2
con-
ducted so far used a goal of 70% [1].
Although the association between cardiac index (CI), oxygen
delivery index (DO
2
I) and related parameters and outcome
after major surgery has been well described [9-14], only lim-
ited data are available describing ScvO
2
values in the peri-
operative period [15]. The physiology of ScvO
2
disturbances
is complex. The value of ScvO
2
is determined by changes in
oxygen delivery and consumption, both of which are subject to
considerable variation during the peri-operative period [4]. It is
not appropriate to assume that either the normal value or fluc-
tuations in ScvO
2
will be similar to those of other patient
groups. If ScvO
2
is to be used in the haemodynamic assess-
ment of surgical patients, more detailed information is required
describing fluctuations during the peri-operative period. The
aim of this study was to describe changes in ScvO
2
after major
general surgery and their relationship to outcome.
Methods
Patients
ScvO
2
data were collected from adult patients enrolled in the
randomised study of post-operative goal-directed therapy
(GDT) [16]. All patients were deemed to be at high risk of
post-operative complications and were admitted to the inten-
sive care unit (ICU) immediately after major surgery. This study
was approved by the Local Research Ethics Committee of St
George's Healthcare National Health Service Trust.
Assessment
All patients had arterial and central venous catheters placed
before the commencement of surgery. The central venous
catheter was positioned with the tip within the superior vena
cava immediately above the right atrium. This position was ver-
ified by chest radiograph and adjusted if necessary. The fol-
lowing parameters were monitored continuously from arrival in
the ICU immediately after surgery and for the next 8 hours:
electrocardiograph, pulse oximetry, invasive arterial pressure,
central venous pressure and cardiac output. Arterial and cen-
tral venous blood gas analyses were performed by intermittent
blood sampling and co-oximetry (ABL 700; Radiometer,
Copenhagen, Denmark) at baseline and hourly during the 8
hours after surgery. This equipment was calibrated each hour,
and routine quality control checks were performed. Cardiac
output was measured by lithium indicator dilution and pulse
power analysis (LiDCO plus system; LiDCO Ltd., Cambridge,
UK). P-POSSUM (Portsmouth Physiologic and Operative
Severity Score for the enUmeration of Mortality and morbidity)
and APACHE II (Acute Physiology and Chronic Health Evalu-
ation II) scores were calculated at admission to the ICU
[17,18]. Complications and deaths occurring within 28 days
of enrolment were included in the data analysis. Complications
were prospectively defined, diagnosed by clinical staff and
verified by a member of the research team. This process
involved daily inspection of notes, radiological investigations,
laboratory data and clinical assessment.
Table 1
Demographic and biochemical data for patients with and without post-operative morbidity
Data class Complications (n = 64) No complications (n = 53) p
Demographic
Age (years) 67.0 ± 12.3 66.7 ± 10.4 0.89
Blood loss (ml) 1,200 (520–2,000) 1,000 (725–2,350) 0.88
GDT 27/64 (42%) 35/53 (66%) 0.02*
APACHE II score 9.9 ± 4.3 9.0 ± 3.8 0.28
P-POSSUM score 40.1 ± 8.1 36.8 ± 6.8 0.02*
ASA score 3 (2–3) 3 (2–3) 0.61
Biochemical
Baseline base excess (mmol l
-1
) -2.62 ± 3.03 -2.40 ± 3.31 0.71
Lowest base excess (mmol l
-1
) -3.67 ± 3.04 -4.30 ± 3.17 0.29
Base excess, 8-hour mean (mmol l
-1
) -2.73 ± 3.83 -2.31 ± 3.15 0.44
Baseline lactate (mmol l
-1
) 1.49 ± 0.81 1.38 ± 0.74 0.43
Highest lactate (mmol l
-1
) 1.93 ± 1.30 1.80 ± 0.88 0.55
Lactate, 8-hour mean (mmol l
-1
) 1.29 ± 0.81 1.23 ± 0.55 0.65
*Statistically significant difference. Data are presented as means ± SD, medians (interquartile range) or absolute values (%). APACHE, Acute
Physiology and Chronic Health Evaluation; GDT, patients receiving goal-directed therapy; P-POSSUM, Portsmouth Physiologic and Operative
Severity Score for the enUmeration of Mortality and morbidity
Available online />R696
Clinical management
Protocols for cardiovascular management during the immedi-
ate post-operative period are provided in detail elsewhere
[16]. Fluid challenges were guided by central venous pressure
in 56 patients and by stroke volume in 61 patients. The latter
group also received dopexamine if they did not achieve a DO
2
I
of 600 ml min
-1
m
-2
with fluid alone (GDT group). Once the 8-
hour study period was complete, all patients received stand-
ard care for the remainder of their ICU and hospital stay.
ScvO
2
data were not used to guide clinical management at
any stage.
Statistical analysis
Data are presented as means ± SD where normally distrib-
uted, as medians (interquartile range) where not normally dis-
tributed or, for categorical variables, as a percentage of the
group from which they were derived. Normality was tested
with the Kolmogorov–Smirnov test. Categorical data were
tested with Fisher's exact test. Continuous data were tested
with the t test where normally distributed and the Mann–Whit-
ney U test where not normally distributed. Trends in physiolog-
ical parameters over time in the two groups were compared
with repeated-measures analysis of variance with Tukey's cor-
rection for multiple comparisons.
Univariate analysis was performed to test association with
complications and death. For data recorded hourly during the
study period, the baseline values, lowest values and the mean
over the 8-hour study period were tested. A multiple logistic
regression model was used to identify independent risk fac-
tors for post-operative complications. A stepwise approach
was used to enter new terms into the logistic regression
model, where p < 0.05 was set as the limit for inclusion of new
terms. Results of logistic regression are reported as adjusted
odds ratios (ORs) with 95% confidence intervals. Receiver
operator characteristic curves were constructed to identify
optimal cutoff values for association with outcome. The opti-
mum cutoff was defined as the value associated with the high-
est sum of sensitivity and specificity. Analysis was performed
with GraphPad Prism version 4.0 for Windows (GraphPad
Software, San Diego, CA, USA) and significance was set at p
< 0.05.
Table 2
Haemodynamic data for patients with and without post-operative morbidity
Data class Complications (n = 64) No complications (n = 53) p
Haemodynamic
Baseline heart rate (beats min
-1
) 82.1 ± 21.4 81.5 ± 15.5 0.87
Highest heart rate (beats min
-1
) 100.3 ± 19.9 106.6 ± 22.4 0.11
Heart rate, 8-hour mean (beats min
-1
) 86.0 ± 16.3 90.3 ± 16.0 0.15
Baseline MAP (mmHg) 93.9 ± 19.4 99.6 ± 20.2 0.12
Lowest MAP (mmHg) 74.5 ± 14.7 76.3 ± 12.8 0.48
MAP, 8 hour mean (mmHg) 90.8 ± 15.3 92.5 ± 12.9 0.52
Baseline CI (l min
-1
m
-2
) 3.59 ± 1.39 3.87 ± 1.43 0.30
Lowest CI (l min
-1
m
-2
) 2.74 ± 0.79 3.25 ± 1.32 0.02*
CI, 8-hour mean (l min
-1
m
-2
) 3.93 ± 1.07 4.20 ± 1.55 0.30
Baseline DO
2
I (ml min
-1
m
-2
) 494 ± 191 541 ± 229 0.26
Lowest DO
2
I (ml min
-1
m
-2
) 364 ± 158 445 ± 218 0.02*
DO
2
I, 8-hour mean (ml min
-1
m
-2
) 517 ± 206 581 ± 255 0.13
Baseline stroke volume (ml) 84 ± 30 88 ± 33 0.44
Lowest stroke volume (ml) 62 ± 25 70 ± 30 0.12
Stroke volume, 8-hour mean (ml) 70 ± 31 86 ± 32 0.29
ScvO
2
Baseline (%) 76.2 ± 9.9 78.7 ± 6.2 0.11
Lowest (%) 63.4 ± 10.4 67.1 ± 7.7 0.03*
8-hour mean (%) 73.0 ± 6.6 75.0 ± 5.6 0.09
*Statistically significant difference. Data are presented as means ± SD. CI, cardiac index; DO
2
I, oxygen delivery index; MAP, mean arterial
pressure; ScvO
2
, central venous saturation.
Critical Care Vol 9 No 6 Pearse et al.
R697
Results
Data was collected from 117 patients between November
2002 and August 2004. Five patients were excluded from the
analysis because ScvO
2
data were collected with a spectro-
photometric catheter. Sixty-four patients developed 123 com-
plications in all. There were 12 deaths (10.2%). The mean ±
SD age was 66.8 ± 11.4 years. Twenty patients (17%) under-
went emergency surgery and 77 patients (66%) were male.
The APACHE II score was 9.5 ± 4.1, with a predicted mortality
of 10.3 ± 9.0%. The P-POSSUM score was 38.6 ± 7.7, with
a predicted mortality of 16.7 ± 17.6%. Fifty-seven (49%)
patients were extubated within 1 hour of surgery and a further
29 (25%) were extubated before the end of the 8-hour study
period.
Associations with outcome
Commonly measured physiological, biochemical and demo-
graphic variables are presented in Tables 1 and 2. Although
derangements in CI, DO
2
I and ScvO
2
were frequently
observed, other parameters remained within the normal range
or were only slightly abnormal. Univariate analysis identified
five variables associated with post-operative complications.
These were the lowest ScvO
2
value, the lowest DO
2
I value,
the lowest CI value, the P-POSSUM score and the use of
GDT. After multivariate analysis, the lowest CI value (OR 0.58
(95% confidence interval 0.37 to 0.9); p = 0.018), the lowest
ScvO
2
value (OR 0.94 (0.89 to 0.98); p = 0.007) and P-POS-
SUM score (OR 1.09 (1.02 to 1.15); p = 0.008) were inde-
pendently associated with post-operative complications. The
lowest DO
2
I value and use of GDT were not independent pre-
dictors of outcome. The optimal value of ScvO
2
to discriminate
between patients who did or did not develop complications
was 64.4% (sensitivity 67%, specificity 56%). Univariate anal-
ysis identified no associations with mortality.
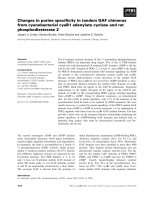
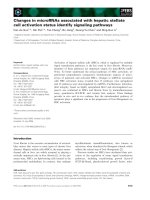
Trends in ScvO
2
Patients were divided into two groups by using the optimal
cutoff value for ScvO
2
. Those in whom the lowest ScvO
2
value
was 64.4% or below were defined as the low ScvO
2
group
and those in whom the lowest value was above 64.4% were
defined as the high ScvO
2
group (see Table 3). Trends in
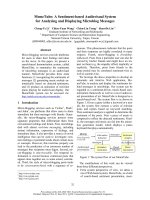
ScvO
2
and DO
2
I are presented in Figures 1 and 2. During the
first post-operative hour there was a significant decrease in
ScvO
2
in both the high ScvO
2
group (79.8 ± 6.3% to 77.7 ±
5.8%; p = 0.016) and the low ScvO
2
group (74.6 ± 9.7% to
66.6 ± 10.3%; p < 0.0001). DO
2
I and CI values did not
change significantly during this time.
Discussion
The major finding of this study is the occurrence of considera-
ble fluctuations in ScvO
2
after major general surgery that have
prognostic significance. Multivariate analysis identified the
lowest ScvO
2
value, lowest CI value and P-POSSUM score as
independent predictors of complications. This observation
supports the hypothesis that the association between reduc-
tions in ScvO
2
and outcome is similar to that observed previ-
ously for CI and DO
2
I [9-13]. It is interesting to note that P-
POSSUM score was an independent predictor of complica-
tions, but APACHE II score was not. This may be because P-
POSSUM score was designed for use in surgical patients
using data from the UK, whereas APACHE II was designed for
use in mixed groups of critically ill patients using data from
North America [17,18]. As might be expected, the use of GDT
was associated with fewer post-operative complications.
However, this association was not independent of other
predictors of outcome. The observation of collinearity between
CI, DO
2
I and the use of GDT suggests that the level of DO
2
I
achieved by individual patients is more important than the
approach to haemodynamic management.
Table 3
Demographic and outcome data for high-ScvO
2
and low-ScvO
2
groups
Parameter High ScvO
2
Low ScvO
2
p
Number in group 64 53 -
Age 66 ± 12 69 ± 11 0.40
P-POSSUM 37.8 ± 7.4 39.0 ± 7.5 0.39
APACHE II score 9.8 ± 4.3 9.0 ± 3.9 0.30
Length of hospital stay (days) 12 (9–15) 14 (9–25) 0.25
Complications (number of patients) 29 (45%) 35 (66%) 0.03*
Complications (episodes per patient) 0.8 ± 1.1 1.4 ± 1.4 0.04*
Mortality 7 (11%) 4 (7%) 0.54
*Statistically significant difference. Data are presented as means ± SD, medians (interquartile range) or absolute values (%). APACHE, Acute
Physiology and Chronic Health Evaluation; P-POSSUM, Portsmouth Physiologic and Operative Severity Score for the enUmeration of Mortality
and morbidity; ScvO
2
, central venous saturation.
Available online />R698
The optimal cutoff value of ScvO
2
for prediction of complica-
tions was 64.4%. This is very similar to the value (65%) iden-
tified in other patient groups [5-7]. Large fluctuations in ScvO
2
occur during the peri-operative period. Values of ScvO
2
decreased significantly during the first hour after surgery, while
CI and DO
2
I remained unchanged. A significant increase in
oxygen consumption therefore occurred during this period
despite the fact that fewer than half of the patients were extu-
bated within 1 hour of surgery. This finding is consistent with
previous findings in cardiac surgical patients [14], as well as
earlier work by Shoemaker [13]. Post-operative oxygen con-
sumption is determined by various factors including pain,
emergence from anaesthesia, body temperature and shivering.
Peri-operative disturbances of ScvO
2
cannot therefore be
assumed to relate solely to DO
2
I.
The 8-hour mean of ScvO
2
was 75.0% in patients who did not
develop post-operative complications. This value was compa-
rable to previous measurements in healthy conscious patients
[19,20], but higher than those taken immediately before induc-
tion of anaesthesia [15] and in patients with good outcome
after trauma, severe sepsis, cardiac failure or myocardial inf-
arction [5-8]. It is notable that derangements in CI, DO
2
I and
ScvO
2
were observed in the absence of similar disturbances
in other commonly measured biochemical and physiological
variables. This was despite the high rates of morbidity and
mortality in the study population. It is possible that distur-
bances in ScvO
2
, CI and DO
2
I might indicate the presence of
occult tissue hypoperfusion before disturbances in other
parameters.
The use of observational data from an interventional trial has
both advantages and disadvantages. In this study, goals for
arterial oxygen saturation, haemoglobin, heart rate, mean arte-
rial pressure, serum lactate and urine output were the same in
all patients. All clinical management and data collection were
closely supervised by a member of the research team in
accordance with a carefully defined treatment protocol. The
benefit of such rigorous study design must be offset against
the fact that, in some patients, intravenous fluid administration
was guided by central venous pressure, whereas in others
fluid management was guided by stroke volume and supple-
mented with low-dose dopexamine. It is an inherent problem
with studies of this type that the predictive nature of certain
variables may relate both to the initial cardiovascular distur-
bance and subsequent attempts to correct it. The large
number of statistical comparisons performed in the univariate
analyses may seem speculative. This is not the case; compar-
isons made were of variables in which an association with out-
come had previously been suggested [9-14,17,18,21]. We
were therefore obliged to identify all such associations in the
available data.
Conclusion
Reductions in ScvO
2
are common after major surgery and are
associated with an increased rate of post-operative complica-
tions. Peri-operative changes in ScvO
2
relate to both oxygen
consumption and delivery. Further evaluation of peri-operative
trends in ScvO
2
should be performed before this variable is
used as a haemodynamic goal in surgical patients.
Competing interests
RP received a travel grant from LiDCO Ltd. to present data at
an international meeting. JF has previously performed
Figure 1
Central venous saturation (ScvO
2
) in the 8 hours after major surgeryCentral venous saturation (ScvO
2
) in the 8 hours after major surgery.
Results are means ± SD. *p < 0.0001 for low ScvO
2
group; p = 0.02
for high ScvO
2
group. The difference between the high and low groups
is significant overall and for each individual time point (p < 0.0001).
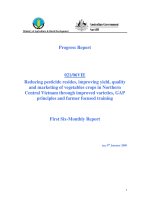
Figure 2
Oxygen delivery index (DO
2
I) in the 8 hours after major surgeryOxygen delivery index (DO
2
I) in the 8 hours after major surgery. Results
are means ± SD. The difference between the group with high central
venous saturation (ScvO
2
) and the low ScvO
2
group is significant over-
all (p = 0.005) but not for individual time points 7 and 8.
Key messages
• The successful use of central venous saturation in the
management of severe sepsis has led to interest in the
use of this variable in surgical patients.
• This analysis suggests that central venous saturation
may have prognostic significance following major
surgery.
• Further evaluation of peri-operative trends in central
venous saturation is required.
Critical Care Vol 9 No 6 Pearse et al.
R699
consultancy work for LiDCO Ltd. DB currently performs con-
sultancy work for LiDCO Ltd. and has previously performed
consultancy work for Deltex Ltd. No other competing interests
are declared.
Authors' contributions
RP, AR and DB were responsible for study design. RP, DD
and JF were responsible for data collection. All authors were
involved in data analysis and drafting the manuscript and
approved the final version. All authors had full access to data
and take responsibility for the integrity of the data and the
accuracy of the analysis.
References
1. Rivers E, Nguyen B, Havstad S, Ressler J, Muzzin A, Knoblich B,
Peterson E, Tomlanovich M, Early Goal-Directed Therapy Collabo-
rative Group: Early goal-directed therapy in the treatment of
severe sepsis and septic shock. N Engl J Med 2001,
345:1368-1377.
2. Scalea TM, Holman M, Fuortes M, Baron BJ, Phillips TF, Goldstein
AS, Sclafani SJ, Shaftan GW: Central venous blood oxygen sat-
uration: an early, accurate measurement of volume during
hemorrhage. J Trauma 1988, 28:725-732.
3. Reinhart K, Rudolph T, Bredle DL, Hannemann L, Cain SM: Com-
parison of central-venous to mixed-venous oxygen saturation
during changes in oxygen supply/demand. Chest 1989,
95:1216-1221.
4. Pearse RM, Rhodes A: Mixed and central venous oxygen satu-
ration. In Yearbook of Intensive Care and Emergency Medicine
Edited by: Vincent JL. Berlin: Springer; 2005:592-602.
5. Scalea TM, Hartnett RW, Duncan AO, Atweh NA, Phillips TF, Scla-
fani SJ, Fuortes M, Shaftan GW: Central venous oxygen satura-
tion: a useful clinical tool in trauma patients. J Trauma 1990,
30:1539-1543.
6. Rady MY, Rivers EP, Martin GB, Smithline H, Appelton T, Nowak
RM: Continuous central venous oximetry and shock index in
the emergency department: use in the evaluation of clinical
shock. Am J Emerg Med 1992, 10:538-541.
7. Hutter AM Jnr, Moss AJ: Central venous oxygen saturations.
Value of serial determinations in patients with acute myocar-
dial infarction. JAMA 1970, 212:299-303.
8. Ander DS, Jaggi M, Rivers E, Rady MY, Levine TB, Levine AB, Mas-
ura J, Gryzbowski M: Undetected cardiogenic shock in patients
with congestive heart failure presenting to the emergency
department. Am J Cardiol 1998, 82:888-891.
9. Kusano C, Baba M, Takao S, Sane S, Shimada M, Shirao K, Nat-
sugoe S, Fukumoto T, Aikou T: Oxygen delivery as a factor in the
development of fatal postoperative complications after
oesophagectomy. Br J Surg 1997, 84:252-257.
10. Bland RD, Shoemaker WC, Abraham E, Cobo JC: Hemodynamic
and oxygen transport patterns in surviving and nonsurviving
postoperative patients. Crit Care Med 1985, 13:85-90.
11. Peerless JR, Alexander JJ, Pinchak AC, Piotrowski JJ, Malangoni
MA: Oxygen delivery is an important predictor of outcome in
patients with ruptured abdominal aortic aneurysms. Ann Surg
1998, 227:726-732.
12. Poeze M, Ramsay G, Greve JW, Singer M: Prediction of postop-
erative cardiac surgical morbidity and organ failure within 4
hours of intensive care unit admission using esophageal Dop-
pler ultrasonography. Crit Care Med 1999, 27:1288-1294.
13. Shoemaker WC, Montgomery ES, Kaplan E, Elwyn DH: Physio-
logic patterns in surviving and nonsurviving shock patients.
Use of sequential cardiorespiratory variables in defining crite-
ria for therapeutic goals and early warning of death. Arch Surg
1973, 106:630-636.
14. Polonen P, Hippelainen M, Takala R, Ruokonen E, Takala J: Rela-
tionship between intra- and postoperative oxygen transport
and prolonged intensive care after cardiac surgery: a prospec-
tive study. Acta Anaesthesiol Scand 1997, 41:810-817.
15. Jenstrup M, Ejlersen E, Mogensen T, Secher NH: A maximal cen-
tral venous oxygen saturation (SvO
2
max) for the surgical
patient. Acta Anaesthesiol Scand Suppl 1995, 107:29-32.
16. Pearse R, Dawson D, Fawcett J, Rhodes A, Grounds M, Bennett
D: Early goal directed therapy reduces morbidity and length of
hospital stay following high-risk surgery. Crit Care in press.
17. Prytherch DR, Whiteley MS, Higgins B, Weaver PC, Prout WG,
Powell SJ: POSSUM and Portsmouth POSSUM for predicting
mortality. Physiological and Operative Severity Score for the
enUmeration of Mortality and morbidity. Br J Surg 1998,
85:1217-1220.
18. Knaus WA, Draper EA, Wagner DP, Zimmerman JE: APACHE II: a
severity of disease classification system. Crit Care Med 1985,
13:818-829.
19. Madsen P, Iversen H, Secher NH: Central venous oxygen satu-
ration during hypovolaemic shock in humans. Scand J Clin
Lab Invest 1993, 53:67-72.
20. Barratt-Boyes BG, Wood EH: The oxygen saturation of blood in
the venae cavae, right-heart chambers, and pulmonary ves-
sels of healthy subjects. J Lab Clin Med 1957, 50:93-106.
21. Smith I, Kumar P, Molloy S, Rhodes A, Newman PJ, Grounds RM,
Bennett ED: Base excess and lactate as prognostic indicators
for patients admitted to intensive care. Intensive Care Med
2001, 27:74-83.