Báo cáo khoa học: Changes in acetylcholine receptor function induce shifts in muscle fiber type composition docx
Bạn đang xem bản rút gọn của tài liệu. Xem và tải ngay bản đầy đủ của tài liệu tại đây (756.37 KB, 13 trang )
Changes in acetylcholine receptor function induce shifts
in muscle fiber type composition
Tae-Eun Jin1,*, Anton Wernig2 and Veit Witzemann1
1 Abt. Zellphysiologie, Max-Planck-Institut fur Medizinische Forschung, Heidelberg, Germany
ă
2 Institut fur Physiologie, Universitat Bonn, Germany
ă
ă
Keywords
acetylcholine receptor; acetylcholine
receptor e-subunit knockout mice; fast and
slow muscle; ber type; real-time PCR
Correspondence
V. Witzemann, Abt. Zellphysiologie,
Max-Planck-Institut fur Medizinische
ă
Forschung, Jahnstr. 29, D-69120
Heidelberg, Germany
Fax: +49 6221 486459
Tel: +49 6221 486475
E-mail:
*Present address
Center for Cell Signaling Research, Ewha
Woman’s University, Seoul, South Korea
(Received 9 January 2008, revised 12
February 2008, accepted 25 February 2008)
doi:10.1111/j.1742-4658.2008.06359.x
AChRe) ⁄ ) mice lack e-subunits of the acetylcholine receptor and thus fail
to express adult-type receptors. The expression of fetal-type receptors
throughout postnatal life alters postsynaptic signal transduction and causes
a fast-to-slow fiber type transition, both in slow-twitch soleus muscle and
in fast-twitch extensor digitorum longus muscle. In comparison to wildtype muscle, the proportion of type 1 slow fibers is significantly increased
(6%), whereas the proportion of fast fibers is reduced (in soleus, type 2A
by 12%, and in extensor digitorum longus, type 2B ⁄ 2D by 10%). The
increased levels of troponin Islow transcripts clearly support a fast-to-slow
fiber type transition. Shifts of protein and transcript levels are not
restricted to ‘myogenic’ genes but also affect ‘synaptogenic’ genes. Clear
increases are observed for acetylcholine receptor a-subunits and the postsynaptically located utrophin. Although the fast-to-slow fiber type transition appears to occur in a coordinated manner in both muscle types,
muscle-specific differences are retained. Most prominently, the differential
expression level of the synaptic regulator MuSK is significantly lower in
extensor digitorum muscle than in soleus muscle. The results show a new
quality in muscle plasticity, in that changes in the functional properties of
endplate receptors modulate the contractile properties of skeletal muscles.
Muscle thus represents a self-matching system that adjusts contractile properties and synaptic function to variable functional demands.
The impact of innervation on the establishment of specific muscle fiber types during embryonic and postnatal
development has been demonstrated in numerous studies [1], and has been attributed to the specific neural
impulse pattern [2] that can be mimicked partially by
electrical stimulation [3,4]. Skeletal muscles adapt to
specific functions and have, throughout development,
the capacity to change their phenotype in response to
altered functional demands. Their phenotypic profiles
are affected not only by innervation ⁄ neuromuscular
activity, but also by exercise training, mechanical load-
ing ⁄ unloading, hormones, and aging, causing transitions from fast-to-slow or slow-to-fast fiber types.
Muscle activity has also been shown to induce structural and functional adaptations of the neuromuscular
junction (NMJ), suggesting that muscle function, fiber
type composition and plasticity of the NMJ may be
linked [5]. In order to identify the contributions of
postsynaptic signaling to adaptation of muscle function, it is necessary to modulate activity specifically
at endplate acetylcholine receptors (AChRs), leaving
neuronal inputs unchanged and avoiding complex
Abbreviations
AChR, acetylcholine receptor; BS, blocking solution; CSA, cross-sectional area; EDL, extensor digitorum longus muscle; GABP, growthassociated binding protein; GAPDH, glyceraldehyde-3-phosphate dehydrogenase; MuSK, muscle, skeletal, receptor tyrosine kinase;
MyHC, myosin heavy chain; NFAT, nuclear factor of activated T cells; NMJ, neuromuscular junction; P, postnatal day; SOL, soleus muscle;
Utrn, utrophin.
2042
FEBS Journal 275 (2008) 2042–2054 ª 2008 The Authors Journal compilation ª 2008 FEBS
T.-E. Jin et al.
treatments that affect both presynaptic and postsynaptic signaling, such as denervation, pharmacological
blockade, and exercise training.
Mammalian AChRs are expressed in two forms:
Embryonic-type AChRc, composed of a2bcd subunits,
is replaced during postnatal development by adult-type
AChRe, composed of a2bed subunits [6,7]. As a result,
endplate AChRs have reduced channel open times,
increased ion conductance, and higher Ca2+ permeability [6,8,9]. Muscles of AChRe) ⁄ ) mice lack adulttype AChRe and express instead embryonic-type
AChRc throughout postnatal life. Nevertheless, molecular maturation of the postsynaptic apparatus proceeds in the absence of the AChRe, and all endplates
are apposed by nerve endings that appear to be normal
in structure and function despite progressive AChR
deficiency with increasing age [10,11]. Thus, the
AChRe) ⁄ ) mice provide a model system for altered
postsynaptic signaling.
We analyzed the muscle fiber type composition in
skeletal muscle of AChRe) ⁄ ) and wild-type mice, with
the aim of answering the following questions: (a) what
is the composition of muscle fiber type of the slowtwitch soleus (SOL) muscle and the fast-twitch extensor digitorum longus (EDL) muscle; (b) is the fiber
type composition changed in AChRe) ⁄ ) mice; (c) are
changes in fiber type correlated with the mRNA
expression pattern of muscle-specific and synapse-specific genes; and (d) are changes in the contractile
machinery linked to changes in transcript levels of
myogenic genes and synaptogenic genes that regulate,
directly or indirectly, synaptic structure ⁄ function? Our
results show that changes in the functional properties
of endplate AChRs modulate the contractile properties
of skeletal muscles and change the expression profile
of myogenic genes in a coordinated fashion.
Results
Developmental changes of muscle fiber types in
muscle of wild-type and AChRe) ⁄ ) mice
The heavy chain portion of the myosin molecule
(MyHC) determines the major functional characteristic
of distinct myosin isoforms and thus provides a particularly useful molecular marker for muscle fiber types
[12,13]. The different MyHC isoforms correlate with
the functional characteristics of the respective fiber
type in the adult muscle [1], and fiber types are classified as: type 1 with MyHC1, type 2A with MyHC2A,
type 2D with MyHC2D, and type 2B with MyHC2B.
As described in Experimental procedures, serial crosssections from SOL muscle of wild-type mice were
AChR and muscle fiber type composition
A
B
C
D
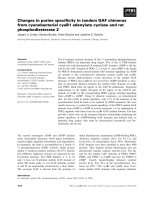
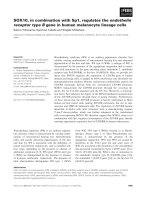
Fig. 1. Fiber type composition in SOL muscle of wild-type mice at
P85. Serial cross-sections (10 lm) were analyzed by ATPase
staining and immunochemically by using antibodies to MyHC. The
asterisk marks the position of identical muscle fibers in serial crosssections. (i) Type 1 muscle fiber. (a) Type 2A muscle fiber.
(b) Type 2B ⁄ 2D muscle fiber. Scale bar in (D) is 100 lm. (A)
ATPase staining at pH 4.6 identifies type 1 fibers (dark stain),
type 2A fibers (light stain), and type 2B ⁄ 2D fibers (intermediate
stain). (B) ATPase staining at pH 9.4 identifies type 1 fibers (light
stain), and type 2 fibers (dark stain). (C) Immunochemical staining
using antibody to MyHC1 (MY-32 at a 1 : 1000 dilution) identifies
type 1 fibers. (D) Immunochemical staining using antibody to
MyHC2 (NOQ7.5.4.D at a 1 : 200 dilution) identifies type 2 fibers.
stained with hematoxylin ⁄ eosin to visualize the individual muscle fibers. In addition, type 1, 2A and 2B ⁄ 2D
fibers were clearly identified by ATPase staining at
pH 4.6 (Fig. 1A) and at pH 9.4 (Fig. 1B). Type 1 and
2 fibers were also visualized by immunochemical staining (Fig. 1C,D). These staining procedures were
employed to compare the fiber type composition of
SOL and EDL muscles in wild-type and AChRe) ⁄ )
mice.
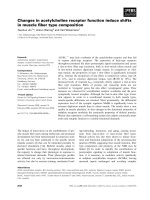
Because the fiber type composition of muscle
changes during postnatal development [14,15], we first
determined the time when adult MyHC isoforms were
expressed at constant levels in the SOL muscle of wildtype mice (Fig. 2A–D). ATPase staining at pH 4.6
identified type 1(dark stain), 2A (light stain), and
2B ⁄ 2D (intermediate stain) fibers, and showed that
between postnatal day (P)15 and P20, the proportion
of slow type 1 and fast type 2A fibers was still variable. After P20, from P60 up to P85, the fiber types
remained at constant levels (Fig. 2E,F). At all stages, a
few fast fibers, type 2B ⁄ 2D (0 £ 1% of the total fibers),
were detectable. Throughout the postnatal period
analyzed here, the cross-sectional areas (CSAs) of
single muscle fibers increased (Fig. 2F,G).
FEBS Journal 275 (2008) 2042–2054 ª 2008 The Authors Journal compilation ª 2008 FEBS
2043
AChR and muscle fiber type composition
A
T.-E. Jin et al.
E
Fiber types (% of total)
B
80
60
40
20
0
D
C
//
15
20
60
87
Total fibers
G
Type 2a
Type 1
CSA (µm2)
F
Fiber number
Postnatal days (P)
Type 1
Type 2a
Type 2b2d
Type 2b/2d
20
30
40
50
60
Postnatal days (P)
70
80
20
30
40
50
60
Postnatal days (P)
70
80
Fig. 2. Fiber type composition in SOL muscle of wild-type mice at increasing postnatal age. Cross-sections of SOL at (A) P15, (B) P20,
(C) P60, and (D) P85. (E) Developmentally regulated changes in fiber type composition in percent of total fibers (type 1 fibers, white bars;
type 2A fibers, gray bars; type 2B ⁄ 2D fibers, black bars). Original values are given in the table below the diagram. (F) Number of fiber types
increases during postnatal development. Data were collected from three different animals using cross-sections as indicated in the table (n).
(G) CSAs of fiber types increase throughout postnatal development. In each case, seven separate cross-sections were used to determine
the CSA of 50–70 fibers. ATPase staining, pH 4.6. Scale bar in (D), 100 lm.
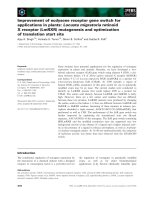
Next, we analyzed SOL muscle from AChRe) ⁄ )
mice, and representative cross-sections are shown in
Fig. 3A (P20) and Fig. 3B (P58). At P20, muscle
type 1, 2A and 2B ⁄ 2D fibers displayed a similar composition as in wild-type muscle at P15, suggesting that
postnatal differentiation in AChRe) ⁄ ) mice may be
delayed in comparison to wild-type mice. Furthermore,
fiber types had not reached constant levels at P20 and
the profile displayed a moderate but steady ‘fast-toslow’ transition throughout postnatal development.
Until P60, the type 1 fiber level had increased by 10%,
whereas type 2A fibers decreased by 17%. In addition,
there was a 7% increase in type 2B ⁄ 2D fibers
(Fig. 3C). The values shown in Fig. 3D demonstrate
the significance of the observed changes.
AChRe) ⁄ ) mice develop severe muscle weakness and
muscle atrophy during postnatal age, which might
affect fiber number and ⁄ or reduce muscle mass. Therefore, we not only followed myofiber type transitions,
2044
but also counted the total number of muscle fibers and
determined the CSAs in SOL mucle of AChRe) ⁄ ) mice
(Fig. 4A–C). In spite of progressive muscle weakness
and the observed fast-to-slow fiber type transition, the
total number of fibers (Fig. 4A,B) was comparable to
that in wild-type SOL muscle (Fig. 2F), and the CSAs
increased until P60 (Fig. 4A,C), as observed in wildtype mice (Fig. 2G).
Muscle fiber types in SOL and EDL muscle from
wild-type and AChRe) ⁄ ) mice
To confirm the observed fast-to-slow shift in fiber type
composition in SOL muscle from AChRe) ⁄ ) and wildtype mice, we compared both muscles directly under
identical experimental conditions. In SOL muscle from
AChRe) ⁄ ) mice, numbers of type 1 and 2B ⁄ 2D fibers
increased by 6%, whereas those of type 2A fibers
decreased by about 12% (Fig. 5A,C,E). The total fiber
FEBS Journal 275 (2008) 2042–2054 ª 2008 The Authors Journal compilation ª 2008 FEBS
T.-E. Jin et al.
AChR and muscle fiber type composition
A
Fiber types (% of total)
C
B
Type 1
Type 2A
Type 2B/2D
60
40
20
0
20
60
20
60
Postnatal days (P)
20
60
D
Fig. 3. Fiber type composition in SOL muscle of AChRe) ⁄ ) mice at
increasing postnatal age. Cross-sections of SOL muscle from
AChRe) ⁄ ) mice are shown, (A) at P20 and (B) at P58. ATPase staining, pH 4.6. Scale bar below (B), 100 lm. (C) Columns represent
percentage of muscle fibers in SOL muscle (% of total) at P20 and
P60, respectively, for type 1, 2A and 2B ⁄ 2D fibers, as indicated.
(D) Original values were collected from 18–72 cross-sections (n).
For mice AChRe) ⁄ ) at P20, three different animals were used to
generate the cross-sections of SOL muscle. The P60 values of
AChRe) ⁄ ) mice were from four different animals, ranging between
50 and 60 days in age.
number and the CSAs were, as noted before, comparable to those in wild-type SOL muscle (Table 1).
This raised the question of whether similar changes
were also induced in fast-twitch muscles, which differ
in their contractile properties and in their MyHC
expression profile from slow-twitch muscle. Wild-type
EDL muscles have predominantly type 2A fibers mixed
with type 2D ⁄ 2B fibers and a few type 1 fibers. The
direct comparison with EDL muscles from AChRe) ⁄ )
mice showed a 6% increase in the proportion of type 1
fibers, which was similar to the increase observed in
slow-twitch muscle. In contrast to SOL muscle, there
was a small increase of about 3% in type 2A fast
fibers, possibly at the expense of type 2B ⁄ 2D fibers,
which decreased by 10% (Fig. 5B,D,F). The CSAs of
type 2A and 2B ⁄ 2D fibers in EDL muscle from
AChRe) ⁄ ) mice were smaller than in wild-type muscle,
whereas type 1 fibers showed no significant difference
(Table 1). The total number of fibers was reduced in
EDL muscle of AChRe) ⁄ ) mice in comparison to that
of wild-type mice (Table 1).
Direct comparison of the fiber type composition in
EDL and SOL muscles from wild-type mice distinguishes EDL muscle clearly as fast muscle, in that
type 1 fibers are expressed in much lower numbers than
in SOL muscle, whereas type 2B ⁄ 2D fibers are
expressed much more abundantly (Fig. 5G). The profile
for EDL muscle versus SOL muscle in AChRe) ⁄ ) mice
still identifies EDL muscle as fast muscle in comparison
to SOL muscle. However, the increased number of
type 1 fibers and the reduced number of type 2B ⁄ 2D
fibers clearly reflects the fast-to-slow shift in fiber composition in EDL muscle of AChRe) ⁄ ) mice.
Transcript levels in muscles from AChRe) ⁄ ) and
wild-type mice
The changing fiber type compositions led to the question of whether differences in MyHC protein profiles
in SOL and EDL muscles were reflected by changes in
the transcript levels of the corresponding MyHC genes.
In addition, we wanted to investigate whether these
‘AChR-mediated’ signals that change muscle fiber
types cause changes in the expression of synaptically
expressed genes. We therefore selected, besides the
‘myogenic’ genes, several ‘synaptogenic’ genes that
contribute directly or indirectly to synapse formation
and ⁄ or function and determined their respective
mRNA expression levels.
Comparing myogenic transcripts in SOL muscle of
AChRe) ⁄ ) and wild-type mice (Fig. 6A), we observed
increased levels of MyHC1 and MyHC2A, whereas
levels of MyHC2B and MyHC2D were decreased. We
also measured troponin I transcripts, as their fiber
type-specific expression depends on ‘slow’ and ‘fast’
innervation [16]. In accordance with a fast-to-slow
transition, an increase was observed for troponin Islow,
whereas troponin Ifast appeared to be unaffected.
Ca2+-dependent calcineurin ⁄ nuclear factor of activated
T cells (NFAT) signaling is also thought to contribute
to muscle activity-regulated fiber transformations [17].
Therefore, we determined the transcript levels of the
transcription factors NFATc1 and NFATc4, but
observed no significant changes. Synaptogenic transcript levels (Fig. 6B) were elevated for AChR a-subunits, muscle, skeletal, receptor tyrosine kinase
(MuSK) and utrophin (Utrn) transcripts, and were not
significantly different (changes ‡ 2-fold or £ 2-fold) for
AChR c-subunit, dystrophin, rapsyn, growth-associated binding protein (GABP)a, GABPb, dishevelled
(Dvl1), and sodium channel (Scn4a). In AChRe) ⁄ )
mice, AChR e-subunit transcripts were not detected
using primers recognizing sequences of exon 8 that
had been deleted in AChRe) ⁄ ) mice. AChRe-subunit
FEBS Journal 275 (2008) 2042–2054 ª 2008 The Authors Journal compilation ª 2008 FEBS
2045
AChR and muscle fiber type composition
A
Fiber type 1
T.-E. Jin et al.
Fiber type 2A
Fiber type 2B/2D
n
Total
number
*(P < 0.05), **(P < 0.001)
B
C
CSA (µm2)
Fiber number
Total fibers
Type 2A
Type 1
Type 1
Type 2A
Type 2B/2D
Type 2B/2D
20 Postnatal days (P) 60
20 Postnatal days (P)
60
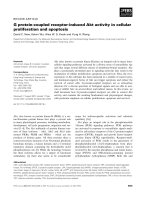
Fig. 4. Number and CSAs of muscle fibers in SOL muscle from AChRe) ⁄ ) mice during postnatal development. (A) Numbers of total fibers,
type 1, 2A and 2B ⁄ 2D fibers, and CSAs, are shown for SOL muscle from AChRe) ⁄ ) mice at P20 (18 cross-sections from three different animals) and at P60 (72 cross-sections from four different animals between 50 and 60 days old). Fiber types were determined by ATPase staining, pH 4.6. (B) Number of total fibers, type 1, 2A and 2B ⁄ 2D fibers, in SOL muscle at P20 and P60 from AChRe) ⁄ ) mice are plotted as
mean values ± SEM. Arrows illustrate increase ⁄ decrease of fiber type numbers as indicated. (C) CSAs (lm2 ± SEM) of type 1, 2A and
2B ⁄ 2D fibers in SOL muscle of AChRe) ⁄ ) mice at P20 and P60 are plotted. In each case, seven separate cross-sections were used to determine the CSA of 50–70 fibers. Arrows show that the CSA increases between P20 and P60.
transcripts, however, were identified using primers that
recognize 5¢-upstream sequences of exon 2. With these
primers, we observed that the transcriptional activities
of the e-subunit genes were similar in AChRe) ⁄ ) and
in wild-type muscle.
Comparing EDL muscle of AChRe) ⁄ ) mice and
wild-type mice (Fig. 6C), we found that expression of
myogenic gene transcripts was strongly increased for
MyHC1 and moderately increased for MyHC2A,
whereas no significant changes were observed for
MyHC2B and MyHC2D, reflecting the fast-to-slow
fiber shift. Troponin Islow was clearly increased and
troponin Ifast was also elevated in this muscle. Again,
no significant changes were seen for NFATc1 and
NFATc4
transcripts.
Synaptogenic
transcripts
(Fig. 6D) of AChR a-subunits were increased, whereas
AChR e-subunit transcripts were reduced and AChR
c-subunits were not significantly changed. Rapsyn and
Utrn also appeared to be increased. No significant
changes were observed for dystrophin, MuSK,
GABPa, GABPb, Dvl1, and Scn4a. In Fig. 6A,C,
2046
arrows indicate increased or reduced expression of
MyHC type 1, 2A and 2B ⁄ 2D fibers. A correlation
with changes in the corresponding transcripts was seen
only for MyHC1 in SOL and EDL muscle and for
MyHC2A in EDL muscle. The other transcript levels
did not match fiber type expression.
Differential expression of selected ‘myogenic’
and ‘synaptogenic’ transcripts in SOL and EDL
muscle
Comparison of transcript levels in SOL and EDL
muscle of wild-type mice and of AChRe) ⁄ ) mice could
reveal differences between slow and fast muscles and
thus indicate whether altered AChR function would
change the expression of myogenic and ⁄ or synaptogenic
transcripts. In EDL muscle of wild-type mice, MyHC1
transcripts were strongly reduced and MyHC2B transcripts were strongly increased as compared to SOL
muscle. MyHC2A and MyHC2D transcripts showed
no significant difference. Troponin Islow clearly stood
FEBS Journal 275 (2008) 2042–2054 ª 2008 The Authors Journal compilation ª 2008 FEBS
T.-E. Jin et al.
AChR and muscle fiber type composition
A
B
C
D
E
F
G
Fig. 5. Comparison of fiber type composition in muscle sections
from SOL and EDL muscle of wild-type and AChRe) ⁄ ) mice. Crosssections of (A) SOL muscle and (B) EDL muscle of wild-type mice
at P75, and (C) SOL muscle and (D) EDL muscle of AChRe) ⁄ ) mice
at P60. Cross-sections (10 lm) of three or four different animals
were subjected to ATPase staining, pH 4.6. (i) Type 1 fiber.
(a) Type 2A fiber. (b) Type 2B ⁄ 2D fiber. Scale bar in (D) is 100 lm.
(E) Fiber type composition in SOL muscle of wild-type mice (white
columns; 100 cross-sections) compared with fiber type composition
in AChRe) ⁄ ) mice (gray columns; 72 cross-sections). Columns
represent type 1, 2A and 2B ⁄ 2D fibers (% of total). (F) Fiber type
composition in EDL muscle of wild-type mice (white columns;
12 cross-sections) compared with fiber type composition in
AChRe) ⁄ ) mice (gray columns; 12 cross-sections). Columns represent type 1, 2A and 2B ⁄ 2D fibers (% of total). (G) Comparison of
fiber type composition of EDL muscle versus SOL muscle in wildtype mice (white columns) and AChRe) ⁄ ) mice (gray columns).
EDL values were normalized to SOL values (fiber type EDL ⁄ fiber
type SOL) and plotted on a logarithmic scale. The EDL ⁄ SOL profile
of AChRe) ⁄ ) mice is similar to the wild-type profile, but type 1
fibers are increased, whereas type 2B ⁄ 2D fibers are reduced.
out as a marker for fast-to-slow transition, and was
accordingly reduced in EDL muscle, whereas troponin Ifast was expressed at similar levels in SOL and
EDL muscle. The NFATc1 and NFATc4 transcripts
showed no significant difference (Fig. 7A). Comparing
transcript levels of synaptogenic genes in SOL and
EDL muscles of wild-type mice, we observed no
changes ‡ 2-fold or £ 2-fold for the AChR e-subunit,
Dvl1, Utrn, and Scn4a transcripts. Slightly reduced
transcript levels were observed for the AChR
a-subunit, rapsyn, dystrophin, GABPa and GABPb
transcripts. (Fig. 7B). AChR c-subunit and MuSK
transcripts were significantly reduced in EDL muscle.
The myogenic and synaptogenic transcript profiles
of SOL and EDL muscle in AChRe) ⁄ ) mice still
reflected muscle-specific differences between SOL and
EDL muscles. A closer look at individual transcript
levels, however, showed that MyHC1 transcripts in
EDL muscle of AChRe) ⁄ ) mice were elevated in comparison to wild-type EDL muscle (Fig. 7B), in accordance with the fast-to-slow fiber type transition in
AChRe) ⁄ ) mice (Fig. 5G). An increase was also seen
for MyHC2B transcript levels, which is explained by
the fact that MyHC2B transcripts were downregulated
in SOL muscle but upregulated in EDL muscle of
AChRe) ⁄ ) mice. Further support for a fast-to-slow
transition was the shift of troponin Islow to higher levels
in EDL muscle in AChRe) ⁄ ) mice. The synaptogenic
transcript levels displayed no significant shifts when
SOL and EDL muscles of AChRe) ⁄ ) mice and SOL
and EDL muscles of wild-type mice were compared.
As in EDL muscle of wild-type mice, the transcripts of
the AChR c-subunit as well as the MuSK gene were
reduced to similarly low levels (Fig. 7D).
Discussion
AChRe) ⁄ ) mice were employed to investigate whether
functional properties of endplate AChRs affect the
fiber type composition in muscle. In AChRe) ⁄ ) mice,
embryonic-type AChRc is not replaced by adult-type
AChRe and is expressed throughout postnatal life
[10,11]. The results show a new quality in muscle
plasticity: postnatal expression of AChR with prolonged channel open time but reduced Ca2+ permeability and ion conductance stimulates transitions
from fast to slow fiber types, both in SOL muscle
and in EDL muscle. The AChR-induced changes in
‘myogenic’ and ‘synaptogenic’ gene expression indicate that AChR-mediated postsynaptic signaling is
linked to signal pathways that regulate fiber type
composition.
MyHC isoforms in SOL muscle of wild-type and
AChRe) ⁄ ) mice during postnatal development
Adult patterns of MyHC isoforms are expressed in
a species-specific and muscle-specific manner within
3–4 weeks after birth, and fiber type transitions depend
on neuronal, mechanical and ⁄ or hormonal signals
[14,18]. In agreement with a previous report [15], we
FEBS Journal 275 (2008) 2042–2054 ª 2008 The Authors Journal compilation ª 2008 FEBS
2047
AChR and muscle fiber type composition
T.-E. Jin et al.
Table 1. The fiber number and CSAs of SOL and EDL muscles from wild-type and AChRe) ⁄ ) mice. Fiber type numbers and CSAs of muscle
fibers were determined using cross-sections (Fig. 5) of SOL and EDL muscles of wild-type (P68–P80) and AChRe) ⁄ ) (P49–P57) mice. CSAs
(mean ± SEM) of fibers were measured at middle regions of each muscle. In each case, seven separate cross-sections were used to determine the CSA of 50–70 fibers. Values with P < 0.05 were considered to be statistically significant. ATPase staining, pH 4.6. WT, wild-type.
Fiber type 1
Fiber type 2B ⁄ 2D
Fiber type 2A
n
SOL
WT
AChRe) ⁄ )
EDL
WT
AChRe) ⁄ )
Number
CSA
Number
CSA
100
72
322 ± 11
335 ± 13*
1066 ± 90
964 ± 50
476 ± 18
330 ± 12**
909 ± 73
721 ± 52
12
12
6±1
29 ± 3**
286 ± 35
268 ± 14
517 ± 24
284 ± 8**
1225 ± 94
643 ± 26**
Number
CSA
Total number
9±1
51 ± 3**
655 ± 65
568 ± 28
816 ± 30
716 ± 26*
296 ± 15
114 ± 2**
445 ± 25
337 ± 15*
819 ± 39
427 ± 11**
*P < 0.05; **P < 0.001.
observed constant expression levels of slow and fast
fibers in SOL muscle of wild-type mice (C57Bl ⁄ 6) well
after P20. The early fiber type transitions occur during
a time when AChRc channels are replaced by AChRe
channels [6], suggesting that there is a link between
AChR conversion and fiber type transition. In fact, it
has been reported that the c-to-e subunit transition is
delayed in slow-twitch muscle as compared to fasttwitch muscles [19]. The continuous fast-to-slow specification up to P60 in SOL muscle of AChRe) ⁄ ) mice
may thus be due to the lack of AChRe channels and
the persistence of AChRc channels. More experiments
are now required to clarify whether the AChRc to
AChRe channel conversion affects early postnatal
MyHC isoform transitions.
Fast-to-slow transition – correlation of muscle
fiber type and gene transcript levels in SOL and
EDL muscles from wild-type and AChRe) ⁄ ) mice
The altered functional property ⁄ density of the endplate
AChR stimulates, in SOL and EDL muscles of
AChRe) ⁄ ) mice, transitions from fast to slow fiber
types, as demonstrated by increased numbers of type 1
fibers. The increase in type 1 fibers correlates with an
increase in MyHC1 transcript level. Changes in
MyHC2A and MyHC2B ⁄ 2D transcript levels, however, and changes in protein levels do not match. Differences in transcript and protein levels have been
attributed to translational or post-translational processing events or expression of hybrid fibers in single
muscle fibers [20,21].
A reliable marker for AChR-mediated fast-to-slow
transition is troponin Islow. Troponin I is the regulatory component of the troponin complex and probably
influences the rate of force generation and relaxation
during twitch [22]. Troponin Islow and troponin Ifast
2048
levels are regulated by electrical activity in a fiber-typespecific manner [16,23,24]. Increased troponin Islow
transcripts in muscle of AChRe) ⁄ ) mice suggest that
the AChR-mediated signals that cause a fast-to-slow
MyHC transition lead to an adaption of troponin Islow. Troponin Ifast, however, is not changed in a
reciprocal manner, indicating that troponin Islow and
troponin Ifast respond independently to distinct fast
and slow signaling pathways [24].
The analyzed synaptogenic transcripts in SOL and
EDL muscles of AChRe) ⁄ ) mice are affected in a coordinated fashion, in that transcripts are moderately
elevated or not significantly altered (changes were considered significant only for values ‡ 2-fold or £ 2-fold).
A clear increase is observed for AChR a-subunit and
for MuSK (in SOL muscle) and rapsyn (in EDL muscle) transcripts. As AChR a-subunit as well as MuSK
transcripts respond to changes in muscle activity, the
increase could be a compensatory reaction to progressing AChR deficiency. On the other hand, fast-to-slow
transitions induced by electrical stimulation have led
to an increase of postsynaptic AChR [25], suggesting
that the myogenic and synaptogenic signaling pathways are linked. An exception to coordinated regulation is that the e-subunit transcripts appear to be
significantly reduced in EDL muscle.
The increased Utrn transcript levels provide further
support for a fast-to-slow transition in SOL and EDL
muscles of AChRe) ⁄ ) mice. Slow fiber type specification is sensitive to nerve activity-induced intracellular
Ca2+ [26], which regulates calcineurin ⁄ NFAT signaling
[17,27], and calcineurin ⁄ NFAT signaling regulates the
transcript levels of Utrn [28,29]. The mRNAs of the
transcription factors NFATc1 and NFATc4 are not
altered dramatically. Similarly, the transcription factors GABPa and GABPb, which have been suggested
to contribute to synapse-specific gene expression
FEBS Journal 275 (2008) 2042–2054 ª 2008 The Authors Journal compilation ª 2008 FEBS
T.-E. Jin et al.
AChR and muscle fiber type composition
A
B
C
D
Fig. 6. Gene expression of myogenic and synaptogenic genes in SOL and EDL muscles from AChRe) ⁄ ) mice in relation to wild-type mice.
Transcript expression profiles in SOL and EDL muscles were quantified by real-time PCR. The mean values (mean ± SEM) of SOL and EDL
muscles from AChRe) ⁄ ) mice were normalized to the values from wild-type SOL and EDL muscles, respectively, and are represented by
gray bars. Wild-type SOL and EDL muscle transcript levels are 1.0 (± SEM). Values were obtained by analyzing muscle from six different animals. Values with P < 0.05 were considered to be statistically significant. The specific primers for the selected genes are listed in Table 2.
(A, B) Relative expression levels of (A) myogenic and (B) synaptogenic transcripts in SOL muscle from AChRe) ⁄ ) mice are compared to transcript levels in SOL muscle from wild-type mice. (C, D) Relative expression levels of (C) myogenic and (D) synaptogenic transcripts in EDL
muscle from AChRe) ⁄ ) mice are compared to transcript levels in EDL muscle from wild-type mice. Inserts in (A) and (C) indicate changes at
the protein level for type 1, type 2A and type 2B ⁄ 2D fibers. Increase ⁄ decrease of fiber types in muscle from AChRe) ⁄ ) mice as compared
to muscle from wild-type mice is schematically indicated by arrows.
[30,31], are not significantly different between muscle
of wild-type and AChRe) ⁄ ) mice. These results, however, do not exclude functional roles of these factors in
muscle fiber development and fiber type transitions as
observed here.
Differential analysis of SOL and EDL muscles
The differential fiber type profile of SOL and EDL
muscles highlights similar muscle-specific differences
both in wild-type and in AChRe) ⁄ ) mice. The differ-
ence between EDL and SOL muscles is less pronounced
in AChRe) ⁄ ) mice, because of the fast-to-slow shift,
which causes a relative increase of type 1 fibers and a
decrease of type 2B ⁄ 2D fibers in EDL muscle. Corresponding shifts of MyHC1 transcripts in differential
SOL ⁄ EDL transcript profiles as well as the increased
troponin Islow transcript levels indicate that SOL and
EDL muscles adjust to the altered AChR-mediated signaling in a muscle-specific manner. The synaptogenic
transcripts, on the other hand, display no significant
differences between wild-type and AChRe) ⁄ ) SOL and
FEBS Journal 275 (2008) 2042–2054 ª 2008 The Authors Journal compilation ª 2008 FEBS
2049
AChR and muscle fiber type composition
T.-E. Jin et al.
Table 2. List of TaqMan assay-on-demand products and our designed primer and probe set for quantitative real-time PCR.
Assay ID
Dye
Context sequence
Symbol
Gene name
Mm99999915_g1
FAM
TGAACGGATTTGGCCGTATTGGGCG
GAPDH
Mm00431627_m1
FAM
TTCTCTATAACAACGCAGACGGCGA
AChRa
Mm00437417_m1
FAM
TGGAGAACAATGTGGACGGTGTCTT
AChRc
Mm00437411_m1
FAM
ACTGCTGGGCAGGTATCTTATATTC
AChRe
Custom designed
FAM
ATCTCACTGAACGAGAAAGAAGAAA
AChRe2
Mm00438592_m1
FAM
AGGACTTCGGGGTGGTGAAGGAGGA
Dvl1
Mm00464475_m1
Mm00448006_m1
FAM
FAM
GAGTTCAGCACAAATTTCACAGGCT
AATGCTCTCAGGGAAAATTCCAGAA
Dmd
Musk
Mm00485539_m1
FAM
CTACGCCCAGGTCAAGGACTATGAG
Rapsyn
Mm00810176_s1
Mm00600555_m1
FAM
FAM
TCTTTCTAGGAAGGCAACATTCTAG
ATTGGTGCCAAGGGCCTGAATGAGG
Utrn
MyHC1
Mm00454991_m1
FAM
CTGAGATCGACAGGAAGCCCGCAAT
MyHC2A
Mm01332531_g1
FAM
GAATGCTGAAGGACACACAGCTGCA
MyHC2B
Mm01332500_gH
FAM
ACTTATCAAACTGAGGAAGACCGCA
MyHC2D
Mm00502426_m1
Mm00437157_g1
Mm00484598_m1
Mm00487471_m1
Mm00479445_m1
FAM
FAM
FAM
FAM
FAM
GAAAAGGAGCGGCCAGTCGAGGTAG
GTCTGAAGTGCAGGAACTCTGCAAA
TGCAAGATATTCAGCTGGATCCAGA
TTCTTCAGAAACTCCAGTAGTGGCC
GCAAGCCAAATTCCCTGGTGGTTGA
TnIs
TnIf
Gabpa
Gabpb1
Nfatc1
Mm00452375_m1
FAM
GGGTCCTGATGGAAAACTGCAGTGG
Nfatc4
Mm00500103_m1
FAM
TATGGAGGAGCTGGAAGAGGCCCAT
Scn4a
Glyceraldehyde-3-phosphate
dehydrogenase
Cholinergic receptor, nicotinic,
alpha polypeptide 1 (muscle)
Cholinergic receptor, nicotinic,
gamma polypeptide
Cholinergic receptor, nicotinic,
epsilon polypeptide
Cholinergic receptor, nicotinic,
epsilon polypeptide
Dishevelled, dsh homolog 1
(Drosophila)
Dystrophin, muscular dystrophy
Muscle, skeletal, receptor
tyrosine kinase
Receptor-associated protein of
the synapse, 43 kDa
Utrophin
Myosin, heavy polypeptide 7,
cardiac muscle, beta
Myosin, heavy polypeptide 2,
skeletal muscle, adult
Myosin, heavy polypeptide 4,
skeletal muscle, adult
Myosin, heavy polypeptide 1,
skeletal muscle, adult
Troponin I, skeletal, slow 1
Troponin I, skeletal, fast 2
GA repeat binding protein, alpha
GA repeat binding protein, beta 1
Nuclear factor of activated T cells,
cytoplasmic, calcineurindependent 1
Nuclear factor of activated T cells,
cytoplasmic, calcineurindependent 4
Sodium channel, voltage-gated,
type IV, alpha polypeptide
EDL muscles. Generally, it appears that transcript levels are reduced in EDL muscle, most prominently for
AChR c-subunit and MuSK transcripts. In a previous
study of rat muscle, the majority of cytoskeletal proteins were also found to be reduced in EDL muscle as
compared to SOL muscle [32]. Comparison of fast and
slow muscle shows that MuSK, as a major synaptic
regulator [33–35], is expressed at significantly lower levels in EDL muscle than in SOL muscle, and may coordinate differentiation of the postsynaptic apparatus
differently in fast and slow muscle. Compensatory
changes in MuSK expression levels as a consequence of
altered AChR function ⁄ density are apparently similar
in SOL and EDL muscles. The overall conservation of
muscle-specific expression patterns of myogenic and
2050
Exon
NCBI Ref.
2
NM_008084
4
NM_007389
4
NM_009604
8
NM_009603
2
NM_009603
1
NM_010091
15
4
NM_007868
NM_010944
2
NM_009023
8
39
NM_011682
NM_080728
33
NM_144961
31
AJ278733
26
AJ293626
4
3
3
6
7
NM_021467
NM_009405
NM_008065
NM_010249
NM_198429
6
NM_023699
10
NM_133199
synaptogenic transcripts reveals that AChR-induced
changes affect contractile profiles of muscles in a coordinated fashion.
Muscle fiber type and AChR function
Fast-to-slow transitions are induced by enhanced neuromuscular activity, e.g. by chronic low-frequency
stimulation [1], as well as by prolonged exercise [36],
whole body exercise training [37,38] and hyperactivity
of rats [39]. The mechanisms that cause these adaptive
changes in wild-type muscle to increased muscle activity seem unlikely to compensate for progressive muscle
weakness in AChRe) ⁄ ) mice. On the other hand,
denervation, limb immobilization and unloading or
FEBS Journal 275 (2008) 2042–2054 ª 2008 The Authors Journal compilation ª 2008 FEBS
T.-E. Jin et al.
AChR and muscle fiber type composition
A
B
C
D
Fig. 7. Gene expression of myogenic and synaptogenic genes in EDL muscle in relation to SOL muscle from wild-type and AChRe) ⁄ )
mice. The transcript expression profile was quantified by real-time PCR. The mean values (mean ± SEM) of EDL muscle from wild-type
and AChRe) ⁄ ) mice were normalized to corresponding values from SOL muscle and are represented by gray bars. SOL transcript levels
are 1.0 (± SEM). The values were obtained by analyzing muscle from six different animals; values with P < 0.05 were considered to be
statistically significant. The specific primers for the selected genes are listed in Table 2. (A, B) Relative expression levels of (A) myogenic
and (B) synaptogenic transcripts in EDL muscle from wild-type mice. (C, D) Relative expression levels of (C) myogenic and (D) synaptogenic transcripts in EDL muscle from AChRe) ⁄ ) mice. The values are presented on a logarithmic scale and show the relative upregulation
or downregulation.
spinal cord transection all cause atrophy of slow and
fast extensor muscles. The characteristic feature is the
transformation of muscle fibers from slow to fast [37].
Progressive muscle weakness and atrophy are characteristic symptoms of the AChRe) ⁄ ) mice, and thus
would be expected to reduce the proportion of slow
fibers. The overall fast-to-slow transition therefore
indicates that altered functional properties of the endplate AChRs mediate signals that dominate and overrule possible denervation ⁄ atrophy-induced changes.
It is not clear how changes in neuromuscular activity
or motor activity regulate transcriptional control
mechanisms of MyHC expression. Major regulatory
signals are attributed to action potentials that are
transmitted to the fibers and change intracellular Ca2+
concentrations [40]. Embryonic and adult-type AChRs
evoke different membrane potentials, which could
affect the signal cascades regulating myofiber transformation differently. The AChR subtypes have, in addition, different Ca2+ permeabilities, and thus could
modulate the subsynaptic Ca2+ levels. The challenge
now is to determine whether and how the spatially
restricted synaptic Ca2+ signals could be transmitted
to act more globally to alter myofiber expression.
In wild-type mice, the functional change of AChRc to
AChRe may fine-tune the postnatal expression of fiber
type composition, e.g. by increasing the inherent motor
activity mediated by the higher ion conductance of
AChRe. In AChRe) ⁄ ) mice, lack of AChRe may delay
early postnatal fiber type transitions, and the persistence of AChRc reduces, rather than increases, motor
activity. At the same time, synaptic Ca2+ levels may
FEBS Journal 275 (2008) 2042–2054 ª 2008 The Authors Journal compilation ª 2008 FEBS
2051
AChR and muscle fiber type composition
T.-E. Jin et al.
be increased due to the prolonged channel open times
of AChRc. Mutated AChR with prolonged channel
open times has indeed been shown to increase synaptic
Ca2+ levels, which are thought to mediate endplate
degeneration and induction of so-called slow channel
myasthenic symptoms [41].
Another possibility may be that AChR deficiency
induces retrograde signals, which stimulate presynaptic compensatory changes. Isometric twitch and tetanic contraction forces following direct and indirect
stimulation of the muscle, however, favor postsynaptic impairment of signal transduction, and NMJs of
AChRe) ⁄ ) mice have so far displayed no significant
changes regarding functional and structural properties
of the presynaptic nerve terminal [10,11]. Thus, our
results suggest that changes of the postsynaptic
AChR induce a fast-to-slow fiber type transition in
muscle.
Experimental procedures
Animals
The generation of AChRe) ⁄ ) mice has been described previously [10]. Wild-type C57Bl ⁄ 6 mice (2–13 weeks) and
AChRe) ⁄ ) mice (2–9 weeks) mice were killed by CO2
inhalation. All animal experiments were carried out in accordance with the Guide for the Care and Use of Laboratory
Animals published by the US National Institute of Health
(NIH Publication No. 85-23, revised 1996) and the European
Community guidelines for the use of experimental animals.
Immunochemistry, histochemical staining, and
fiber counts
SOL and EDL muscles were dissected from mice and prepared in an embedding medium (Sakura, AT Zoeterwoude,
the Netherlands). The muscles were rapidly frozen in liquid
nitrogen-cooled isopentane, and placed in a cryostat at
)20 °C to cut 10 lm longitudinal sections in the mid-portion of muscles. Subsequently, they were mounted on polylysine-coated glass slides. The sections on glass slides were
washed with NaCl ⁄ Pi for 5 min, and incubated in blocking
solution (BS: 0.5% BSA, 2.5% horse serum and 0.01%
Triton X-100 in NaCl ⁄ Pi) for 30 min. Sections were then
incubated for 2 h with primary antibody in BS, and were
washed three times for 2 min each in NaCl ⁄ Pi. Sections
were incubated for 10 min in BS, secondary antibody in BS
was applied for 1 h, and sections were washed four times
for 3 min each in NaCl ⁄ Pi. Stained sections were visualized
under an Axioplan 2 uorescence microscope (Zeiss, Gotă
tingen, Germany) and imaged using a CCD camera (Intas,
Gottingen, Germany). Primary antibody MY-32 (Sigma,
ă
Deisenhofen, Germany) was used to detect type 1 fibers,
2052
and NOQ7.5.4.D (Sigma) was used to detect all type 2
fibers. Antibodies to type 1 fibers and type 2 fibers were
used at dilutions of 1 : 1000 and 1 : 200, respectively.
Secondary antibody, Alexa 488-labeled goat anti-(mouse
IgG) (Molecular Probes, Leiden, the Netherlands), was
used at a dilution of 1 : 500.
Cross-sections were stained with hematoxylin ⁄ eosin as
previously described [42]. Myofibrillar ATPase staining was
performed as previously described [43]. In brief, sections
were incubated in acidic buffer (3.5 mm barbital, 3.5 mm
sodium acetate, pH 4.54) or basic buffer (20 mm barbital,
36 mm calcium chloride, pH 10.2) for 10–15 min, and then
in ATP staining buffer (3.6 mm ATP, 20 mm barbital,
18 mm CaCl2, pH 9.4) for 2 h. Incubation in 1% CaCl2 for
10 min was followed by incubation in 2% CoCl2 for
10 min and in 2% (NH4)2S for 1 min. Sections were then
dehydrated in 50%, 70%, 80%, 95% and 100% ethanol,
and mounted on Eukitt (O. Kindler, Freiburg, Germany).
Stained sections were visualized under an Axioplan 2 fluorescence microscope and captured with a CCD camera. In
muscles, where fiber type distribution across the muscle was
uneven, muscle fiber type counting was done in whole muscle sections. The scale factor was determined by measuring
a known distance from a micrometer. Captured cross-sectional images close to the middle region of muscles were
outlined with graphire3 (Wacom, Krefeld, Germany). In
each section, 50–70 fibers were outlined and analyzed with
imagej 1.32j software ( on a PC
to determine mean CSA and SEM.
RNA isolation, reverse transcription, and
real-time PCR
RNA was isolated from frozen whole SOL and EDL
muscle tissue of wild-type (7–9 weeks old, n = 4) and
AChRe) ⁄ ) mice (8–9 weeks old, n = 3) mice as previously
described [44]. First-strand cDNA was synthesized from
5 lg of total RNA, using reverse transcriptase (Invitrogen,
Karlsruhe, Germany) and 1 lL of pd(N)6 random hexamer
(Amersham Pharmacia, Freiburg, Germany).
Real-time PCR was carried out in duplicate using
the ABI PRISM 7000 Sequence Detection System, with
TaqMan universal master mix (NoAmpErase), according to
the manufacturer’s guidelines (Applied Biosystems, Darmstadt, Germany). The PCR amplification was carried out as
follows: an initial activation step at 95 °C for 10 min, and
then two-step cycling at 95 °C for 15 s and at 60 °C for
40 s, for a total of 45 cycles. A 1 : 10 dilution of cDNA
was used in PCR experiments for gene expression profiling.
The primers and probes were purchased from Applied Biosystems (TaqMan Assays-on-Demand Gene Expression
Products) and are listed in Table 1. The probes were
labeled with a reporter fluorescent dye, 6-carboxyfluorescein, at their 5¢-ends. To avoid amplification of contaminating
genomic DNA, custom-designed primers and probes were
FEBS Journal 275 (2008) 2042–2054 ª 2008 The Authors Journal compilation ª 2008 FEBS
T.-E. Jin et al.
chosen at exon ⁄ exon borders using primer express 2.0
software (Applied Biosystems). Data analysis was performed with ABI 7000 prism 1.1 software containing the
RQ study application. CT values were collected and analyzed with automatic baseline and manual threshold
options. The analyzed CT values with the same threshold in
each gene were exported to Microsoft Excel 2002 for
expression analysis. The CT values of each gene were normalized with the CT values of the glyceraldehyde-3-phosphate dehydrogenase (GAPDH) gene. Normalized CT
values of genes in transgenic mice were compared with
those of the genes of wild-type mice. The GAPDH gene
was chosen for normalization of the RNA load under the
assumption that it is invariant in muscle from wild-type
and AChRe) ⁄ ) mice during postnatal development.
Comparison of transcript levels
The mean transcript expression values in EDL muscle from
wild-type or AChRe) ⁄ ) mice were normalized using the mean
values from SOL muscle to quantitate increased or decreased
expression levels in both muscle types (the mean values of
SOL muscle transcripts are therefore 1.0). Similarly, when
comparing muscle from AChRe) ⁄ ) and wild-type mice, the
mean values from wild-type mice were used for normalization. To calculate mean expression values, the relative quantification method (2) DDCT method) was used as previously
described [45]. Data are presented as means ± SEM. Difference in mean values was assessed by a one-tailed independent
Student’s t-test using Microsoft Excel software. Values with
P < 0.05 were considered to be statistically significant.
Acknowledgements
This work was supported by the SFB. We like to
thank Dr Christoph Peter for critical comments on the
manuscript.
AChR and muscle fiber type composition
6
7
8
9
10
11
12
13
14
15
References
1 Pette D & Staron RS (2001) Transitions of muscle fiber
phenotypic profiles. Histochem Cell Biol 115, 359–372.
2 Buller AJ, Eccles JC & Eccles RM (1960) Interactions
between motoneurones and muscles in respect of the
characteristic speeds of their responses. J Physiol 150,
417–439.
´
3 Salmons S & Vrbova G (1969) The influence of activity
on some contractile characteristics of mammalian fast
and slow muscles. J Physiol (Lond) 201, 535–549.
4 Lømo T, Westgaard RH & Dahl HA (1974) Contractile
properties of muscle: control by pattern of muscle activity in the rat. Proc R Soc Lond B 187, 99–103.
5 Deschenes MR, Tenny KA & Wilson MH (2006)
Increased and decreased activity elicits specific morpho-
16
17
18
logical adaptations of the neuromuscular junction.
Neuroscience 137, 1277–1283.
Mishina M, Takai T, Imoto K, Noda M, Takahashi T,
Numa S, Methfessel C & Sakmann B (1986) Molecular
distinction between fetal and adult forms of muscle acetylcholine receptor. Nature 321, 406–411.
Witzemann V, Barg B, Criado M, Stein E & Sakmann
B (1989) Developmental regulation of five subunit specific mRNAs encoding acetylcholine receptor subtypes
in rat muscle. FEBS Lett 242, 419–424.
Brenner HR & Sakmann B (1978) Gating properties of
acetylcholine receptor in newly formed neuromuscular
synapses. Nature 271, 366–368.
Villarroel A & Sakmann B (1996) Calcium permeability
increase of endplate channels in rat muscle during postnatal development. J Physiol 496, 331–338.
Witzemann V, Schwarz H, Koenen M, Berberich C,
Villarroel A, Wernig A, Brenner HR & Sakmann B
(1996) Acetylcholine receptor e-subunit deletion causes
muscle weakness and atrophy in juvenile and adult
mice. Proc Natl Acad Sci USA 93, 13286–13291.
Missias AC, Mudd J, Cunningham JM, Steinbach JH,
Merlie JP & Sanes JR (1997) Deficient development
and maintenance of postsynaptic specializations in
mutant mice lacking an ‘adult’ acetylcholine receptor
subunit. Development 124, 5075–5086.
Engel AG & Franzini-Armstrong C (1994) Myology,
2nd edn. McGraw-Hill Inc, New York, NY.
Weiss A, Schiaffino S & Leinwand LA (1999) Comparative sequence analysis of the complete human
sarcomeric myosin heavy chain family: implications for
functional diversity. J Mol Biol 290, 61–75.
Adams GR, McCue SA, Zeng M & Baldwin KM
(1999) Time course of myosin heavy chain transitions in
neonatal rats: importance of innervation and thyroid
state. Am J Physiol 276, R954–R961.
Allen DL & Leinwand LA (2001) Postnatal myosin
heavy chain isoform expression in normal mice and
mice null for IIb or IId myosin heavy chains. Dev Biol
229, 383–395.
Calvo S, Stauffer J, Nakayama M & Buonanno A
(1996) Transcriptional control of muscle plasticity:
differential regulation of troponin I genes by electrical
activity. Dev Genet 19, 169–181.
Chin ER, Olson EN, Richardson JA, Yang Q,
Humphries C, Shelton JM, Wu H, Zhu W, Bassel-Duby
R & Williams RS (1998) A calcineurin-dependent
transcriptional pathway controls skeletal muscle fiber
type. Genes Dev 12, 2499–2509.
d’Albis A, Chanoine C, Janmot C, Mira J-C &
Couteaux R (1990) Muscle-specific response to thyroid hormone of myosin isoform transitions during
rat postnatal development. Eur J Biochem 193, 155–
161.
FEBS Journal 275 (2008) 2042–2054 ª 2008 The Authors Journal compilation ª 2008 FEBS
2053
AChR and muscle fiber type composition
T.-E. Jin et al.
19 Missias AC, Chu GC, Klocke BJ, Sanes JR & Merlie
JP (1996) Maturation of the acetylcholine receptor in
skeletal muscle: regulation of the AChR c-to-e switch.
Dev Biol 179, 223–238.
20 Denardi C, Ausoni S, Moretti P, Gorza L, Velleca M,
Buckingham M & Schiaffino S (1993) Type-2X-myosin
heavy chain is coded by a muscle fiber type-specific and
developmentally regulated gene. J Cell Biol 123, 823–835.
21 Sartorius CA, Lu BD, Acakpo-Satchivi L, Jacobsen
RP, Byrnes WC & Leinwand LA (1998) Myosin heavy
chains IIa and IId are functionally distinct in the
mouse. J Cell Biol 141, 943–953.
22 Squire JM & Morris EP (1998) A new look at thin filament regulation in vertebrate skeletal muscle. FASEB
J 12, 761–771.
23 Calvo S, Venepally P, Cheng J & Buonanno A (1999)
Fiber-type-specific transcription of the troponin I slow
gene is regulated by multiple elements. Mol Cell Biol
19, 515–525.
24 Rana ZA, Gundersen K, Buonanno A & Vullhorst D
(2005) Imaging transcription in vivo: distinct regulatory
effects of fast and slow activity patterns on promoter
elements from vertebrate troponon I isoform genes.
J Physiol 562.3, 815–828.
25 O¢Reilly C, Pette D & Ohlendieck K (2003) Increased
expression of the nicotinic acetylcholine receptor in
stimulated muscle. Biochem Biophys Res Commun 300,
585–591.
26 Dunn SE, Simard AR, Bassel-Duby R, Williams RS &
Michel RN (2001) Nerve activity-dependent modulation
of calcineurin signaling in adult fast and slow skeletal
muscle fibers. J Biol Chem 276, 45243–45254.
27 Rusnak F & Mertz P (2000) Calcineurin: form and
function. Physiol Rev 80, 1483–1521.
28 Chakkalakal JV, Stocksley MA, Harrison MA, Angus
LM, Deschenes-Furry J, St-Pierre S, Megeney LA, Chin
ER, Michel RN & Jasmin BJ (2003) Expression of utrophin A mRNA correlates with the oxidative capacity of
skeletal muscle fiber types and is regulated by calcineurin ⁄ NFAT signaling. Proc Natl Acad Sci USA 100,
7791–7796.
29 Chakkalakal JV, Harrison MA, Carbonetto S, Chin E,
Michel RN & Jasmin BJ (2004) Stimulation of calcineurin signaling attenuates the dystrophic pathology in
mdx mice. Hum Mol Genet 13, 379–388.
30 Bessereau JL, Stratford-Perricaudet LD, Piette J, Le
Poupon C & Changeux JP (1994) In vivo and in vitro
analysis of electrical activity-dependent expression of
muscle acetylcholine receptor genes using adenovirus.
Proc Natl Acad Sci USA 91, 1304–1308.
31 Schaeffer L, Duclert N, Huchet-Dymanus M &
Changeux JP (1998) Implication of a multisubunit Etsrelated transcription factor in synaptic expression of the
nicotinic acetylcholine receptor. EMBO J 17, 3078–
3090.
2054
32 Chopard A, Pons F & Marini JF (2001) Cytoskeletal
protein contents before and after hindlimb suspension
in a fast and slow rat skeletal muscle. Am J Physiol
Regul Integr Comp Physiol 280, R323–R330.
33 Yang X, Arber S, William C, Li L, Tanabe Y, Jessell
TM, Birchmeier C & Burden SJ (2001) Patterning of
muscle acetylcholine receptor gene expression in
the absence of motor innervation. Neuron 30, 399–410.
34 Lin W, Burgess RW, Dominguez B, Pfaff SL, Sanes JR
& Lee KF (2001) Distinct roles of nerve and muscle in
postsynaptic differentiation of the neuromuscular synapse. Nature 6832, 1057–1064.
35 Hesser BA, Henschel O & Witzemann V (2006) Synapse
disassembly and formation of new synapses in postnatal
muscle upon conditional inactivation of MuSK. Mol
Cell Neurosci 31, 470–480.
36 Wernig A, Irintchev A & Weisshaupt P (1990) Muscle
injury, cross-sectional area and fibre type distribution in
mouse soleus after intermittent wheel-running. J Physiol
428, 639–652.
37 Baldwin KM & Haddad F (2001) Effects of different
activity and inactivity paradigms on myosin heavy chain
gene expression in striated muscle. J Appl Physiol 90,
345–357.
38 Demirel HA, Powers SK, Naito H, Hughes M &
Coombes JS (1999) Exercise-induced alterations in
skeletal muscle myosin heavy chain phenotype:
dose–response relationship. J Appl Physiol 86, 1002–
1008.
39 Asmussen G, Schmalbruch I, Soukup T & Pette D
(2003) Contractile properties, fiber types, and myosin
isoforms in fast and slow muscles of hyperactive Japanese waltzing mice. Exp Neurol 184, 758–766.
40 Bassel-Duby R & Olson EN (2006) Signaling pathways
in skeletal muscle remodeling. Annu Rev Biochem 75,
19–37.
41 Gomez CM, Maselli RA, Groshong J, Zayas R,
Wollmann RL, Cens T & Charnet P (2002) Active
calcium accumulation underlies severe weakness in a
panel of mice with slow-channel syndrome. J Neurosci
22, 6447–6457.
42 Sheehan DC & Hrapchak BB (1987) Theory and Practice of Histotechnology, 2nd edn. Battelle Memorial
Institute, Columbus, GA.
43 Brooke MH & Kaiser KK (1970) Three ‘myosin ATPase’
systems: the nature of their pH lability and sulfhydryl
dependence. J Histochem Cytochem 18, 670–672.
44 Chomczynski P & Sacchi N (1987) Single-step method
of RNA isolation by acid guanidinium thiocyanatephenol-chloroform extraction. Anal Biochem 162, 156–
169.
45 Livak KJ & Schmittgen TD (2001) Analysis of relative
gene expression data using real-time quantitative PCR
and the 2(-Delta Delta C(T)) method. Methods 25,
402–408.
FEBS Journal 275 (2008) 2042–2054 ª 2008 The Authors Journal compilation ª 2008 FEBS