TPM Route to World Class Performance Part 3 pptx
Bạn đang xem bản rút gọn của tài liệu. Xem và tải ngay bản đầy đủ của tài liệu tại đây (962.65 KB, 20 trang )
22
TPM-A
Route
to
World-Class
Performance
2.5
Meeting the challenge
of
change
Currency fluctuations, government policy and competitive pressure all ensure
that the way we operate in five years’ time will be different from the way we
operate today. Reacting to new technology, new products and new legislation
guarantees that every year will present a steep learning curve. Reflect on the
last five years and expect twice as much change in the next five.
In
this environment, the precise steps to deliver the chosen business strategy
will evolve as opportunities present themselves. The ability to look forward
and direct continuous improvement activities towards those opportunities is
therefore vitally important.
3
The
top-down and bottom-up
realities
of
TPM
The reality of implementing TPM concerns
two
different dimensions: top-
down strategic direction and bottom-up delivery of improvement.
A
strength
of TPM is its ability to align both dimensions under a common goal.
This chapter looks at how apparently different motives can be integrated
to the benefit of all stakeholders. This includes shareholders, licensing
authorities, environmentalists as well as employees at all levels.
3.1
Setting and quantifying the
TPM
vision
Increasing pressure to drive down costs and eliminate waste in all its forms
across the value/supply chain means the continuous improvement of our
assets
-
both physical and people-related
-
is no longer an option. This also
means that both the manufacturing and maintenance strategies, and their
delivery, must fit and reflect the company’s business drivers and strategy. It
is customers who ultimately drive our business, and we therefore need to
specify the necessary responses to satisfy and exceed these expectations by
adding quality, performance and reliability
-
in all that we do.
Our
own consultancy operation aspires to help manufacturing and process
industry to realize its full potential
in
terms of customer service, cost, quality,
safety and morale through the powerful enabling tool of TPM.
Determined world-class pacesetters will continue to use TPM as a key
enabling tool to ensure a sustainable and profitable future for
2000
and beyond.
TPM
unlocks your installed productive capacity by unlocking the potential
of your people, because Today People Matter!
The TPM loss model is a tool that predicts how costs will behave as a
result of continuous improvement. This provides a feedforward mechanism,
as opposed to ’feedback’,
to
help management identify potential gains and
direct priorities towards meeting and exceeding customer expectations.
What
is
a
loss?
Each loss category is a legitimate top-down ’model’ of a type of shopfloor
problem, i.e. opportunity.
The use of loss categorization will
be
familiar to
those
who analyse equipment
problems. For example, experience shows that for every breakdown there are
24
TPM-A
Route
to
World-Class
Pevformance
around
30
minor stops and
300
contributory factors (Figure
3.1).
Breakdowns
are the result, not the cause or symptom.
With breakdowns, the contributory factors include scattering of dust and
dirt, poor equipment condition and human error. Progressively reducing and
eliminating these provides the organizational learning necessary to achieve
zero breakdowns.
In addition to equipment losses, the loss model covers management, energy
and material
loss
categories, providing a complete picture
of
operations’
potential.
Building a loss model helps to create a top-down view of what the company
might achieve by avoiding such losses (Figure
3.2).
It also provides a basis for
objectively comparing potential return on investment for improvement options.
This is not an exact science, but it provides management with a continuous
improvement framework for making sound management decisions (Figure
2.1).
The deployment route is provided via the pillar champions (Figures
3.3
[inor
stops
ributory factors
A
Figure
3.1
The structure
of
breakdown losses
The top-down
and
bottom-up
realities
of
TPM
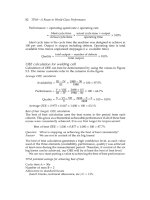
25
1
2
3
4
Impact
of
OEE
on cost per unit
(Ek)
MGT Department
50
0.06
0.05
s
Equipment
I
Transformation
Material
.C
-
0.04
0.03
u
0.02
0.01
0.00
-
Year
03
@
@
flexibility and reduce avoidable waiting time
LOG
@
Improve OEE to release one miller for new business
f?
2181
500
OEE
development (overhead reduction)
Standard shift working (contributes to
7)
to raise
f?
E68
500
OAC
lowest shift productivity to average
Standardize planned maintenance and carry out
E?
f100500
MAC
refurbishment to reduce sporadic losses by
25%
Refinehraining in core competences to improve
E?
f150000
SDI
(contributes to
2)
Figure
3.2
Loss
deployment examples
5
6
7
Location: MGT
Version:
1.0
II
April
99
Top sheet attached
mm
Scope
of
system: Department
50,
AI,
D2/3
Model potential gain:
f568
500
@
@
EEM/
@
Improve bottleneck resource scheduling to reduce
f?
f54
000
LOG
avoidable waiting time by
50%
Reduce human intervention during equipment cycle
f?
f
10
000
EEM
to improve productivity (contributes to
I)
Improve best practice and technology to halve the
f?
f4000
quality failures OAC
deployed
and
KPIs
in place
I
No.
I
Tactic description
I
Cost
I
Forecast
I
Resp.
I
Status
I
and
3.4).
They are the custodians
of
the various
TPM
tools and techniques
and through them the priorities and expectations
of
shopfloor teams are co-
ordinated.
26
TPM-A
Route
to
World-Class Performance
I
I
I
I
Pillar champion
I
development
I
plan review
I
I
I
Pilotmhase
I:
I
PilotPhase
11:
I
PilotPhase
111:
and improvement
1
initial priorities
I
implementation and
Set
out
I
Lead bottom up
Define current status
I
I
tactics and account-
I
review process
abilities
goalslpotential
Figure
3.4
Top-down loss model development and deployment
Proactive management
Experience shows that the implementation of the loss model benefits from
accurate data, the use of qualitative information, reinforced by data capture,
is a powerful development tool for management in its journey from reactive
to proactive management.
Linked to the results
of
the
TPM
audit/coaching process, each reiteration
hones management’s ability to
pull through
improvements rather than
push
down
initiatives, making it an invaluable and integral part of the
TPM
methodology.
Typical cosVbenefit profile
The cost/benefit profile in Figure
3.5
depicts the impact of introducing
TPM
into an organization and the effect this has on the
OEE
and, in turn, the
overall maintenance budget.
The initial bow wave is the effect on the budget of the initial training,
restoration/refurbishment
and the time impact. Experience shows, however,
that a
1
per cent improvement in the OEE is equivalent to between
5
per cent
and
20
per cent of the annual maintenance budget.
So
instead of simply attacking the tip of the iceberg,
TPM
flushes the
’hidden losses’ to the surface for step-by-step elimination (Figure
1.3).
The top-down and bottom-up realities
of
TPM
27
85%
OEE
60%
OEE
v
Benefit
of
attacking
6
-/
I
losses
t
Direct
cost
of
maintenanc
I
I
'0
1
Yr
2
Yr
3
Y'
Figure
3.5
Typical costbenefit profile
What can
TPM
give
my
business?
The benefits from TPM implementation are outlined under the following
three categories and are shown in the case study examples that follow.
Business benefits
0
Planning with confidence through the supply chain to provide what
customers want, when they need it, just in time, right first time.
0
Flexibility -being able to react quickly to market changes without high
levels of stock.
0
Improvement in OEE
as
a measurable route to increased profitability.
Equipment benefits
Improved process capability, reliability, product quality and productivity.
0
Economical use of equipment throughout its total service life starting
from design, called TPM for Design or Early Equipment Management.
0
Maximized efficiency of equipment.
People benefits
0
Increased utilization of hand/operational skills, teamworking and
problem-solving skills.
0
Practical and effective example of teamworking, including TPM in
Administration for the support functions.
0
Trouble-free shifts, because value-adding activities become proactive
rather than reactive.
28
TPM-A
Route to World-Class Performance
Some examples of
benefits
from
TPM
Case
A:
chemical processing plant
0
By-product output constrained by capacity
5 per cent increase in OEE to 90 per cent
Worth €400
000
in increased contribution per annum
Case
B:
manufacturing machining cell
TPM
pilot project
0
OEE increased from 40 per cent to 72 per cent over six months
Best of best OEE of 92 per cent
0
47 per cent reduction in set-up and changeover times
0
100 hours per month liberated via TPM improvements
Additional manufacturing potential worth
€48
000
per year by bringing
subcontracted off-load work in-house
Case C: automotive manufacturer
15-year-old wheel balancer
0
Average OEE before TPM
=
45 per cent
0
Cost of refurbishment
=
€8000
0
Each
1
per cent improvement of OEE
=
€694 per annum
OEE achieved after three months
=
69 per cent
0
Worth €17
000
per annum
Case
D:
polymer-based material producer
0
Production line from raw material input to bulk reels
0
Reference period OEE
=
77 per cent
Consistent achievement of best
of
best OEE
=
82 per cent
Value of achievement
=
€250
000
per annum in reduced costs
0
One-off cost of improvements
=
€1000
Case
E:
cement plant
0
Weigh feeder mechanism unreliability
0
Reference period OEE
=
71 per cent
0
Best of best OEE achievement
=
82
per cent
0
Worth €35
000
in energy savings per annum
0
Other TPM pilot improvements saved
€300
000
per
annum,
plus avoidance
of capital expenditure of €115
000
Case
F:
offshore oil platform with declining reservoir
After
two
years of using TPM principles:
October 1997 achieved longest production run without shutdown since
1994
Gas lift now at greater than 90 per cent efficiency compared to
40
per
cent in 1995 and 60 per cent in 1996
The
top-down and
bottom-up
realities
of
TPM
29
OEE
reference period
60
per cent, current levels
75
per cent
Case
G:
pharmaceutical manufacturer
0
TPM project actioned as part of a four-day facilitator training workshop
0
Additional revenue generated worth
€5
million per annum
0
One-off cost of implementation
€2000
TPM champion:
‘I
am glad we did not agree to a fee based on a percentage
of the profits generated!’
Quotable
quotes
‘TPM is making rapid inroads into our reliability problems
because of the structured approach which we have introduced.
In
the past, we have been shown the concepts, but we had to
work out how to apply them. TPM
is
a much more practical
and hands-on approach.’
Head of Continuous Improvement, European car manufacturer
‘TPM is an excellent team-building process which helps develop
the full potential
of
our people.’
Head
of
Maintenance
’Change initiated by the team through TPM is more rapidly
accepted into the workplace than when imposed by management.’
TPM Champion
’If
used effectively, TPM could be the most significant change to
affect production and maintenance since Japan’s entry into the
car market.’
Manager, Continuous Improvement
‘The main thing I’ve learnt is that TPM is not an option for
us,
it’s a must.’
Plant Manager after attending four-day TPM workshop
‘If
you haven’t
got
the time to do things right the first time, how
are you going to find the time to put them right? Eventually
TPM gives you the time to do things right the first time, every
time.‘
Offshore Maintenance Manager
’TPM is a new way of thinking, the cornerstone of which is the
involvement
of
all our employees. The end result
is
a more
efficient factory, a more challenged workforce and most
importantly a reliable, high-quality service to our customers.’
Operations Director, packaging company
’The
OEE
ratio
is
the most practical measure
I
have seen’
Senior Manager
30
TPM-A
Route
to
World-Class Performance
What does it take (cost) to deliver
TPM
benefits?
TPM
uses an integrated set of techniques as shown in the three-cycle, nine-
step schematic (Figure
3.6).
The implementation
of
this analysis is applied
stepwise within improvement zones to refine production and maintenance
best practice through practical application (Figure 3.7).
The
measurement cycle
The
condition cycle
The
problem prevention cycle
Figure
3.6
9-Step TPM improvement plan
GIVE TEAM
RECOGNITION
AT EACH LEVEL
Success
will
reflect the degree
of
maflagement commitment
Level
1A
chec
1
Introduce basic lessons
I/
1
checklist
activities
Spread out the general lessons
:klist
-
Figure
3.7
The TPM improvement zone partnership
The
top-down
and
bottom-up
realities
of
TPM
31
Within these improvement zones, operators, maintainers and first line
managers apply TPM by addressing cleanliness and workplace organization
-
eliminating dust, dirt and disarray.
This
is
a positive step-cleaning
is
inspection,
which is discovering abnormalities, which allows us to restore or refurbish,
which gives a positive result, as well as a bright workplace, and ultimately
gives our workforce back some self-esteem and pride of ownership. This is
called the
5
Ss
or
CAN
DO.
Progress through these levels should be directed by asking:
Why
don’t we know the true consequences of failure (both obvious and
hidden)?
Why
does this part of the process not work as it is meant to?
Why
can’t we improve the reliability?
0
Why
don’t we have the skills to set the optimal conditions for the process?
Why
can’t we maintain and progressively improve our technology to
maintain those optimal conditions for longer?
The answer to all these questions is usually ‘We don’t know’ because the
shopfloor workforce have not been given the time, inclination and
encouragement to find the answers. TPM gives the necessary time and
motivation to do
so.
It also makes managers accountable for finding answers
to each of those questions (i.e. pillar champions).
In
summary, TPM recognizes that to achieve a reliable and flawless operation
through continuous improvement, it is the people who make the difference.
By unlocking your full productive capacity, TPM unlocks the potential of
your workforce. You will need to invest around
5
per cent of your time to
implement TPM and support continuous improvement. Like all good
investments, this can be expected to provide a return on investment.
The nine-step TPM improvement plan is described in detail in later chapters
and is at the heart of the practical application of TPM. It is a no-nonsense, no
’rocket science’ practical application of common sense. The improvement
zone implementation process is the way that
this
common sense becomes
part of the routine. It takes time and tenacity, but the results are incredible.
Before moving into the necessary detail of the planning process and
measurement of TPM, it is worthwhile to give an overview of TPM and to
identify the key building blocks which will be explained in detail and illustrated
by case studies in later chapters.
Whilst visiting Japan on a TPM study tour in
1992,
we vividly remember
being told by the Japanese Managing Director of a recognised world class
manufacturer that
‘.
. .
in the
50s
and
60s
we had
’M
for Manufacturing. In the
70s
we had ’IM’ for Integrated Manufacturing. In the
80s
we had
’CIM’ for Computer Integrated Manufacturing’. He paused for
a moment and then added
’.
.
.For the remainder of this decade
and
2000
and beyond, my company is
going
to be pursuing
’CHIM: Computer Human Integrated Manufacturing
. . .
We have
decided to re-introduce the human being into our workplace!’
32
TPM-A Route to World-Class Performance
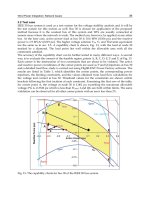
Today, some eight years later our interpretation of that powerful message
is that it certainly represents a challenge for all of
us
to develop and harness
people’s skills in parallel with advancing automation, as illustrated in Figure
3.8.
The challenge for many companies is to extend the useful life and efficiency
of their manufacturing assets whilst containing operating costs to give a
margin which will maximize value to their shareholders and, at the same
time, offer enhanced continuity and security of employment. This statement
is true whether the particular manufacturing assets are twenty years
of
age
or are just about to be commissioned.
The more forward-thinking companies are linking this challenge to new
beliefs and values which are centred on their employees through, for example:
Openness, trust and respect for all in dealing with
any individual or organization
Individuals working together with a common
sense of purpose to achieve business objectives
An environment where people are given both
the authority and the resources to make sound
decisions within established boundaries
Recognizing, valuing and developing the know-
ledge and skills of their people as a vital resource
A
willingness on everyone’s part to get involved
and take responsibility for helping to meet the
challenges of the future
0
Integrity
Teamwork
0
Empowerment
0
Knowledge
and
skills
0
Ownership
Put another way, we can win the challenge by:
working together
0
winning together
0
finishing first every time
This can be delivered by specific values, for example:
0
our people
0
working in a completely
safe
and
fit-for-purpose environment
0
where
quality
is paramount in everything we do
0
where we have a
business understanding
linked to our activities
and where
reliable equipment,
operated by
empowered
and
effective
teams,
will ensure we finish
first every
time.
TPM,
suitably tailored to the specific environment, can be a fundamental
0
We all ‘own’ the plant and equipment.
We are therefore responsible for its availability, reliability, condition
and performance within a safe and fit-for-purpose environment.
0
We will therefore ensure that our overall equipment effectiveness ranks
as the best in the world.
0
We will continuously strive to improve that world-class performance.
pillar and cornerstone to achieve the above goals, beliefs and values since:
The top-down and bottom-up realities
of
TPM
33
We will therefore train, develop, motivate, encourage and equip our
0
We will therefore create an environment where our people
want
to
The last statement is the fundamental future challenge for management if
the previous statements are to mean anything in practice.
As
the aerospace and nuclear power industries, with their relatively complex
technologies and systems, emerged in the
1970s
and
1980s,
we had to respond
with a selective and systematic approach. There developed
reliability-centred
maintenance
(RCM), which considers the machine or system function and
criticality and takes a selective approach, starting with the question: ’What
are the consequences of failure of this item for the machine or system, both
hidden and obvious?’ For example,
if
the oil warning red light indicator
comes on in your car, it is obvious that you are low on oil. The hidden
consequence, if you do not stop immediately and top up the oil, is that the
engine will seize! It is therefore good practice to check the oil level via the
dipstick at regular levels. RCM takes a systematic approach, using appropriate
run to failure, planned, preventive and condition-based strategies according
to the consequences of failure.
TPM uses a similar logic, but emphasizes the people, measurement and
problem-elimination parts of the equation and not systems alone. It emphasizes
that people
-
operators, maintainers, equipment specifiers, designers and
planners
-
must work as a team if they are to maximize the overall effectiveness
of their equipment by actively seeking creative ways and solutions for
eliminating waste due to equipment problems. That is, we must resolve
equipment-related problems once and for all, and be able to measure that
people to achieve these goals.
challenge and change ‘the way we do things here’.
Development
of
technology
and skills
Now
Advancing automation
-
Future
(
Computerhuman integrated manufacture
is
no
@
but reality!
Figure
3.8
Thefuture vision
and impact
on
TPM
34
TPM-A
Route to World-Class Performance
improvement. TPM is a practical application of total quality and empowerment
working at the sharp end of the business
-
on your machines and processes.
It is useful to note here that the main trade union in the
UK
-
the
Amalgamated Engineering and Electrical Union (AEEU)
-
proactively pursues
union/management partnership, where competitiveness is achieved
and
sustained
’.
. .
through the knowledge worker in the knowledge-driven
economy
’
Powerful stuff! And, furthermore, the AEEU sees the partnership benefits
of TPM coming through the key points highlighted below in Figure
3.9.
I
Employer
I
artnership Benefits
of
TPM
1
Increased profitability Job stability
Improved return
on
investment Able to influence business direction
Increased customer service
Responsibility
Reduced site costs
More interesting job
Enhanced local reputation
Attract group investment
Improved earnings
Improved workplace
I
Both Parties
I
Less
of
the ‘What’s in
it
for
me?’
Excellent control and understanding
of
the business
Excellent recognition and motivation
All
seeking
to
continuously improve and add value
Figure 3.9 Partnership benefits of
TPM
All sixteen bullet points are again powerful statements, but perhaps the
final one of ’all seeking to continuously improve and add value’ is the key.
Setting the vision is all very well, but we must also quantify the vision and
make sure it reflects our business drivers and business objectives. In Table
3.1
below
is
a typical illustration of clear, hard targets for which TPM is the
enabling tool.
Table
3.1
TPM-related targets
Benchmark Target Actual
1997 1998 1998
All lines
OEE
Model line
OEE
B/D
per month
Lead time days
Lost time accidents
Major set-ups
Minor stoppages per month
Reduction
in
product costs
71%
77%
387
45
1
16
hrs
4650
100
90%
90%
40
15
0
8
hrs
1000
90
88%
92.5%
33
15
0
6
hrs
813
91.5
The top-down and bottom-up realities
of
TPM
35
PERFORMANCE ENHANCEMENT THROUGH
CONTINUOUS IMPROVEMENT
performance
ManagementLevei
1
measurement
Supervisory
\
Leve
Availability
x
Production rate
x
Quality rdte
/
Figure
3.10
Top-down, bottom-up performance contract
In order to achieve the above targets, you need a ’top-down’, ‘bottom-up’
delivery process as illustrated in Figure
3.10.
We will be expanding on this performance contract approach in later
chapters. Suffice to say here that the TPM process can deliver the necessary
business drivers, provided there is a logical and coherent performance triangle
in place that reflects the organization structure which is aligned with clear
roles and responsibilities.
From the ’bottom-up’ perspective in TPM, management recognizes the
simple fact that it is the operators of plant and equipment who are in the best
position to know the condition
of
their equipment. Without their co-operation,
no effective asset care programme can be developed and implemented.
On
the contrary, they can act as the senses (eyes, ears, nose, mouth, hands)
of
their maintenance colleagues, and as a team they can work out for themselves
the best way of operating and looking after their machines, as well as resolving
chronic equipment-related problems once and for all. They can also establish
how to measure the resultant improvements.
TPM involves very little ’rocket science’; it is basically common sense. The
problem is, it is quite a rarity to be asked to put our common sense to good
use! TPM, however, does just that.
3.2
Analogies
In
order to illustrate the application of TPM principles, three everyday analogies
may prove helpful:
36
TPM-A
Route
to
World-Class Performance
0
the motor car (using the senses)
0
the healthy body (defining core competences)
the soccer team (creating the company-wide team)
Each is described below. At the end of the chapter there are two light-hearted
stories. The first one is about an overhead projector operator and his
maintenance colleague, which contains the best parts of the analogies in
order to underpin the basically straightforward, but nonetheless fundamental,
principles of TPM.
The second story relates to how a typical supervisor of the ’just do as
I
say’
mould progressively changes to a ’let’s work together to find the best way‘ style.
The
motor
car
A good analogy of using our senses, including common sense, is the way in
which we look after our motor cars as a team effort between the operator
(you, the owner and driver) and the maintainer (the garage maintenance
mechanic) (see Figure 3.11).
As the operator of your motor car you take pride of ownership of this
important asset. TPM strives to bring that sense of ownership and responsibility
to the workplace.
To
extend the motor car analogy: when you, as the operator,
take your car to the garage, the first thing the mechanic will seek
is
your view
as to what is wrong with the car (your machine). He will know that you are
best placed to act as his senses
-
ears, eyes, nose, mouth and common sense.
If
you say, ’Well, I’m not sure, but it smells of petrol and the engine is misfiring
at 60 mph’, he will probably say ’That’s useful to know, but is there anything
else you can tell me?’ ’Yes,’ you reply, ’I’ve cleaned the plugs and checked the
plug gaps.’ He won’t be surprised that you carried out these basic checks,
and certainly won’t regard them as a mechanic-only job. ‘Fine,’ he might say,
’and that didn’t cure the problem?’
’No,’
you reply,
‘so
I
adjusted the timing
mechanism!’ ’Serves you right then,’ says the mechanic, ‘and now it will cost
you time and money for me to put it right.’ In other words, in the final stage
you, the operator, went beyond your level of competence and actually hindered
the team effort. TPM is about getting a balanced team effort between operators
and maintainers -both experts in their own right, but prepared to co-operate
as
a
team.
As the operator of your car you know it makes sense to clean it
-
not
because you are neurotic about having a clean car just for the sake of it, but
rather because cleaning is inspection, which is spotting deterioration before
it becomes catastrophic. The example in Figure 3.11 shows the power of this
operator /ownership. In the routine car checks described, our senses of sight,
hearing, touch and smell are used to detect signs which may have implications
for inconvenience, safety, damage or the need for repairs or replacements. None
of
the
27
checks listed in the Figure requires
a
spanner or
a
screwdriver, but
17
of them have implications for safety. The analogy with TPM is clear: failure
of
the operator to be alert to his machine’s condition can inhibit safety and
lead to consequential damage, inconvenience, low productivity and high cost.
The top-down
and
bottom-up realities
of
TPM
37
Routine checks:
J
Tyre pressure:
J
Oil level:
Coolant level:
Battery:
extended life, safety (eyes)
not red light (eyes)
not red light (eyes)
not flat battery (eyes)
Reasons: safety, consequential damage, inconvenience, low productivity, high cost
Cleaning the car: using our eyes
Minor scratch
J
Minor dent
0
spot
of
NSt
J
J
Tyres wearing unevenly
J
Water in exhaust pipe
J
J
Worn wipers
Rubber perishing, trims
4
J
Oil leak
J
J
Suspension
One operator
to
another at traffic lights
Exhaust smoke
J
Fronthear lights
J
Stop lights
J
Indicators
J
Door
not shut
J
Soft tyre
Steering drag
Wheel bearing
Clutch wear
Brake wear
Exhaust
Engine misfire
Engine overheats
Petrol leak
(touch, eyes)
(hear)
(touch, hear)
(touch, hear)
(hear, touch)
(smell)
(smell)
(hear)
Message
No
spanner or screwdriver involved in any
of
the 27 condition checks
J
Means check has safety implications (17 of 27)
Figure
3.11
Taking care
of
yvur car
We don’t accept the status quo with our cars because ultimately this costs
us money and
is
inconvenient when problems become major. In other words,
we are highly conscious of changes in our cars’ condition and performance
using our senses. This
is
made easier
for
us by clear instruments and good
access to parts which need regular attention. We need to bring this thinking
into our workplace.
A
healthy
body
Figure
3.12
shows our second analogy, which is that healthy equipment is
like a healthy body. It is also a team effort between the operator (you) and the
maintainer (the doctor).
Looking after equipment falls into three main categories:
Cleaning
and
inspection
The daily prevention or apple a day, which prevents
accelerated deterioration or wear and highlights changes in condition.
The operator can do most, if not all,
of
these tasks where a technical
judgement is not required.
38
TPM-A
Route to World-Class Peformance
Inject before
prevention deterioration breakdown
Routine service Monitoring
Lubricate and
Clean prediction
Adjust
Inspect
Figure
3.12
Healthy equipment is like
a
healthy body
Timely
preventive
maintenance
Checks and monitoring
Measure deterioration or use the thermometer
which highlights the trends or changes in performance. The operator
can support the maintainer by acting as his ears, eyes, nose, mouth and
common sense, thus allowing the maintainer to concentrate on the critical
diagnostic tasks.
Planned, preventive maintenance and servicing
Inject before breakdown,
which prevents failure by reacting to changes in condition and
performance. The maintainer still does the majority of these tasks under
TPM on the basis that a technical skill and/or judgement is required.
Perhaps the key difference in determining the asset care regime is that
under TPM the operator and maintainer determine the routines under each
of three categories. If you ask our opinion as an operator or maintainer and
that opinion is embodied in the way we do things for the future, then we will
stick with it because it is our idea. On the other hand, if you impose these
routines from above, then we might tick a few boxes on a form, but we will
not actually do anything.
The analogy works for activities across the company. Those who do the
work are in the best position to define and refine core competences.
The
soccer
team
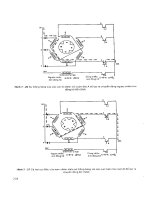
The third analogy emphasizes the absolutely critical aspect of teamwork. At
every stage in the development of the TPM process, teamwork and total co-
operation without jealousy and without suspicion are essential to success. In
Chapter
7,
we shall see how these teams are established and developed, but
Figure
3.13
gives a pictorial representation of how the teams can function to
maximum efficiency and minimum losses. Their job
is
to 'win', just as a
The top-down and bottom-up realities
of
TPM
39
soccer team on the field seeks to score and win the match. Just as the soccer
team has the backing of a support group such as the coach, the physiotherapist,
the manager and
so
on, the core TPM team also needs the proactive support
of the designers, engineers, quality control, production control, union
representatives and management.
In our soccer team the operators are the attackers or forwards, and the
maintainers are the defenders. Of course, the maintainers can
go
forward
and help the operators score a goal. Similarly, the operators can drop back in
defence and help stop goals being scored against the team. They are both
experts in their respective positions, but they are also willing to co-operate,
help each other and be versatile. One thing is for sure in the modern world-
class game: if we do not co-operate, we will certainly get relegated! The core
team will invite functional help on the shopfloor when needed, and all
concerned will give total co-operation with the single-minded objective of
maximizing equipment effectiveness. Without co-operation and trust, the
soccer team will not win. The core team on the pitch is only as good as the
support it gets from the key contacts who are on the touchline
-
not up in the
grandstand!
The TPM facilitator, or coach, is there to guide and to help the whole
process work effectively. People are central to the approach used in TPM. We
own the assets of the plant and we are therefore responsible for asset
management and care. Operators, maintainers, equipment specifiers, designers
TPM
INFRASTRUCTURE
-
supervisor
nittie
\
LM
\
Quality
&
'
-
prod control
Production
urocess technician
Figure
3.13
Teamworking
40
TPM-A
Route
to
World-Class Performance
and planners must work as a team and actively seek creative solutions which
will eliminate both waste and equipment-related quality problems once and
for all!
An often-asked question is 'How does the
5S/CAN
DO
fit within the TPM
activity?' One way of explaining it is to again use the analogy of the football
team.
As
stated above,
in
this scenario, the operators are the attackers and the
maintainers are the defenders.
However, they need a football to play with. The football is the structured
and detailed nine-step TPM methodology of measurement, condition and
problem-prevention activities, as applied to the critical machines and equipment
(Figure 3.6).
There is, however, little point in having an excellent team with a powerful
football if the pitch is in a dreadful state
-
namely the workplace and its
organization. Under the TPM umbrella, the team takes responsibility for
marking out the pitch, cutting the grass and putting up the goal nets and
corner flags. This is the
5S/CAN
DO
activity which the team is responsible
for, rather than it being delegated or subcontracted to a groundsman.
3.3
Overall equipment effectiveness versus
the
six
big
losses
The analogies above illustrate important common-sense dimensions of TPM
philosophy. These combine to provide a powerful driver to improve
OEE
by
reducing hidden losses.
In
Figure 3.14 the tip of the iceberg represents the direct costs of maintenance.
These are obvious and easy to measure because they appear on a budget and,
unfortunately, suffer from some random reductions from time to time. This is
a
little like the overweight person who looks in the mirror, says he needs to
lose weight and does
so
by cutting off his leg. It is a quick way of losing
weight, but not a sensible one! Better to slim down at the waist and under the
chin and become leaner and fitter as a result.
The indirect costs or lost opportunity costs of ineffective and inadequate
maintenance tend to be harder to measure because they are less obvious at
first sight
-
they are the hidden part of the iceberg. Yet they all work against
and negate the principles of achieving world-class levels of overall equipment
effectiveness.
In our iceberg example, the impact on profitability is in inverse proportion
to the ease
of
measurement. Quite often we find that
a
10
per cent reduction
in the direct costs of maintenance (a commendable and worthwhile objective)
is equivalent to a
1
per cent improvement in the overall effectiveness of
equipment, which comes about from attacking the losses that currently lurk
below the surface. Sometimes this is correctly referred to as the 'hidden factory'
or 'cost of non-conformity'. The tip of the iceberg is about maintenance
eficiency;
the large part below the surface is about maintenance
effectiveness.
One is no
The
top-down and bottom-up realities
of
TPM
41
Outside services
Maintenance
olhead
set-up
&
adjust
Difficult
to
measure
High
impact
on
profit
Fipre
3.14
True
cost
I$
manufacturing:
seven-eighths
hidden
good without the other. Fortunately, the measurement
of
cost/benefit and
value for money are central to the
TPM
philosophy.
In most manufacturing and process environments these indirect or lost
opportunity costs include the following, which we call the
six
big losses:
Breakdowns and unplanned plant shutdown losses
Excessive set-ups, changeovers and adjustments (because ‘we are not
organized’)
Idling and minor stoppages (not breakdowns, but requiring the attention
of the operator)
Running at reduced speed (because the equipment ’is not quite right’)
Start-up losses (due to breakdowns and minor stoppages before the
process stabilizes)
Quality defects, scrap and rework (because the equipment
‘is
not quite
right‘)
In Figure
3.15,
we show the six big losses and how they impact
on
equipment
effectiveness. The first
two
categories affect availability; the second two affect
performance rate when running; and the final two affect the quality rate
of
the product. What is certain is that all six losses act against the achievement
of
a high overall equipment effectiveness.
In
promoting the
TPM
equipment improvement activities you need to
establish the
OEE
as the measure of improvement. The
OEE
formula is simple
but
effective:
OEE
=
availability
x
performance rate
x
quality rate