ENERGY MANAGEMENT HANDBOOKS phần 7 pdf
Bạn đang xem bản rút gọn của tài liệu. Xem và tải ngay bản đầy đủ của tài liệu tại đây (5.89 MB, 93 trang )
544 ENERGY MANAGEMENT HANDBOOK
1990. The Energy Policy Act of 1992 revised and further
increased the excise tax effective January 1, 1993.
Another factor to consider in ASHRAE Guidelines
3-1990—Reducing Emission of Fully Halogenated Chlo-
rofl uorocarbon (CFC) Refrigerants in Refrigeration and
Air-Conditioning Equipment and Applications:
The purpose of this guideline is to recom-
mend practices and procedures that will reduce
inadvertent release of fully halogenated chlorofl u-
orocarbon (CFC) refrigerants during manufacture,
installation, testing, operation, maintenance, and
disposal of refrigeration and air-conditioning
equipment and systems.
The guideline is divided into 13 sections. High-
lights are as follows:
The Design Section deals with air-condition-
ing and refrigeration systems and components and
identifies possible sources of loss of refrigerants to
atmosphere. Another section outlines refrigerant re-
covery reuse and disposal. The Alternative Refrigerant
section discusses replacing R11, R12, R113, R114, R115
and azeotropic mixtures R500 and R502 with HCFCs
such as R22.
20.7 REGULATORY AND LEGISLATIVE
ISSUES IMPACTING AIR QUALITY
20.7.1 Clean Air Act Amendment
On November 15, 1990, the new Clean Air Act
(CAA) was signed by President Bush. The legisla-
tion includes a section entitled Stratospheric Ozone
Protection (Title VI). This section contains extraordi-
narily comprehensive regulations for the production
and use of CFCs, halons, carbon tetrachloride, methyl
chloroform, and HCFC and HFC substitutes. These
regulations will be phased in over the next 40 years,
and they will impact every industry that currently uses
CFCs.
The seriousness of the ozone depletion is such
that as new fi ndings are obtained, there is tremendous
political and scientifi c pressure placed on CFC end-us-
ers to phase out use of CFCs. This has resulted in the
U.S., under the signature of President Bush in February
1992, to have accelerated the phaseout of CFCs.
20.7.2 Kyoto Protocol
The United States ratified the United Nations’
Framework Convention on Climate Change, which
is also known as the Climate Change Convention, on
December, 4, 1992. The treaty is the fi rst binding inter-
national legal instrument to deal directly with climate
change. The goal is to stabilize green house gases in
the atmosphere that would prevent human impact
on global climate change, The nations that signed the
treaty come together to make decisions at meetings call
Conferences of the Parties. The 38 parties are grouped
into two groups, developed industrialized nations
(Annex I countries) and developing countries (Annex
11). The Kyoto Protocol, an international agreement
reached in Kyoto in 1997 by the third Conference of
the Parties (COP-3), aims to lower emissions from two
groups of three greenhouse gases: Carbon dioxide,
methane, and nitrous oxide and the second group of
hydrofluorocarbon (HFCs), sulfur hexafluoride and
perfl uorocarbons. Emissions are meant to be reduced
and limited to levels found in 1990 or 1995, depend-
ing upon the gases considered. The requirements will
impact future clean air amendments, particularly for
point sources. These requirements will further impact
the implementation of distributed generation sources,
which are discussed in the following section.
Table 20.1 Candidate Alternatives for CFCs in Existing Cooling Systems
———————————————————————————————————————————————————
CFC Alternative Potential Retrofi t Applications
CFC-11 HCFC-123 Water and brine chillers; process cooling
CFC-12 HFC-134a or Auto air conditioning; medium temperature commercial food
Ternary display and transportation equipment; refrigerators/freezers;
Blends dehumidifi ers; ice makers; water fountains
CFC-114 HCFC-124 Water and brine chillers
R-502 HFC-125 Low-temperature commercial food equipment
———————————————————————————————————————————————————
CODES, STANDARDS & LEGISLATION 545
20.8 REGULATORY AND LEGISLATIVE ISSUES
IMPACTING COGENERATION &
INDEPENDENT POWER PRODUCTION
2
Federal, state and local regulations must be ad-
dressed when considering any cogeneration project.
This section will provide an overview of the federal
regulations that have the most signifi cant impact on
cogeneration facilities.
20.8.1 Federal Power Act
The Federal Power Act asserts the federal
government’s policy toward competition and anti-
competitive activities in the electric power industry.
It identifi es the Federal Energy Regulatory Commis-
sion (FERC) as the agency with primary jurisdiction
to prevent undesirable anti-competitive behavior with
respect to electric power generation. Also, it provides
cogenerators and small power producers with a ju-
dicial means to overcome obstacles put in place by
electric utilities.
20.8.2 Public Utility Regulatory Policies Act (PURPA)
This legislation was part of the 1978 National
Energy Act and has had perhaps the most signifi cant
effect on the development of cogeneration and other
forms of alternative energy production in the past
decade. Certain provisions of PURPA also apply to
the exchange of electric power between utilities and
cogenerators.
PURPA provides a number of benefi ts to those
cogenerators who can become Qualifying Facilities
(QFs) under the act. Specifi cally, PURPA
• Requires utilities to purchase the power made avail-
able by cogenerators at reasonable buy-back rates.
These rates are typically based on the utilities’ cost.
• Guarantees the cogenerator or small power producer
interconnection with the electric grid and the avail-
ability of backup service from the utility.
• Dictates that supplemental power requirements of
cogenerator must be provided at a reasonable cost.
• Exempts cogenerators and small power producers
from federal and state utility regulations and associ-
ated reporting requirements of these bodies.
In order to assure a facility the benefits of
PURPA, a cogenerator must become a Qualifying
Facility. To achieve Qualifying Status, a cogenerator
must generate electricity and useful thermal energy
from a single fuel source. In addition, a cogeneration
facility must be less than 50% owned by an electric
utility or an electric utility holding company. Finally,
the plant must meet the minimum annual operating
effi ciency standard established by FERC when using
oil or natural gas as the principal fuel source. The
standard is that the useful electric power output plus
one half of the useful thermal output of the facility
must be no less than 42.5% of the total oil or natural
gas energy input. The minimum effi ciency standard
increases to 45% if the useful thermal energy is less
than 15% of the total energy output of the plant.
20.8.3 Natural Gas Policy Act (NGPA)
The major objective of this legislation was to
create a deregulated national market for natural gas.
It provides for incremental pricing of higher cost
natural gas supplies to industrial customers who use
gas, and it allows the cost of natural gas to fl uctuate
with the cost of fuel oil. Cogenerators classifi ed as
Qualifying Facilities under PURPA are exempt from
the incremental pricing schedule established for in-
dustrial customers.
20.8.4 Resource Conservation and
Recovery Act of 1976 (RCRA)
This act requires that disposal of non-hazardous
solid waste be handled in a sanitary landfi ll instead
of an open dump. It affects only cogenerators with
biomass and coal-fired plants. This legislation has
had little, if any, impact on oil and natural gas co-
generation projects.
20.8.5 Public Utility Holding Company Act of 1935
The Public Utility Holding Company Act of
1935 (the 35 Act) authorizes the Securities and Ex-
change Commission (SEC) to regulate certain utility
“holding companies” and their subsidiaries in a wide
range of corporate transactions.
The Energy Policy Act of 1992 creates a new
class of wholesale-only electric generators—“ exempt
wholesale generators” (EWGs)—which are exempt
from the Public Utility Holding Company Act (PUH-
CA). The Act dramatically enhances competition in
U.S. wholesale electric generation markets, including
broader participation by subsidiaries of electric utili-
ties and holding companies. It also opens up foreign
markets by exempting companies from PUHCA with
respect to retail sales as well as wholesale sales.
2
Source: Georgia Cogeneration Handbook, published by the Governor’s
Offi ce of Energy Resources.
546 ENERGY MANAGEMENT HANDBOOK
20.8.6 Moving towards a deregulated
electric power marketplace
EPACT-1992 set into motion a widespread
movement for utilities to become more competitive.
Retail wheeling proposals were set into motion in
states such as California, Wisconsin, Michigan, New
Mexico, Illinois and New Jersey. There are many is-
sues involved in a deregulated power marketplace
and public service commission rulings and litigation
will certainly play a major role in the power market-
place of the future. Deregulation has already brought
about several important developments:
• Utilities will need to become more competitive.
Downsizing and minimization of costs including
elimination of rebates are the current trend. This
translates into lower costs for consumers. For
example Southern California Edison announced
that the system average price will be reduced
from 10.7 cents/kWh to lower than 10 cents by
the year 2000. This would be a 25% reduction
after adjusting for infl ation.
• Utilities will merge to gain a bigger market
share. For example, Wisconsin Electric Power
Company merged with Northern States Power;
this merger of two utilities resulted in a savings
of $2 billion over 10 years.
• Utilities are forming new companies to broaden
their services. Energy service companies, fi nancial
loan programs and purchasing of related compa-
nies are all part of the new utility strategy.
• In 1995 one hundred power marketing compa-
nies have submitted applicants to FERC. Power
marketing companies will play a key role in
brokering power between end users and utili-
ties in different states and in purchasing of new
power generation facilities.
• Utilities will need to restructure to take ad-
vantage of deregulation. Generation Companies
may be split away from other operating divi-
sions such as transmission and distribution.
Vertical disintegration will be part of the new
utility structure.
• Utilities will weigh the cost of repowering and
upgrading existing plants against purchasing
power from a third party.
Chapter 24 discusses many more issues on the
topic of electrical deregulation.
20.9 OPPORTUNITIES IN THE SPOT MARKET
3
Basics of the Spot Market
A whole new method of contracting has emerged
in the natural gas industry through the spot market.
The market has developed because the Natural Gas
Policy Act of 1978 (NGPA) guaranteed some rights
for end-users and marketers in the purchasing and
transporting of natural gas. It also put natural gas
supplies into a more competitive position with de-
regulation of several categories.
The Federal Energy Regulatory Commission
(FERC) provided additional rulings that facilitated
the growth of the spot market. These rulings in-
cluded provisions for the Special Marketing Programs
in 1983 (Order 2346) and Order 436 in 1985, which
encouraged the natural gas pipelines to transport gas
for end-users through blanket certifi cates.
The change in the structure of markets in the
natural gas industry has been immense in terms of
both volumes and the participants in the market. By
year-end 1986, almost 40% of the interstate gas sup-
ply was being transported on a carriage basis. Not
only were end-users participating in contract car-
riage, but local distribution companies (LDCs) were
accounting for about one half of the spot volumes on
interstate pipelines.
The “spot market” or “direct purchase” market
refers to the purchase of gas supplies directly from the
producer by a marketer, end-user or LDC. (The term
“spot gas” is often used synonymously with “best ef-
forts gas,” “interruptible gas,” “direct purchase gas”
and “self-help gas.”) This type of arrangement cannot
be called new because the pipelines have always sold
some supplies directly to end-users.
The new market differs from the past arrange-
ments in terms of the frequency in contracting and
the volumes involved in such contracts. Another
characteristic of the spot market is that contracts
are short-term, usually only 30 days, and on an
interruptible basis. The interruptible nature of spot
market supplies is an important key to understand-
ing the operation of the spot market and the costs
of dealing in it. On both the production and trans-
portation sides, all activities in transportation or
purchasing supplies are on a “best efforts” basis.
This means that when a cold snap comes the direct
purchaser may not get delivery on his contracts
because of producer shutdowns, pipeline capacity
and operational problems or a combination of these
problems. The “best efforts” approach to dealing
can also lead to problems in transporting supplies
CODES, STANDARDS & LEGISLATION 547
when demand is high and capacity limited.
FERC’s Order No. 436
The impetus for interstate pipeline carriage came
with FERC’s Order No. 436, later slightly changed
and renumbered No. 500, which provided more fl ex-
ibility in pricing and transporting natural gas. In
passing the 1986 ruling, FERC was attempting to get
out of the day-to-day operations of the market and
into more generic rule making. More significantly,
FERC was trying to get interstate pipelines out of the
merchant business into the transportation business—a
step requiring a major restructuring of contracting in
the gas industry.
FERC has expressed an intent to create a more
competitive market so that prices would signal ad-
justments in the markets. The belief is that direct
sales ties between producers and end-users will
facilitate market adjustments without regulatory
requirements clouding the market. As more gas is
deregulated, FERC reasoned that natural gas prices
will respond to the demand: Lower prices would
assist in clearing excess supplies; then as markets
tightened, prices would rise drawing further invest-
ment into supply development.
FERC Order No. 636
Order 636 required signifi cant “Restructuring”
in interstate pipeline services, starting in the fall of
1993. The original Order 636:
• Separates (unbundles) pipeline gas sales from trans-
portation
• Provides open access to pipeline storage
• Allows for “no notice” transportation service
• Requires access to upstream pipeline capacity
• Uses bulletin boards to disseminate information
• Provides for a “capacity release” program to tem-
porarily sell fi rm transportation capacity
• Pregrants a pipeline the right to abandon gas sales
• Bases rates on straight fi xed variable (SFV) design
• Passes through 100% of transition costs in fi xed
monthly charges to fi rm transport customers
FERC Order No. 636A
Order 636A makes several relatively minor
changes in the original order and provides a great
deal of written defense of the original order’s terms.
The key changes are:
• Concessions on transport and sales rates for a
pipeline’s traditional “small sales” customers (like
municipalities).
• The option to “release” (sell) fi rm capacity for less
than one month—without posting it on a bulletin board
system or bidding.
• Greater fl exibility in designing special transporta-
tion rates (i.e., off-peak service) while still requiring
overall adherence to the straight fi xed variable rate
design.
• Recovery of 10% of the transition costs from the
interruptible transportation customers (Part 284).
Court action is still likely on the Order. Fur-
ther, each pipeline will submit its own unique tariff
to comply with the Order. As a result, additional
changes and variations are likely to occur.
20.10 THE CLIMATIC CHANGE ACTION PLAN
The Climatic Change Action Plan was established
April 21, 1993 and includes the following:
• Returns U.S. greenhouse gas emissions to 1990
levels by the year 2000 with cost effective do-
mestic actions.
• Includes measures to reduce all significant
greenhouse gases, carbon dioxide, methane,
nitrous oxide, hydrofluorocarbons and other
gases.
20.11 SUMMARY
The dynamic process of revisions to existing
codes plus the introduction of new legislation will
impact the energy industry and bring a dramatic
change. Energy conservation and creating new power
generation supply options will be required to meet
the energy demands of the twenty-fi rst century.
This page intentionally left blank
CHAPTER 21
NATURAL GAS PURCHASING
549
CAROL FREEDENTHAL
JOFREEnergy Consulting
Houston, Texas
21.1 PREFACE
This is the second full revision for this chapter,
Natural Gas Purchasing. Chapter 21 was originally writ-
ten when the book was published in 1993. Rewrite for
the fi rst revision was a completely new effort done in
1996. As of 2000, the industry has continued to change
and is still in the conversion from a federally regulated,
price-controlled business to an economically dynamic,
open industry, and this is a completely revised writing.
Changes are continuing to shape the industry differently,
especially when coupled with the changes coming from
the potential decontrol of the electric power industry.
To make even more changes, the impact of ECommerce
business-to-business is beginning to play a role in this
industry. When this revision was started, only one com-
pany offered the web for gas marketing. As of 2000, fi ve
additional companies had launched ECommerce busi-
ness-to-business natural gas trading.
The old natural gas business is really a new busi-
ness. Its structure goes back 150 years but it is more like
a new industry. It has the typical growth and turmoil of
a new business. Energy products, especially natural gas
and electricity, are new businesses as the country goes
into the new millennium. Newly “reformed” companies,
new marketing organizations, new systems affecting gas
marketing, and even, a new industry structure makes it
necessary to start from scratch in writing the revision for
this chapter.
Like the new millennium, the natural gas industry
and equally as important, the total energy business is
going through its own transition. Change will continue
as companies and businesses try different strategies.
ECommerce will play a major role in the industry’s
transition. This phase of the transition is amorphous and
makes it diffi cult to predict the exact course of events
for the future. Things that appeared far-out years ago
are becoming closer to reality. The newest buzzwords,
“distributive electricity” includes the use of fuel cells and
small dual cycle turbine driven generators by residential
and small commercial users. Both of these are becoming
economically feasible. The impact on the gas and electric
industries is unknown. This is a time of change for the
new energy business. Marketing and supplying energy
products like natural gas and electricity will go through
many changes before optimum conditions are found.
A few things are for sure. Natural gas is becoming
the major fuel for stationary power uses in the United
States. Long dominated by oil products for this use, now
gas is becoming the leader. Coal continues as a major
fuel source for electric generation. Consumption of coal
for power generation has reached record levels in recent
years but environmental concerns and the required high
capital for new coal burning generating plants will reduce
coal’s market share. The public’s dislike of nuclear power
and the high costs to build plants with the safety desired
means no growth for this industry. A new philosophy
will have to be developed by society recognizing safety
and environmental benefi ts of atomic power before new
nuclear facilities will be built.
The natural gas industry, just like the power indus-
try, which is going through its own decontrol activities,
change will be a way of life always. Companies in the
energy fi eld and in associated areas such as communi-
cations, fi nancial, systems, etc. will continue to merge,
acquire, spin off, and change their structure and goals.
As the country goes into the new millennium, these are
industries in transition and will change along with the
growth industries in cyberspace. A big difference from
the old, staid and conservative electric and gas utilities
of the prior century! Change and growth are the way.
Regardless of this, one factor continues to domi-
nate. The profi t motive is still the driving force of the
industry today. It will not change but will continue
into the future. Economics will govern change and
be the basis for decision making. All the transforma-
tions—buying and selling of companies, new marketing
companies, new systems for handling the merged assets,
etc. will all be subject to one metric; is it profi table? Al-
ready, some acquisitions made by large electric and gas
companies to bring together various parts of the energy
industry have come apart because the fi nal economics
did not pass muster.
The purpose of this chapter is to give the fuel buyer,
for any operations or industry, the knowledge and infor-
550 ENERGY MANAGEMENT HANDBOOK
mation needed to buy natural gas for fuel. The buyer may
be in a large petrochemical plant where natural gas is a
major raw material or may be the commercial user hav-
ing hundreds of apartments needing gas for heat and hot
water or plant operator where the gas is used for process
steam. It might be a fi rst time experience or an on-going
job for the buyer. This chapter will give the background
and information to fi nd natural gas supplies for any need
at the lowest cost and highest service and security. The
chapter will include information on history of the indus-
try, sources of supply, transportation, distribution, stor-
age, contracts, regulatory, and fi nancial considerations
needed to buy natural gas.
21.2 INTRODUCTION
Natural gas is predominately the compound “meth-
ane,” CH
4
. It has the chemical structure of one carbon
atom and four hydrogen atoms. It is the simplest of the
carbon based chemicals and has been a fuel for industry,
for illumination, and for heating and some cooling of
homes, offi ces, schools, and factories. Natural gas is also,
a major fuel for generating electricity. In addition to fuel
uses, gas is a major feedstock for the chemical industry
in making such products and their derivatives as am-
monia and methanol. Natural gas is used in refi ning and
chemical plants as a source for hydrogen needed by these
processing businesses. Through the reforming process,
hydrogen is stripped from the methane leaving carbon
dioxide, which has its usefulness in chemical manufac-
turing or use, by itself in cooling, carbonated drinks, or
crude oil recovery.
The term “natural gas industry” includes the peo-
ple, equipment, and systems starting in the fi elds where
the wells are located and the natural gas is produced. It
includes other fi eld tasks as gathering, treating, and pro-
cessing. Transportation to storage or to interstate or in-
trastate pipelines for further transportation to the market
area storage, or to the distribution system for delivery to
the consumer and the burner tip, are part of the system.
The burner tip might be in a boiler, hot water heater, com-
bustion engine, or a chemical reactor to name a few of the
many uses for natural gas.
Natural gas is produced in the fi eld by drilling into
the earth’s crust anywhere from a couple of thousand
feet to fi ve miles in depth. Once the gas is found and the
well completed to bring the gas to the earth’s surface, it is
treated if necessary to remove acid impurities and again,
if necessary, processed to take out liquid hydrocarbons of
longer carbon chains than methane, which has a single
carbon atom. After processing, the gas is transported in
pipelines to consuming areas where distribution compa-
nies handle the delivery to the specifi c consumer.
In addition to the people and companies directly
involved in the production, transportation, storage, and
marketing of natural gas, there are countless other busi-
nesses and people involved in assisting the gas industry
to complete its tasks. There are systems companies, regu-
latory and legal professionals, fi nancial houses, banks,
and a host of other businesses assisting the natural gas
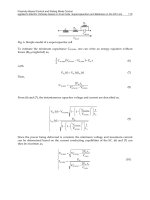
industry. Figure 21.1 shows the many parts of the indus-
try as it is known today. The money fl owing through the
major sections of the industry are shown in Figure 21.2.
The $85 billion industry shown in the diagram only repre-
sents the functions in getting natural gas, the commodity,
to market and consumption. Not included in the overall
industrial revenues are the moneys generated by the sales
and resale of gas before its consumption, the processing
and marketing of natural gas liquids coming from the
gas, and the fi nancial markets where gas futures and
other fi nancial instruments are sold and traded. These are
big businesses also. Estimates are that the physical gas
is traded three to four times before consumption. In the
fi nancial markets, gas volumes 10 to 12 times the amount
of gas consumed on an average day are traded daily.
Figure 21.3 should be of most interest to the natural
gas buyer as it depicts the various sales points, stages,
and handling the gas goes through in getting from the
wellhead to the burner tip—from the wellhead to the
consumer. As one can see in the diagram, there are many
alternate paths the gas can travel before coming to its
end use as a fuel or feedstock for chemical manufactur-
ing. Each one of the stages on the fl owsheet represents
an added value point in the travel to consumption. Raw
gas coming from the wellhead many times has suffi cient
quality to go directly into a transporting pipeline for de-
livery to the consuming area. Sometimes the gas needs
fi eld treating and/or processing to meet pipeline specifi -
cations for acceptance into the pipeline.
The gas industry is the oldest utility except for
water and sanitation. In the middle of the 19th century,
many large cities used a synthetic gas made from pass-
ing steam over coal to light downtown areas and provide
central heating systems. Big cities like Baltimore, New
York, Boston, and many more cities and municipalities
used gas for illumination. Many utilities from that period
exist today and are still gas and electric suppliers to the
areas they serve.
In the early days of the gas business, there was no
natural gas, as known today. Instead, these utilities pro-
duced a synthetic gas for both the illumination and the
central heating systems. The synthetic gas, sometimes
called “water gas” because of the method of producing it,
NATURAL GAS PURCHASING 551
Figure 21.2 Gas Industry Money Flow for Business Activities.
Figure 21.1 Natural Gas Industry Flowsheet.
552 ENERGY MANAGEMENT HANDBOOK
had bad attributes—it contained a high content of hydro-
gen and carbon monoxide, two bad actors for a gas used
in homes, businesses, and factories. People died when
exposed to it because of the carbon monoxide, and build-
ings blew-up because of the hydrogen when free gas from
leaks or pipe ruptures was ignited. When natural gas
came on the scene in the early 1900s, where it was avail-
able, it quickly replaced the old manufactured gas. About
the same time, advances were made in electricity so that
cities and municipalities changed to electricity for light-
ing and illumination. Natural gas quickly lost its market
for municipal lighting.
Natural gas was originally an unwanted by-product
from the oil fi elds. Problem was getting rid of it. Flaring
was used, but this was a waste of good natural resources.
Around the beginning of the century, associated gas from
Ohio oil fi elds was shipped to Cleveland in wooden pipes
to replace the then used synthetic gas. In the early days of
the industry, the limitations to greater uses of natural gas
were that gas was produced in only certain parts of the
country and transportation was available for only very
short distances. Market penetration was thwarted by the
ability to ship it. There were no long distance pipelines in
the early days of the industry. Natural gas made a great
replacement for the synthetic counterpart—methane is
essentially safe as far as toxicity and is much safer as
far as explosion. Gas’ growth was dependent on build-
ing long distance pipelines. Not until the 1930s did the
industry have the capability of making strong enough,
large steel piping needed for the long-distance pipelines.
Completion of major interstate pipelines to carry gas from
producing regions to consumers was the highlight of the
1930s to the start of World War II in the early 1940s.
Pipeline construction came to a halt and was dor-
mant until the war’s end. Construction went full force
after the war to insure delivering the most economical
and easiest fuel to America’s homes, commercial facilities
and industrial players. Even today with the start of the
new millennium, some areas of the U.S. still do not have
a fully developed natural gas distribution and delivery
system. Areas in the West where population is sparse,
parts of the Northeast where oil prices were too competi-
tive to delivered gas prices, and other parts of the country
lacking distribution systems for the same reasons are still
without natural gas. Many of these use what is called
“bottled gas,” a mixture of propane and butane or pro-
pane only for home heating and other critical uses. Just
recently, new supplies and pipelines were developed to
bring natural gas to the Northeast U.S. from Canada. Ad-
ditional distribution systems will bring more gas to more
customers through the country from the tip of Florida to
the North Central and West Northern states.
Ever since natural gas became available for fuel, it
was under some form of government economic control.
Through the tariff mechanism for pricing natural gas,
the government had the power to make gas prices more
or less attractive to competing fuels. Further, with the
government controlling wellhead prices and slow to
make changes in prices as conditions changed, it became
diffi cult and economically undesirable to expand natural
gas production. Government price controls hampered the
growth of the U.S. natural gas business. The gas shortages
of the mid-1970s are an example of government control
stifl ing expansion and growth. There was no shortage of
gas reserves, only a shortage of incentives for producers
to develop and supply the gas. The free market builds its
own controls to foster competition and growth.
Congress passed the Natural Gas Policy Act of 1978
to change the policy of government economic control. A
few years of transition were needed before signifi cant
changes began in the industry. Real impact started in
1985. Even today, the industry is still in transition. The
federal decontrol changed interstate marketing and
movement of natural gas. Gas at the local levels where
the state Public Utility Commission or similar local gov-
ernment has control, is still heavily regulated. Decontrol
at the federal level is slowly fi ltering down to local agen-
cies. As of 2002, some states began moving to “open
transportation” rules. A current obstacle to the swifter
implementation of rules at the state and local levels is the
tie of gas and electricity as utilities within state regulatory
control. With the electric industry going through its own
“decontrol,” many wanted to see the much larger electric
industry work out the utility problems. Then gas could
follow with less negotiating and discussion. The electric
timetable is now years behind its planned evolution and
this has slowed gas local control further.
Figure 21.3 Wellhead to Consumer Flowsheet
NATURAL GAS PURCHASING 553
With the price of gas changing each year, the total
industry value changes. The industry in nominal an-
nual terms is roughly a $100 Billion business. Electricity
is around $230 Billion. Many electric companies that were
both gas and electricity utilities even before deregulation,
have bought major natural gas pipelines or gas distribu-
tors. Large electric companies bought into the natural gas
industry whether they purchased transporters, distribu-
tors, or marketing companies. Interestingly, in a relatively
few years, some of these combinations have come apart
because of poor profi tability.
Electric and gas utility companies have gone after
transportation and marketing companies. Surprisingly,
none of the expanding companies have sought to buy, at
the beginning of the gas business, the oil and gas explora-
tion and production companies (E&P companies). These
are the companies looking for natural gas and then pro-
ducing it. While all of the transporting companies, whether
long distance or distribution in nature and, further, wheth-
er electric and/or natural gas in business, have shied away
from the production companies, other E&P companies
have merged or acquired smaller operations to add to the
total capability of the company. The signifi cant changes
during the 1990's saw major E&P companies acquire even
major and independent E&P assets.
21.3 NATURAL GAS AS A FUEL
Why has natural gas grown in popularity? What
makes it a fuel of choice in so many industries as the new
millennium begins? What shortcomings does it have?
Figure 21.4 shows the change in basic fuels mix used in
the U.S. in 1985 and 1999. Nuclear, which started in 1960,
enjoyed a period of rapid growth. The high costs for all the
safety engineered into the plants had made it an uneco-
nomical system towards the end of the century. There are
no nuclear plants scheduled for construction. Even some
of those completed and running and some with the initial
construction still in progress were shut down or converted
into natural gas fi red units. The only change that will be
seen in nuclear generation of electricity is plant effi ciencies
will be improved for the units continuing to operate.
Coal usage in the U.S. has grown in recent years
with record coal production in the late 1990s. Coal is
by far the major fuel used for electric generation, com-
manding a 56% market share. It has many negative
properties like the need for railroads for transportation,
high pollution from the burner after-products, and poor
handling characteristics including being dirty, losses on
storage, and the diffi culties of moving a solid material,
including the disposal of the remaining ash. Still, coal
has a number of things going for it which will keep coal
in use for many years to come. The ready availability
and abundance are major merits. The stability of coal
prices will always give coal a place in the market. Figure
21.5 shows the comparison in prices among coal, natural
gas, and oil products for the period 1985 through 1999.
Coal at about a dollar per million British units (MMBtu)
is not only much cheaper per unit of energy, but also has
the advantages of availability and abundance. Coal will
slowly lose position because of its disadvantages of pol-
lution and higher costs to meet changing standards and
high capital costs for building new generating plants.
Petroleum products have lost market share in the
later years because of their costs and the dependence
of the U.S. on foreign suppliers for crude and crude
oil products. Oil products used for electric generation
include distillate fuel oil, a relatively lightweight oil,
which during the refi ning process can have most of the
sulfur removed during that process. Low sulfur fuels
are desirable to keep emissions low for environmental
reasons. The other major oil product used is residual
fuel oil, the bottom of the barrel from the refi ning pro-
cess. This is a heavy, hard to transport fuel with many
undesirable ingredients that become environmental
problems after combustion. Many states have put costly
tariffs on using residual fuel oil because of its environ-
mental harm when used.
Figure 21.4 U.S. Basic Fuels 1985 & 1999 (Quadrillion Btu)
554 ENERGY MANAGEMENT HANDBOOK
Natural gas is the nation’s second largest source of
fuel and a major source of feedstock for chemical pro-
duction. Plentiful supplies at economically satisfactory
prices, a well developed delivery system of pipelines
to bring gas from the wellhead to the consumer, and its
environmental attractiveness has made natural gas the
choice of fuel for many applications. Going into the new
millennium, natural gas will be a popular fuel. As a fuel
for industry for heating and generating electricity and as
a feedstock for chemicals, natural gas is very attractive.
For residential and commercial applications, the security
of supply and effi ciency in supplying makes it an ideal
fuel. Even though natural gas is a fossil fuel, it has the
lowest ratio of combustion-produced carbon dioxide to
energy released. Carbon dioxide is the biggest culprit in
the concern for global warming.
Natural gas consumption data are followed in four
major areas by the Federal Energy Information Agency in
addition to its listing the data for natural gas used in the
fi elds for lease and plant fuel and as fuel for natural gas
pipelines; residential, commercial, industrial, and electric
generation. Natural gas demand has always, in modern
times led the amount of gas produced except for the mid-
1970s when the country experienced a severe natural gas
supply shortage. In those years, while there were more
than suffi cient reserves in the ground to meet demand,
the control of gas pricing by the federal government
stymied the initiative of producers to meet demand. Po-
tential supply was available but the lack of profi t incen-
tive prevented meeting demand in those years. Demand
increased because of changes and shortages in crude
oil supplies. Early 1970s were the start of the change in
crude pricing and the country was faced with decreased
supplies from foreign producers. Crude prices doubled
almost overnight, but because natural gas was price con-
trolled and could not meet the rising prices, supplies in
the interstate market suffered.
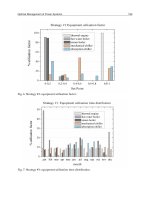
The major market for natural gas is the industrial
sector. Residential is next and commercial and electric
generating take about the same amount. Figure 21.6
graphically depicts the share each market took for 1999.
The residential market is basically for home heating and
hot water fuel. The commercial market is for space heat-
ing. Use of natural gas in industrial plants when used for
space heating is included in this category. The industrial
category covers all other uses of natural gas in industry
and includes gas used by industrial locations for power
generation until earlier 2000. All power generation is
now included in the category of electric generation. The
major demand factor in all categories is weather. Resi-
dential and commercial consumption are most affected
by weather since these two categories refl ect space heat-
ing. Electric generation is weather sensitive also since the
summer electric load is responsive to the air conditioning
load needed for the hot weather. Even though the indus-
trial load is not as sensitive to weather as are other cat-
egories, it does refl ect the additional heating load needed
for the process industries when temperatures fall and raw
materials including process air and/or water are much
colder.
Natural gas has tremendous potential to gain even
greater use in the generation of electricity in several ways.
First, it could be the choice fuel to replace aging nuclear
plants that will not be re-certifi ed as they age. Further
Figure 21.5 Fuel Prices for Generating Electricity 1995-1999
NATURAL GAS PURCHASING 555
as coal plants age and need replacement or need to be
replaced because of environmental causes, natural gas is
the ideal fuel. It is easier to get to the plant and handle in
the plant, the environmental needs are much smaller, and
the capital required for the generating plant and facilities
is much lower. Natural gas is the fuel of choice among the
fuels currently available.
Even if the electric systems in effect now were to
change to more “distributive” in nature, such as fuel cells
or small, dual cycle gas turbines, natural gas would be the
ideal fuel. Some planners see fuel cells or turbines being
used by residential units so that each household could
have its own source of electricity. When houses needed
additional power, they would draw it from the utility
lines. When the fuel cell produces more than needed, the
utility would take the excess. Most fuel cell work today
involves hydrogen and oxygen as the combined fuels for
operation. Natural gas could be the source of hydrogen.
Since many homes already have natural gas piped to the
house, it would be easy to handle this new fuel to make
electric power locally. In addition, distributive power
generation could use small, gas turbines for power sup-
ply. Commercial users would be possible users of these
systems also.
21.3.1 Supply
Natural gas is a product coming from the earth. As
discussed previously, the major component of natural
gas is the chemical compound methane, CH4. Methane
is the product formed when organic matter like trees
and foliage decays without suffi cient oxygen available to
completely transform the carbon in these materials to car-
bon dioxide. Theory is natural gas deep in the ground is a
product of decaying material from past millions of years
of the earth’s history. Chemical elements available as the
matter decayed gives the methane such contaminants as
hydrogen sulfi de, carbon dioxide, nitrogen, and many
more compounds and elements. Natural gas comes from
shallow depths as little as a few thousand feet into the
earth and as deep as 20 to 25 thousand feet. Natural gas
wells are drilled on dry land and on water covered land.
Current drilling in the Gulf of Mexico deep waters is in
water depths up to around 3,000 feet.
Natural gas quantities are measured in two sets of
units. The volume of the gas at standard conditions is one
measure. Basically, at standard conditions of temperature
and pressure, the amount of natural gas in a volume of a
cubic foot is a standard measure. Since a cubic foot is a
relatively small volume when talking of natural gas, the
usual term is a thousand cubic feet (Mcf). Still as a volume
measurement, the next largest unit would be a million
cubic feet (MMcf) which is a thousand, thousand cubic
feet. A billion cubic feet is expressed as Bcf and a trillion
is Tcf.
Since natural gas is not a pure compound but a mix-
ture of many products formed from the decaying organic
matter, the energy content of each cubic foot at standard
conditions is another method of measuring natural gas
quantities. The energy units used in the U.S. are British
thermal units (Btu), the amount of heat needed to raise a
pound of water one degree Fahrenheit at standard condi-
tions of pressure and at 60 degrees Fahrenheit. A typical
cubic foot of gas, if of pure methane, would have about
1000 Btu per cubic foot (Btu/cf). Gas coming from wells
can range from very low heat contents (200 to 300 Btu/cf)
because of non-combustible contaminants like oxygen,
carbon dioxide, nitrogen, water, etc. to energy contents of
1500 to 1800 Btu/cf. The additional heat comes from liq-
uid hydrocarbons of higher carbon contents entrained in
the gas. The higher carbon content molecules are known
as “natural gas liquids” (NGLs). Also, other combustible
gases like hydrogen sulfi de contained in natural gas can
raise the heat content of the gas produced.
Data from the Federal Energy Information Agency
(EIA) show an “average” cubic foot of gas produced in
the U.S. as dry natural gas in recent years would have
had an average of 1,028 Btu/cf. Gas is treated and/or
processed to remove the contaminants lowering or rais-
ing the Btu quantity per cubic foot to meet pipeline speci-
fi cations for handling and shipping and the gas. Pipeline
quality natural gas is 950 to 1150 Btu per cubic foot.
A frequently used term to describe the energy con-
tent of natural gas when sold at the local distribution
level, such as residential, commercial or small industrial
users, is the “therm.” A therm is equivalent to 100,000
Btu. Ten therms would make a “dekatherm” (Dt) and
would be equivalent to a million Btu (MMBtu). The therm
makes it easier when discussing smaller quantities of
natural gas.
When exploration and production companies search
for gas in the ground, they refer to the quantities located
Figure 21.6 Natural Gas Markets 1999
NOTE: INDUSTRIAL INCLUDES INDEPENDENT POWER PRODUCTION
JOFREE HOUSTON, TX 77002 CF 20 JUN 2000
556 ENERGY MANAGEMENT HANDBOOK
as reserves. This is a measure of the gas the companies
expect to be able to produce from the fi elds where the gas
was found. Through various exploration methods—ba-
sic geophysical studies of the ground and surrounding
areas to the fi nal steps of development wells are used
for more accurately pin-pointing reserve volumes. Re-
serves are the inventory these companies hold and from
which gas is produced to fi ll market needs. In 1997, the
U.S. government’s Department of Energy showed U.S.
natural gas reserves in the order of magnitude of 170 tril-
lion cubic feet (Tcf) of economically recoverable reserves.
Without any replacement, this would be a 5- to 7-year life
of existing reserves at current consumption rates. U.S.
exploration and production companies are continuously
looking for new reserves to replace the gas taken from
the ground for current consumption. From 1994 to 1997,
producers found reserves equal or more in volume to gas
produced during that year. The reserve volumes are from
areas where gas is already being produced and represent
a very secure number for the amount of gas thought to
be in the ground and economically feasible to produce.
These are called recoverable reserves based on produced
and fl owing gas.
The next level of measuring reserves is gas held
behind these recoverable producing reserves. A little
less secure and a little more speculative but, still a good
chance of producing as designated. Using this category,
just for the U.S., there are enough gas reserves for 25 to
35 years depending on the amount consumed each year.
There are abundant gas reserves in North America to
assure a steady supply for the near term and future. In
addition to the U.S. reserves, gas in Mexico and Canada
are considered a part of the U.S. supply or the total North
American supply. Mexico contributes very little to the US
supply at this time because its gas production and trans-
portation systems are limited. As gas demand and prices
increase, Mexico could play an important role as an U.S.
supplier. As already noted, considerable amounts of gas
come from Canada.
In addition to these two levels of gas reserves,
there are additional categories “possible” or potential of
reserves. These become more speculative but are still an
important potential supply for the future. Some of these
may become more important sooner than expected. A
good example is the gas supplies coming from coal seam
sources. Considerable gas is produced in New Mexico
from these sources which were not expected to be such
large suppliers until much later in time. Additional
potential supplies but with long lead times for further
development is gas from hydrates and gas from sources
deeper in the Gulf Coast.
Natural gas produced from wells where crude oil
is the major product is termed “associated gas.” Roughly
40% of the gas produced in the U.S. comes from associated
wells while the rest comes from wells drilled specifi cally
for natural gas. Only differences between the gas pro-
duced from the two types of wells are the associated wells
gas might contain greater amounts of what has been men-
tioned previously as “natural gas liquids” (NGL). These
liquids are organic compounds with a higher number of
carbon elements in each of the molecules making up that
compound and are entrained in the gas as minute liquid
droplets. Methane, which is the predominant compound
in natural gas, has one carbon and four hydrogens in the
molecule. The two-carbon molecule is called ethane, the
three-carbon molecule is propane, four-carbon molecule
is butane, and the fi fth, is pentane. All molecules with
more than fi ve carbons are collected with the pentanes
and the product is called “pentane plus.” It is also known
as “natural gasoline” which must be further refi ned be-
fore it can be used as motor fuel. The NGL are removed
by physical means either through absorption in an organ-
ic solvent or through cryogenically cooling the gas stream
so that the liquids can be separated from the methane and
each other.
There are markets for the individual NGL products.
The ethane is used by the chemical industry for making
plastics. Propane is also used in the chemical industry
but fi nds a signifi cant market as fuel. Butanes go to the
chemical and fuels market and the pentanes plus are
basically feedstock for the motor fuels production from
refi neries. The overall NGL market is about a $10 to 15
Billion a year business depending on the product prices.
Prices for NGL vary as the demand varies for each of the
specifi c products and bear little relationship to the price
paid for the natural gas. When gas prices are high and
NGL prices are low, profi tability on the NGL is very poor.
At the times, when the profi tability is poor, the ethane
will be re-injected back into the natural gas stream and
sold with the gas to boost the heat content of the gas.
A second difference between associated and gas
well gas is strictly of a regulatory nature. Gas from asso-
ciated wells is produced with no quantity regulations so
that the maximum amount of crude oil can be produced
from the well. Gas from “gas only” wells depending on
the state where produced, may be subject to production
restrictions because of market, conservation, or other
conditions. Major natural gas producing areas in the U.S.
are Texas, Louisiana, Oklahoma, and New Mexico. These
states, including the offshore areas along the Gulf Coast
stretching from Alabama to the southern tip of Texas, ac-
count for over 80% of the gas produced in the country.
Figure 21.7, North American Gas Producing Areas, shows
the gas producing states in the United States and the im-
NATURAL GAS PURCHASING 557
port locations for Canadian gas and for LNG receiving
terminals. Other states with signifi cant gas production
are California, Wyoming, Colorado, New York, Penn-
sylvania, Alabama, Mississippi, and Michigan. A total
of 18 states supply commercial quantities of natural gas
according to the Federal EIA.
A major supplier of gas for the U.S. is Canada.
While imports do come from other countries, Canada by
far, is the major supplier to the lower 48 states. Natural
gas coming from Canada is transported by pipeline into
the U.S. The small amounts of gas coming from Mexico
also travel by pipeline. Imports from other countries into
the U.S. are transported as liquefi ed natural gas (LNG).
Here natural gas at the producing country is cooled and
compressed until it is liquid. The reduction in volume
is roughly 20 times the original volume. The liquefi ed
gas with its reduced volume is now economically sized
for shipping. The liquefi ed gas is transported between
countries in large vessels, which are essentially very large
cryogenically insulated, fl oating containers. The LNG is
received at terminals in the U.S. where it is re-vaporized
to gas. During this step, large quantities of refrigeration
are available from the expanding liquid to gas. The cool-
ing “energy” is sold and used in commercial applications
to recoup some of the costs in making the gas into LNG.
There are currently four terminals in the U.S. for receiving
and handling LNG. These are in Boston, Lake Charles,
LA, Baltimore, MD, and off the coast of Georgia at Elba
Island. The Baltimore and Georgia locations were shut
down years ago when natural gas prices would not jus-
tify LNG sales. Current plans are to reopen both facilities
shortly.
Overall imports into the U.S. have grown con-
siderably since the mid-1980s when only 843 Bcf were
imported in 1985. Natural gas imports in 1999 increased
for the 13th consecutive year to 3,548 Bcf, 16.0 percent of
Figure 21.7 North American Gas Producing Areas in 1999
U.S. PRODUCTION 18,659 Bcf
IMPORTS 3,538 Bcf
TOTAL 22,197 Bcf
558 ENERGY MANAGEMENT HANDBOOK
total U.S. gas supply. Canada supplied 93.9 percent of the
total imports in 1999. Of the total imports, only 4.5 per-
cent were received as LNG. Canada did much in the late
1990s to expand the pipeline systems bringing gas to the
U.S. Additional pipelines are scheduled for completion
early in the new millennium. Most Canadian production
is in the provinces of Alberta and British Columbia. New
production did come on from the Eastern Coast late in
the last century and was imported into the U.S. from the
Maritime Provinces. Since 1985, Canadian imports have
more than quadrupled and Canada plays a major role
in the expected additional supply needed to meet the
demand for the years to come. Estimates are Canadian
gas volumes will increase insuring the supply of gas for
U.S. demand in future years. The Alliance Pipeline was
completed in late 2000 and added 1.3 Bcf/day of supply
to the U.S. Already, Canadian gas makes up a signifi cant
portion of the gas going to the U.S. Northeast. Figure 21.7
shows the major importing locations for gas coming into
the U.S. from Canada.
While natural gas imports into the U.S. as LNG were
small in comparison to the total gas imported in 1999, the
amount coming in 1999 was roughly three times that re-
ceived the prior year. Equally important, the number of
countries supplying LNG to the U.S. increased from three
to six. Algeria continued to be the major supplier with 75
Bcf in 1999 but recently completed production facilities
in Trinidad supplied 49 Bcf in the same year. Plans are
to make all the terminals in the U.S. operative so that ad-
ditional LNG supplies can be expected. Locations of all
terminals are shown in Figure 21.7
21.3.2 Transportation
Natural gas in the United States is transported almost
exclusively by pipeline. From the time the natural gas
leaves the wellhead, whatever route it takes in getting to
the burner tip, it is through a pipe! Short or long distance,
regardless, natural gas is transported in pipe. Only excep-
tions are the few times compressed natural gas is trans-
ported by truck for short distances. And, in some locations
where gas is liquefi ed (LNG) for storage for use during
peak demand times, the LNG is moved by truck also.
Movement of gas through these two means is insignifi cant
in the overall picture of transporting natural gas.
When talking of transporting natural gas through
pipelines, there are three main groups of pipelines to be
considered:
Gathering System: These are the pipelines in the
fi eld for collecting the gas from the individual wells and
bringing it to either a central point for pick up by the
long-haul pipeline or to a central treating and/or process-
ing facility.
Long-haul transportation: This is the pipeline pick-
ing up the gas at the gathering point, or if a highly pro-
ductive well near a pipeline, from the well itself and mov-
ing the gas to a city-gate for delivery to the distribution
company or to a sales point for a large user where the gas
is delivered directly to the consumer. The long-haul pipe-
line can be either an interstate pipeline that crosses from
one state into another or an intrastate pipeline where
the transportation is only within the state where the gas
was produced. The interstate pipelines are economically
controlled by the Federal Energy Regulatory Commis-
sion (FERC). The operating regulations fall under the
Department of Transportation (DOT). The Environmen-
tal Regulatory Agency has jurisdiction regardless of the
type of pipeline in regard to environmental matters. The
interstate pipelines are still economically regulated by
the Federal Energy Regulatory Commission (FERC) since
these are utilities engaged in interstate commerce.
Intrastate pipelines are economically regulated by
state agencies. Utilities are granted a license to operate in
certain areas and are allowed to make a rate of return on
their invested capital. This is different from the non-regu-
lated businesses where they compete to make profi ts from
the operations. As utilities, the rates for transportation are
set through regulatory procedures. The pipeline makes a
rate case for presentation to the FERC for authorization
to charge the rates shown in the case. The pipeline is al-
lowed to recover all of its costs for transporting the gas
and make a return on the invested capital of the pipeline.
Natural gas pipelines offer essentially two basic types
of rates for transporting natural gas: fi rm and interrupt-
ible. With fi rm transportation, the transportation buyer is
guaranteed a certain volume capacity daily for the gas it
wants transported. The buyer is obligated to pay a por-
tion of the transportation charge regardless whether its
uses the volume or not on a daily basis. This is called a
“demand charge” and is a part of the transportation tariff.
The second part of the tariff is the commodity charge and
is a variable charge depending on how much gas is trans-
ported by the pipeline.
Pipelines also offer an “interruptible” tariff where
space is on a “fi rst come-fi rst served” basis. Interruptible
transportation carries no guarantee to the party buying
the transportation that space in the pipeline will be avail-
able when needed. The tariff here is usually very close to
the commodity rate under the fi rm transportation.
The methodology of the ratemaking procedure used
to recover the pipeline’s costs and rate of return is such
that when a pipeline sells all of its fi rm transportation, it
will make its allowed rate of return. A pipeline can legally
exceed its accepted rate of return based on its handling
of the fi rm and interruptible transportation. Typically,
NATURAL GAS PURCHASING 559
the pipeline has about 80% of its volume contracted in
fi rm transportation. When a fi rm transporter does not
use its full capacity, the pipeline can mitigate the costs to
that pipeline by selling its fi rm transportation to another
transporter as interruptible transportation.
Many of the transportation contracts for fi rm trans-
portation are terminating in the 2000 period. With the
changes in the marketing system and the shift in the
merchant role, some pipelines may have diffi culty in fi ll-
ing their fi rm transportation suffi ciently, This may bring
some reduction in transportation costs which the gas
buyer may be able to exploit. Further, the gas buyer at
times can use what is called “back hauling” to get a lower
rate for gas transportation. An example of this might
be gas coming from Canada through the North Central
U.S. area such as Chicago. A buyer for this gas might be
located in the Southwest, say in Texas. Rather than ship
gas from Chicago to Texas and have to pay the full tar-
iff, a shipper might exchange gas in Texas for the gas to
come from Chicago to Texas. In turn, the gas coming from
Canada would be sold in the Chicago area as “Texas” gas.
Here the shipper would pay the much lower fee for the
“paper transportation” of the gas volumes. This would be
a back haul arrangement.
The interstate pipeline community is relatively
small. Many of the pipelines have merged or were ac-
quired by other utilities since the regulatory changes
in the industry took the merchant function from them
and made them strictly transporters. There are 25 major
interstate pipelines moving gas from the production ar-
eas of the country to the consumer. These are owned or
controlled by only 13 companies. Table 21.1, U.S. Inter-
state Natural Gas Pipelines, lists the major U.S. interstate
pipelines, and the parent company having ownership. In
all likelihood, even more mergers and acquisitions will
occur to bring the number of separate companies even
lower.
Intrastate pipeline companies are within the state
where the gas is produced. Many of these have miles of
pipeline comparable to the interstate systems but, do not
cross state lines. Within the state, these pipelines serve the
same mission as the interstate pipelines; bringing the gas
from the fi eld whether the well or gathering point to the
city gate for distribution by the local distributor or direct-
ly to a large consumer. Some of the larger ones for the gas
producing states are listed in Table 21.2. While the pipe-
lines themselves are no longer sellers of natural gas, the
buyer should review the pipelines’ systems to see if there
is a close connection possible so a direct supply might be
made from the pipeline to the consumer. In cases where a
pipeline is close to a plant or other large user, a marketer
or the buyer itself can make arrangements for the short-
haul pipeline to bring gas from the transporting pipeline
to the facility.
Pipeline transportation might include more than
one pipeline to complete the shipment from well to
burner tip. Who pays for the transportation at each step
is open to negotiation between the gas supplier and the
buyer. Usually, the producers are responsible for the gath-
ering and fi eld costs of getting the gas to the transporta-
tion pipeline’s inlet, which may be on the pipeline or at a
terminal point, sometimes designated as a “hub.” Many
times when the transporting pipeline goes through a
producing fi eld, the producer will only be responsible for
gathering charges to get the gas from the wellhead to the
fi eld’s central point for discharge into the pipeline’s inlet.
The gathering and fi eld charges along with the transpor-
tation to the transporting pipeline inlet is what makes the
difference between wellhead gas prices and “into pipe”
gas prices.
Table 21.1 U.S. Major Interstate Natural Gas Pipelines
———————————————————————————————
PARENT PIPELINE
PIPELINE COMPANY HEADQUARTERS
———————————————————————————————
Panhandle Pipeline CMS Energy Houston, TX
Trunkline Pipeline Houston, TX
ANR Pipeline Coastal Corp. Houston, TX
Detroit, MI
CIG Pipeline Colorado Springs, CO
Columbia Gas Tran’n Columbia Energy Co. Charleston, WV
Columbia Gulf Trans’n Houston, TX
CNG Pipeline Dominican Energy Pittsburgh, PA
Algonquin Gas Trans’n Duke Energy Boston, MA
Texas Eastern Pipeline Houston, TX
El Paso Pipeline El Paso Energy Houston, TX
Sonat Gas Houston, TX
Tennessee Pipeline Houston, TX
Florida Gas (50%) Enron Corporation Houston, TX
Northern Natural Gas Omaha, NE
Transwestern Pipeline Houston, TX
NGPL Kinder Morgan Houston, TX
Gateway United Koch Industries Houston, TX
Wiliston Basin MDU Resources Bismarck, ND
National Fuel Gas National Fuel Gas Buffalo, NY
Northern Border Northern Border Omaha, NE
PCT Pacifi c Gas & Electric San Francisco, CA
Questar Pipeline Questar Energy Salt Lake City, UT
Mississippi River Reliant Industries St. Louis, MO
Noram Pipeline Houston, TX
Northwest Pipeline Williams Companies Salt Lake City, UT
Texas Gas Pipeline Owensboro, KY
Transco Pipeline Houston, TX
Williams Gas Pipeline Tulsa, OK
———————————————————————————————
JOFREEHOUSTON, TX CF 20JUN2000
560 ENERGY MANAGEMENT HANDBOOK
Who pays for the transportation charges from the
transporting pipeline’s pick-up to the city gate or distri-
bution company’s inlet, even if it includes more than one
transporting pipeline, is negotiable between the seller or
marketing company and the buyer. The marketing com-
pany selling the gas might quote a delivered price to the
buyer, especially, if the seller is holding transportation
rights with the pipeline handling the transportation. If
the buyer has transportation rights, he might take the gas
FOB (Free on Board, the point where title transfers and
where transportation charges to that point are included
in the sales price) at the transportation pipeline’s inlet.
These are all part of the marketing and negotiating in
moving gas from the fi eld to the city gate and/or the con-
sumer.
What are typical prices for transporting natural gas
from producing area to consumers in various parts of the
country where there is no intrastate gas? The buyer can
get detailed information from the pipeline tariffs which
can be gotten from the FERC and other sources like trade
letters and magazines.
Pipeline rates or tariffs are set by the regulatory
agencies involved. There is some negotiation possible.
Still, the gas in different locations will have a value based
on market conditions regardless of transportation rates.
This is called "basis differential." Some typical basis dif-
ferentials between hubs and major markets are shown in
Figure 21.8. These were developed from published prices
given in trade publications for a several month period to
get representative values.
For natural gas to be carried in transportation
pipelines, it must meet certain conditions of quality and
composition. This was previously referred to as "pipeline
specifi cations." These standards include the heating con-
tent of the gas per unit volume; i.e. British thermal units
per cubic feet (Btu/cf). Typically, pipeline quality gas will
Table 21.2 U.S. Major Natural Gas Intrastate Pipelines—Summer 2000
———————————————————————————————————————————————————
STATE PIPELINE PARENT HEADQUARTERS
———————————————————————————————————————————————————
ALABAMA Southeast Alabama Gas Southeast Alabama Gas Andalusia, Al
———————————————————————————————————————————————————
CALIFORNIA Pacifi c Gas Trans’n Pacifi c Gas & Electric Co. San Francisco, CA
——————————————————————————————————————————
Southern California Gas Sempr Energy Los Angeles, CA
———————————————————————————————————————————————————
LOUISIANA Chandeleur Pipeline Co. Chandeleur Pipeline Co. Woodlands, TX
——————————————————————————————————————————
Louisiana Interstate Pln AEP Corp. Alexandria, LA
——————————————————————————————————————————
Mid Louisiana. Gas Co. Midcoast Energy Resources Houston, TX
——————————————————————————————————————————
NEW MEXICO Gas Company of New Mexico Public Service Co. of New Mexico Albuquerque, NM
———————————————————————————————————————————————————
OKLAHOMA Enogex, Inc. Enogex, Inc. Oklahoma City, OK
——————————————————————————————————————————
Oneoak Gas Tran’n Oneoak Inc. Tulsa, OK
———————————————————————————————————————————————————
TEXAS Aquilia Gas Pipeline Utilicorp Omaha, NE
——————————————————————————————————————————
Ferguson-Burleson County Gas Mitchell Energy & Dev’t Corp. Woodlands, TX
——————————————————————————————————————————
Houston Gas Pipeline Enron Energy Houston, TX
——————————————————————————————————————————
Lone Star Gas Pipeline Ensearch Dallas, TX
——————————————————————————————————————————
Midcon Texas Pipeline Midcon Texas Houston, TX
——————————————————————————————————————————
PG&E Texas Pipeline PG&E Houston, TX
——————————————————————————————————————————
Westar Transmission Kinder-Morgan Houston, TX
——————————————————————————————————————————
Winnie Pipeline Co. Mitchell Energy & Dev’t Corp. Woodlands, TX
———————————————————————————————————————————————————
JOFREEHOUSTON, TX CF 20JUN2000
NATURAL GAS PURCHASING 561
be around 1,000 Btu/cf. Gas coming out of the well, can
range from very low values to over 1,500 to 1,600 Btu/cf.
The lower values come from gas having contaminants
like carbon dioxide or nitrogen in the stream while the
higher values come from the gas containing entrained
liquid hydrocarbons or hydrogen sulfi de. The contami-
nants are removed in treating, for the hydrogen sulfi de
and other acid impurities, and processing facilities for the
liquid hydrocarbons such as ethane, propane, etc. Typi-
cally, pipeline quality gas will run around 1,000 Btu/cf
with a range of from 950 to 1150 Btu/cf. The exact amount
is measured in the stream as the gas is sold on a Btu basis.
Typical other specifi cations for pipeline transmission of
natural gas are given in Table 21.3.
Distribution: Once the natural gas is moved from
the producing area it can travel from a few miles to thou-
sands of miles in getting to its destination. The usual ter-
minating point for the gas is at a city gate where the local
distribution company (LDC) delivers it to the individual
Figure 21.8 Typical Natural Gas Basis Differentials between Hubs and Major Market Points.
user whether it is a commercial, residential, or industrial
consumer. In some cases where the consumer is a large
industrial or an electric generating plant, the gas might go
Table 21.3 Natural Gas Interstate Pipeline Specifi cations.
—————————————————————————
Contaminants may not exceed the following levels:
—————————————————————————
20 grains of elemental sulfur per 100 cubic feet
1 grain of hydrogen sulfi de per 100 cubic feet
7 pounds of water per million cubic feet
3 percent of carbon dioxide by volume
Other impurity (i.e. oxygen, nitrogen, dirt, gum,
etc.) if their levels exceed amounts that the buyer must incur
costs to make the gas meet pipeline specifi cations.
—————————————————————————
Source: Handbook on Gas Contracts, Thomas G. Johnson, IED
Press, Inc. Oklahoma City, OK. 1982, page 63
562 ENERGY MANAGEMENT HANDBOOK
directly from the long haul transporter to the consumer.
There are hundreds of distribution companies in the
country. Some are investor owned utilities while many
are municipality owned and operated. Some are co-ops
formed for distributing the gas.
The trade association representing this group of
gas companies almost exclusively is the American Gas
Association, headquartered outside of Washington, DC.
Information and data on the industry as a whole, and on
distribution companies can be obtained from this organi-
zation. Its address and web site are listed in Table 21.4.
The local distribution company is usually regulated
by the state regulatory agency such as the Public Service
Commission. It may also be under local regulation by
the city or municipality it serves. This group of natural
gas transporters is yet to be deregulated throughout the
country. Some states, Georgia the most notable, have
passed new regulations much like the decontrol of the
national pipelines. In these locations, the transporter is
strictly a mover of gas and has no merchant function. It
may have a subsidiary or affi liated company doing the
merchant function or marketing of the gas. The eventual
result of deregulation at this level will be for local distri-
bution companies to offer open access to their transporta-
tion facilities. Each state will have to make its decision
as to whether the LDC is freed from the merchant role or
retains it if only in part along with offering open trans-
portation for other merchants to move gas to the fi nal
consumer.
The odorizing of natural gas so that its presence
can be detected easily since natural gas as such is an
odorless gas, is usually done by the local distribution
company before distributing the gas. The odorant is a
sulfur containing hydrocarbon with an obnoxious odor
that can be detected by human smell even when used in
very small, minute quantities in the gas. While it is com-
monly thought all natural gas must be odorized when it is
sold to the user, this is not necessarily correct. Gas going
to industrial uses where the sulfur containing material
giving the odor could be harmful to the process need
not be odorized. There are both federal and state regula-
tions governing the odorization. In buying natural gas,
the buyer should insure the contract includes provision
for adding the odorant and whose responsibility it is for
proper addition and monitoring.
21.3.3 Economics
Natural gas prices were originally set by the federal
regulatory agency having jurisdiction over natural gas.
The original methodology for price setting was much like
the rate of return methodology for pipeline transporta-
tion tariffs. This was a direct function of the believed costs
of fi nding, developing and producing natural gas. As
discussed previously, the low prices paid at the wellhead
prevented the natural gas industry from maintaining the
necessary supply and caused the dire gas shortages of the
mid-1970s. After natural gas prices were decontrolled,
and natural gas became a true commodity, prices are a
Table 21.4 Federal Agencies & Natural Gas Trade Associations
ORGANIZATION INFORMATION & SERVICES WEBSITE
————————————————————————————————————————————————————————
FEDERAL & MAJOR STATE AGENCIES FOR NATURAL GAS & ENERGY REGULATION
1 Department of Commerce Information on offshore production of gas and oil www.doc.gov.
2 Department of Energy (DOE) Information on energy products; supply, demand,
Energy Information Agency consumption, prices, www.eia.doe.gov
3 Department of Transportation Regulates the safety of pipelines used in transporting www.dot.gov
natural gas.
4 Federal Energy Regulatory Regulates natural gas pipeline tariffs and facilities.
Commission www.ferc.fed.us
5 Louisiana Offi ce of Regulatory board for Louisiana natural gas operations.
Conservation www.dnr. state.la.us
6 New Mexico Public Regulation Regulatory board for New Mexico.
Commission www.nmprc.state.nm.us
7 Oklahoma Conservation Regulatory board for Oklahoma.
Commission www. okcc. state. ok. us
8 Texas Railroad Commission Regulatory board for Texas. www.rrc.state.tx.us
(Continued)
NATURAL GAS PURCHASING 563
NATURAL GAS & RELATED ENERGY TRADE ASSOCIATIONS
1 American Gas Association Trade organization on natural gas; major source of
(AGA) information on gas local distribution companies. www.aga.org
2 American Petroleum Institute Represents the nations oil and gas industries
(API) www.api.org
3 Association of Energy Engineers Organization supplying information and services for
energy effi ciency, energy services, deregulation,
facilities, management, etc. www.aeecenter.org
4 Canadian Energy Research Responsible for Canadian energy
Institute (CERI) research. www.ceri.ca
5 Edison Electric Institute Represents electric industry; major area
is investor -owned electric companies. www.eei.org
6 Gas Industry Standards Board Industry forum for development of
(GISB) natural gas measurement methods and
standards for gas transmission. www.gisb.org
7 Gas Processors Association Trade association for natural gas processors, a
group of companies extracting gas liquids from
natural gas streams and marketing the products. www.gasprocessors.com
8 GasMart Annual marketing meeting for natural gas suppliers,
transporters, customers, and marketers. www.gasmart.com
9 Gas Research Institute Develops technical solutions for natural
gas and related energy markets. www.gri.org
10 Interstate Natural Gas Voice of the interstate natural gas system including
Association of America the pipelines and companies supplying
natural gas. www.ingaa.org
11 National Energy Marketers National non-profi t trade association representing
Association all facets of the energy business. www.energymarketers.com
12 Natural Gas Information & Sweb-site dedicated to natural gas
Education Resources education and history. www.naturalgas.org
13 Natural Gas Supply Represents independent and integrated
Association (NGSA) producers and marketers of natural gas. www.ngsa.org
14 Southern Gas Association Links people, ideas, and information for transmission,
(SFA ) distribution, and marketing of natural gas to all
customers served by member companies. www.southerngas.org
—————————————————————————————————————————————————————————
JOFREE HOUSTON, TX 77002 CF 21JUN2000
ORGANIZATION INFORMATION & SERVICES WEBSITE
————————————————————————————————————————————————————————
564 ENERGY MANAGEMENT HANDBOOK
refl ection of the normal economic factors impacting com-
modity pricing.
The price for natural gas at the burner tip is depen-
dent on many things—market conditions, supply/de-
mand balances, economic conditions, and many more in-
cluding the activity of natural gas fi nancial markets, prices
for competing fuels, etc. In the early stages of the industry,
because natural gas was considered a burdensome by
product of the crude oil industry, it was sold for very low
prices. When crude oil was around $2/barrel (B) or about
30 cents per million British thermal units (MMBtu), natural
gas under federal price control sold for a penny or two per
thousand cubic feet or roughly the same per MMBtu. In
actual heating value, a thousand cubic feet of natural gas
has close to a million Btu. A barrel of fuel oil is 42 gallons
of oil and about six million Btu depending on the grade of
fuel oil. On an economic basis of energy content, natural
gas prices for a thousand cubic feet compared to a 42 gal-
lon barrel of oil, should be close to one-sixth the value of
the oil, i.e. an $18 barrel of oil would be equivalent to $3/
Mcf or $3/MMBtu natural gas. Very seldom has the price,
even after decontrol, reached this ratio. Instead, the value
of gas has run about half or about one-twelfth or one-tenth
the value of the oil product. In 2000, oil prices (West Texas
Intermediate, WTI) were around $35/B. At the same time
natural gas prices were over $5.00/MMBtu. Gas prices
were about one-sixth the value of oil in dollars per barrel,
very close to the energy equivalent of competing fuel, re-
sidual fuel oil. For the fi rst time gas at the wellhead was at
parity with crude oil in $/Btu.
The fear in 2000 was gas supplies would not meet
demand. Gas demand is increasing as more and more
power plants are being completed that will use natural
gas as fuel. This will do much to balance the gas demand
between summer and winter. In summer the gas will go
as fuel for electric generation to meet the hot weather re-
quirements for power for air-conditioning, and in winter
it will go as fuel for heating. Many buyers fear the high
summer demand will prevent storage fi lling believed
necessary for the winter heating season.
Pricing is not a logical phenomenon. Data and basic
considerations can help in predicting prices but the fi nal
price is very dependent on perception—market percep-
tion at the time. Too many of the variables are unknown
precisely enough for pricing to be a scientifi c conclusion.
Forecasting prices is art. Perception of the value based on
supply/demand parameters sets the price. The market
itself will do a lot to raise or lower the price. Further, the
large fi nancial market compared to the physical market
for natural gas has an immense impact on the prevailing
price. Gas prices can “spike” for many reasons—real or
perceived. Hurricanes, hot weather spells, changes in the
economy, etc. can make prices go up or down quickly and
signifi cantly. Short-term changes are always a possibil-
ity. Seasonality at times has little bearing on the current
price. Natural gas prices have dropped precipitously in
the middle of January and reached highs for the year in
“shoulder months.” Eventually, prices come back to real-
ity but in the time they are moving large dollar gains or
losses can occur.
In looking at gas prices, it is necessary to know
where the gas is sold as prices vary according to where
the sale is made in the wellhead to consumer path. Unlike
crude oil, which is transformed into various commercial
products, each with its own value, natural gas is essen-
tially the same once it enters the transportation portion of
the journey to the burner tip. Its value does increase as it
moves through the system going from the wellhead to the
consumer because of the added value of the transporta-
tion and services bringing the gas to market.
The simplest place for pricing natural gas is gas sold
at the wellhead. Gas priced on a Btu value at the wellhead
will accurately refl ect the value of the gas further down
the chain even though wellhead gas might need to be
gathered, treated, and/or processed. Once the gas is pipe-
line quality, its price refl ects where in the transportation
line from sales point to ending sales point it is at the time.
Anywhere in the chain, the wellhead price can be deter-
mined by net backing the price to the wellhead by sub-
tracting the additional costs to get to the point of pricing.
The value of the gas, since it is a commodity, is open to
supply/demand forces on the pricing. In addition, since
at times pipeline capacity for moving the gas is suscep-
tible to supply/demand restraints for capacity, the price
differentials based on location can be affected also. This
is how the basis differential of gas prices between differ-
ent locations occurs. This is refl ected in Figure 21.8. Gas
purchased at the wellhead is done so on a wellhead price.
Gas purchased further downstream might be termed
“into pipe price” or “hub price” if coming from a central
point where gas supplies come together for distribution
to pipelines for long-haul transportation.
The New York Mercantile in making a futures mar-
ket for natural gas, has its main contract, at the Henry
Hub, in Louisiana because of the hub’s central locality
and easy accessibility. The difference between prices for
major hubs or selling locations is termed the “basis” pric-
ing and can vary much depending on the current supply/
demand factors.
The fi rst of the typical major pricing points for natu-
ral gas would be the wellhead or fi eld price. This might
include actual sales at the wellhead, at a central location
after the gas is gathered in the fi eld, or at the tailgate of a
treating and/or processing plant depending on the plant
NATURAL GAS PURCHASING 565
location in relation to the transporting pipeline.
The next major pricing point would be the “into
pipe” price where the gas goes into a pipeline for trans-
portation to the marketing area or to a “hub” for further
redirection and transportation to the consuming area. The
hub has the ability to dispatch the gas coming in on one
pipeline to another in the variety of pipelines coming into
and leaving the hub.
From the hub pricing, gas would then be priced at
the city gate where it is transferred to a local distribution
company for delivery to the consumer. The pricing for
the consumer would be based on the “sales point” price,
which would be a total price for the gas including all the
transportation and services required to get the gas to the
user's receipt point.
The individual price paid by the buyer is dependent
on many factors starting from the wellhead pricing to the
price at the meter coming onto the buyer’s property. In
generalities, the government and other reporting services
report the prices at the major pricing points and at the
consumers’ location. The major consuming sectors where
prices are reported are the residential, commercial, indus-
trial, and electric generating markets. Since the progression
from each of the stages from production to market carries
a cost factor, it is important to know where in the delivery
chain the price quoted applies. Figure 21.9 is a comparison
of prices at each of these major market points for 1998.
21.3.4 Environmental
Environmentally, natural gas is the preferred fuel.
Even though it is a fossil fuel, the amount of carbon di-
oxide released is the lowest per unit of energy received of
the major fossil fuels. Natural gas is ideal for its handling
and transportation qualities. Its environmental advan-
tages makes it the most popular fuel and fuel of choice for
many applications. It presents no unique environmental
concerns to the user and as long as the supply is pipeline
quality, the fuel source is of no concern in regard to envi-
ronmental purposes.
21.3.5 Regulatory Changes
To the average gas buyer, the new natural gas indus-
try presents few regulatory problems or concerns other
than those imposed by local or state authorities. The fed-
eral regulations from prior years on natural gas have been
reduced. While natural gas pricing is no longer under
federal regulations, it is still tied to some of the original
federal natural gas laws. In today’s markets, these are
essentially of no interference to commerce. It does mean
that under certain extreme conditions, federal regulations
could again be imposed on natural gas and certain uses
could be restricted.
For the current conditions, the buyer mainly has to
be concerned with local and state rules and regulations.
Transportation, storage and handling regulations are
again local and state but here, federal agencies do play a
role. The Department of Transportation and the Environ-
mental Protection Agency have jurisdiction in the areas
of pipeline safety and environment, respectively. Buyers
should insure in their negotiations and contracts with
sellers, transporters, and providers that all regulations
are covered and the responsibility for meeting these rules
are a part of the transaction. The contracts for buying and
transporting should speak directly to whose responsibil-
ity meeting the requirements will fall and which parties
will be responsible for the consequences if failure occurs.
Figure 21.9 Natural Gas Prices by Sales Points for 1998
POWER
INDUSTRIAL
COMMERCIAL
RESIDENTIAL
CITYGATE
WELLHEAD
0 5 10 15 20
Source: U.S. EIA & Natural Gas WEEK EXCLUDES ALASKA & HAWAII
$MMBtu
566 ENERGY MANAGEMENT HANDBOOK
Agencies having responsibility for natural gas regu-
lations at the federal and state levels are easily accessible.
Table 21.4 lists the major federal agencies including the
web sites. State Public Utility Commissions (PUC) can
easily be located if information is necessary. Further,
many law fi rms and consultants specialize in the regula-
tory aspects and should be contacted if necessary.
21.4 BUYING NATURAL GAS
To buy natural gas for either small or large opera-
tions, a thorough knowledge of the structure of the natu-
ral gas marketing system is essential. Again, this is the
big change from the days when the industry was under
price regulation by the federal government. Gas sales to
consumers were through only one route—producers to
pipeline transporter and merchant to local distributor
to consumer. In the beginning of the transition to open
marketing, this was referred to as "system gas." In lo-
calities where LDC are still the merchants, this is still the
case. In a very small number of occasions, the chain was
shortened to producer to pipeline to major consumer.
Now—even with states in general still having control
over the local distribution, the chain can be as short as
producers to consumer or more generally, producers to
marketers to consumers for relatively large users and
producers to marketers to distributors for residential and
most commercial and small industrial applications. This
is the free market for natural gas. Buyers are free to pick
any marketer or seller to supply gas. Open transportation
is available to everyone—at least it should be!
21.4.1 Physical and Financial Markets
Since natural gas is a commodity—it is fungible—
and its supply is at times at the mercy of many factors
including weather, demand, economics, etc., there is a
market for buying gas supplies in the future. Commonly,
this is called the “futures market” as opposed to the
physical market where the actual commodity goes to the
buyer either for resale or consumption. Many users of
natural gas buy or “hedge” on the commodity market to
take advantage of prices offered in the future. The New
York Commodity Exchange (NYMEX) offers contracts for
up to 36 months and several banks and operators do an
over the counter market offering prices even further out.
The consumers or sellers (producers, marketers, users,
etc.) using the futures market are usually hedging as a
means of price risk protection.
As an example, a fertilizer manufacturer is a large
user of natural gas for making ammonia and derivatives
for use in fertilizers and industrial chemicals. If it takes
the ammonia manufacturer an average of 60 to 90 days
from the time he buys the raw material natural gas to be
ready to sell it as ammonia, he has to worry about the
price of both the ammonia and the price of the replace-
ment natural gas changing during the period. If he uses
$2 per MMBtu gas for the ammonia and then after sell-
ing the ammonia has to buy $3 per MMBtu gas to make
new ammonia, he could be at a price disadvantage in
the ammonia market. To “hedge” against these kinds of
price changes, the manufacturer can buy “futures” when
he starts making ammonia with the $2 raw material. He
can protect his future-buying price for the raw material,
which represent 70-80 percent of the manufactured cost
of the ammonia, by hedging his future purchases.
Since the prices on the futures market move con-
stantly, almost daily for the near term market and less
as time goes out, the futures market makes an ideal me-
dium of wagering what the price will be in the future. The
“speculators” who come into the market have no need for
the commodity nor will they most likely ever take actual
physical ownership of it. Their purpose is strictly to wager
on where the price will be on a certain date. It can be either
up or down from the price on the day they buy “futures.”
This is not a small market but one in billions of dollars. In
1999, it was estimated that for every billion cubic feet of
gas consumed in an average day, 10 to 12 billion cubic feet
were traded on the NYMEX exchange and other markets.
Of course, some of this 12-fold excess of consumption went
to hedging, but roughly speculators traded 90 percent. The
average amount of gas consumed per day in 1999 without
regard to seasonality was about 60 billion cubic feet. Using
the wellhead price of around $3.00/MMBtu, about $180
million was traded each average day for the consumption
of gas. In the fi nancial trading markets, almost two billion
dollars per day were traded!
Other than to have mentioned the fi nancial market
and show its signifi cance in the natural gas industry, this
chapter is devoted to physical gas buying. The buyers
and sellers both need to know about the fi nancial markets
and evaluate their own need to participate or not in this
type of gas transactions. There are many marketing com-
panies, fi nancial houses, and consultants well versed in
the fi nancial markets and how trading in these can lower
the over all purchase costs of the commodity. Many books
are written on this aspect. Buyers and sellers should be-
come familiar with all sources of information in this area
in helping to either maximize the return for the product
for the sellers or minimize the purchase costs for the con-
sumers. The comments on buying gas for use does not
negate the fi nancial market but, leaves it to other sources
for the users to learn how to work within the fi nancial
framework including its benefi ts and risks. Knowledge
NATURAL GAS PURCHASING 567
of the fi nancial markets are necessary because of the im-
pact the fi nancial market has on the physical market and
prices for natural gas.
21.4.2 Actually Buying the Gas
So—how does the gas user get down to the basics
of buying natural gas? Do they call the local distributor,
if the consuming facility is in an area served by the local
distributor, or does the buyer shop around for the best
price and service? Again, information and knowledge
are the secret to success. The buyer must know what is
needed to determine what path to follow in buying nat-
ural gas. If the buyer is looking for a source of gas for a
new operations, one never before using natural gas as the
fuel, then they must estimate the necessary parameters to
know how much is needed to fi ll the requirements of that
operation. If the buyer is replacing an expiring contract or
having to change vendors, then they have the historical
record to help in knowing what is needed to renew the
supply sources. They can use the existing information
and records to predict with greater accuracy what volume
of gas will be needed, the changes on a daily or other
time basis that will be needed and what were the prior
costs for the gas supply. With this information, the fuel
buyer can look for new sources to meet the needs more
effi ciently and cheaply.
The very fi rst question to be answered is how much
natural gas will be consumed on a daily basis and what
will be the range of use on a daily, weekly, monthly and
annual basis. The information could even be a question of
an hourly rate as to how large a swing does the user antic-
ipate. These are the big questions to answer in making the
fi rst step in trying to select a supplier or seller. Knowing
the quantity and conditions of where the rate will vary
are crucial to starting the buying process. Whether the
consumer is a large or small user of gas will play a major
role in what selections are open to it for purchasing gas.
The physical conditions prevailing in the area of the loca-
tion using the gas will play a role because of regulations
of the area and the actual physical availability of pipes for
transporting the gas to the consumer.
Typically, the break from a small user to a large
one is a rate of about one thousand cubic feet per day
or in energy units, about a million Btu per day. Most
local gas distribution companies will talk in “therms”
and “dekatherms” rather than Btu or cubic feet. The
dekatherm is ten therms. Each therm is 100,000 Btu. Each
dekatherm is one million Btu. The line between large and
small users is not rigid. Applications coming close to this
approximation may still meet the criteria for going the
large user route. If the user is on the small side, depend-
ing on the state or location of the use, it still may have an
alternative of buying from the local distribution company
or using the LDC for transportation only and buying the
commodity from a marketing entity. Making contact with
marketing companies, which will be discussed later, and
getting information on the local regulatory rules will help
in making this decision. Many local distribution compa-
nies have set up their own non-regulated marketing com-
panies to help consumers buy gas at the lowest price with
the required service criteria of their own operations. One
should not forget the potential of ECommerce, the newest
way to buy and sell natural gas. A smart buyer will look
at all possible sources for meeting his requirements at the
lowest price but with reliability and service.
In buying a commodity like natural gas, price alone
should not be the only criteria. Service (security of ser-
vice, emergency additional supplies, etc.) equally impacts
the buyer’s bottom line as does price in meeting fuel
requirements. Having a cheap supply of gas where its
availability is so uncertain as to disrupt plant or business
operations is really an expensive supply when looked at
in the total picture. Security of supply or additional sup-
plies, etc. is a valuable consideration to be included in
pricing natural gas sources.
The large users—those over the thousand cubic feet
level or close to it, should investigate all possible sources
for supply and transportation. Their sources may go all
the way back to the wellhead or producer marketing
companies. Depending on how large a supply is needed
at a given location, the buyer may include dealing with
pipelines and distribution companies for transportation
and delivery of the gas. Once the buyer knows in general
which direction to go, the big issues then become fi nding
a marketer, transportation, and contracts for the services
and commodity.
21.4.3 Natural Gas Marketers
Marketers come in varying forms, sizes, and de-
scriptions. One can look at it much like purchasing
gasoline at the local fi lling station—”Full-Service” or
“Self-Serve.” To add a little more variety or confusion,
gas buying and selling is moving to ECommerce and the
business-to-business Internet capabilities. When the start
of marketing companies began in the m id-1980s to take
the place of the merchant function performed by the pipe-
lines, it was almost anyone with a telephone and a pencil
could be called a natural gas marketer. Through the years,
with a number of the marketing companies taking on
added scope and abilities, the ”fl y-by-night,“ less reliable
marketers were pushed out of the business. Even some
of the more reputable, better fi nanced groups have gone
because of the inability to be profi table in a fast moving,
sometimes, irrational market place. With fi nancial trad-
568 ENERGY MANAGEMENT HANDBOOK
ing exceeding high volumes of trading each day, risk be-
comes an even more important element of consideration.
Marketing natural gas is more than just selling and
delivering gas to the consumer. The gas business is big
business running into revenues of around $100 Billion
per year depending on the exact price for the commodity
that year. The $100 Billion is only a measure of the actual
commodity trading on an idealized basis of direct trades
from producers to marketers to consumers. Actually, an
average cubic foot of gas most likely gets traded three to
four times before coming to the consumer, the entity with
the burner tip that will consume the gas and put it out of
the market. This is only for the physical side of the trad-
ing—the place where the commodity actually is moved to
a fi nal destination for consumption. The total natural gas
consumption in 1999 was 22 trillion cubic feet (Tcf).
This pales in comparison to the fi nancial markets
where 10 to 12 time the volume traded each day in the
physical market of consumed gas is traded in the fi nan-
cial sector. The money moved in this arena is beyond the
$100 Billion discussed previously. At times, the market
is responding more to the fi nancial than to the physical
drives. The speculators are doing more to move the mar-
ket than the actual users who need the natural gas for fuel
or feedstock. Like all commodities, natural gas makes an
ideal medium for fi nancial trading. There are those who
need to make a play in the market for the protection or
risk-adverse properties the market gives. Those who
produce the gas and those using large quantities can buy
some protection of the future price by buying futures.
This is “hedging.” The futures buyer is taking a position
for a given month in the future where the price he pays
will be the price for the quantity of gas he purchased
futures for on that given month. He/she has locked in
the price for gas anywhere from a month forward to 36
months forward. Whether buying or selling gas, hedging
is a tool to relieve some of the risk in buying or selling a
relatively volatile commodity.
The volatility of natural gas prices (no pun intend-
ed) makes it an ideal commodity for speculators to make
a market in it for the sheer purpose of making money. The
speculator is betting the price will be higher or lower on a
given date and is willing to take a position by buying the
commodity for trading at that time. Much of the trading
in natural gas is for speculation and this can only add to
the volatility of the market place. While most of the hedg-
ers bring a relatively simple mentality to the market place
based on supply/demand parameters, the economy, and
other pertinent factors, the speculators have a “statis-
tics” of their own for playing the market. Basically, the
speculators are “market technicians” and play a statisti-
cal analysis of the market itself for buying and selling the
commodities. The mentality of the speculator is basically,
“who needs to know all the details of the commodity, the
market place itself shows the results and following the
market place with its own statistical tools is the way to
go.” Of course, many of these speculators are very large
in the amount of money they control. When the signals
show its time to buy or sell, very large sums of money
can come into or leave the market. Easy to see how this
can make the price of the commodity very volatile. Figure
21.5 shows the prices for natural gas, coal, and crude oil
for the last fi ve years to give a comparison among these
three major fuels for electric generation as to the market
volatility of each one.
21.4.4 Finding the Seller
Now, to whom one goes for buying natural gas is
a question of the degree of service expected and needed.
A large user wanting to hedge prices to insure a stronger
control in the price paid for the commodity might go to
a “full-service” marketer while someone needing a rela-
tively small amount of gas at a reasonable price can call
the local distribution company or a more “self-service”
marketing company. The selection is diffi cult because
there are so many choices. There are roughly 30 major
marketing companies handling natural gas and any
where up to a couple of hundred smaller groups. There
are the local distribution companies in the area. Most
of them, in addition to selling “system gas” will have
an affi liate or subsidiary selling market sensitive priced
natural gas also. System gas is natural gas the LDC has
purchased for resale to its local customers. Since this cus-
tomer base includes residential and commercial custom-
ers as well as the industrial sector, the average price will
be higher usually. Most local distribution companies have
made available open access transportation so that large
industrial user can bring in its own gas supply and let
the local company transport it to the buyer’s facility. As
part of its tariff, the LDC will set a minimum amount of
gas the buyer uses as a criteria for allowing the buyer to
purchase its own gas and use the LDC for transportation.
The tariff will set the cost for transportation by the LDC.
In addition to the transportation costs, rate of return,
and other pipeline costs in the charge, in many tariffs a
provision includes any local taxes or fees made by local
governments for transporting natural gas.
The LDC or pipeline affi liate will only sell the com-
modity. The buyer might also have a choice of buying from
other marketers and can “shop” its purchase needs to get
the best package of prices, services, and other options.
The local distribution company would most likely be the
transporter for the customer. In some locations, this may
not be the case depending on the location of the buyer and