ENERGY MANAGEMENT HANDBOOKS phần 4 pptx
Bạn đang xem bản rút gọn của tài liệu. Xem và tải ngay bản đầy đủ của tài liệu tại đây (1.86 MB, 93 trang )
HVAC SYSTEMS 265
building service personnel. For example the controls on
a unit ventilator include a room temperature thermostat
which controls the valve on the heating or cooling coil,
a damper control which adjusts the proportion of fresh
air mixed with recirculated room air, and a low-limit
thermostat which prevents the temperature of outside
air from dropping below a preset temperature (usually
55 to 60°F; 13 to 16°C). A common error of occupants or
building custodians in response to a sense that the air
supplied by the unit ventilator is too cold is to increase
the setpoint on the low-limit thermostat, which prevents
free cooling from outside air or, on systems without a
cooling coil, prevents cooling altogether. Controls which
are subject to misadjustment by building occupants
should be placed so that they cannot be tampered
with.
The energy consumption of thermally heavy
buildings is less related to either the inside or outside
air temperature. Both the heating and cooling loads in
thermally heavy buildings are heavily dependent on
the heat generated from internal loads and the thermal
energy stored in the building mass which may be dis-
Figure 10.13 Wet-side economizer schematic diagram.
266 ENERGY MANAGEMENT HANDBOOK
sipated at a later time.
In an indirect control system the amount of energy
consumed is not a function of human thermal comfort
needs, but of other factors such as outdoor tempera-
ture, humidity, or enthalpy. Indirect control systems
determine the set points for cool air temperature, water
temperatures, etc. As a result indirect control systems
tend to adjust themselves for peak conditions rather
than actual conditions. This leads to overheating or
overcooling of spaces with less than peak loads.
One of the most serious threats to the effi ciency
of any system is the need to heat and cool air or water
simultaneously in order to achieve the thermal balance
required for adequate conditioning of spaces. Figure
10.14 indicates that 20 percent of the energy consumed
in a commercial building might be used to reheat cooled
air, offsetting another 6 percent that was used to cool the
air which was later reheated. For the example building
the energy used to cool reheated air approaches that
actually used for space cooling.
Following the 1973 oil embargo federal guidelines
encouraged everyone to reduce thermostat settings to
68°F (20°C) in winter and to increase thermostat settings
in air-conditioned buildings to 78°F (26°C) in summer.
[In 1979, the winter guideline was reduced farther to
65°F (18°C).] The effect of raising the air-conditioning
thermostat on a reheat, dual-duct, or multizone system
is actually to increase energy consumption by increas-
ing the energy required to reheat air which has been
mechanically cooled (typically to 55°F; 13°C).
To minimize energy consumption on these types
of systems it makes more sense to raise the discharge
temperature for the cold-deck to that required to cool pe-
rimeter areas to 78°F (26°C) under peak conditions. If the
system was designed to cool to 75°F (24°C) on a peak day
using 55°F (13°C) air, the cold deck discharge could be
increased to 58°F (14.5°C) to maintain space temperatures
at no more than 78°F (26°C), saving about $5 per cfm
per year. Under less-than-peak conditions these systems
would operate more effi ciently if room temperatures were
allowed to fall below 78°F (26°C) than to utilize reheated
air to maintain this temperature.
More extensive discussion of energy management
control systems may be found in Chapters 12 and 22.
10.5.7 HVAC Equipment
The elements which provide heating and cooling
to a building can be categorized by their intended func-
tion. HVAC equipment is typically classifi ed as heating
equipment, including boilers, furnaces and unit heaters;
cooling equipment, including chillers, cooling towers
and air-conditioning equipment; and air distribution
elements, primarily air-handling units (AHUs) and fans.
A more lengthy discussion of boilers may be found
in Chapter 6, followed by a discussion of steam and
condensate systems in Chapter 7. Cooling equipment is
discussed in section 10.6, below. What follows here re-
lates mostly to air-handling equipment and distribution
systems.
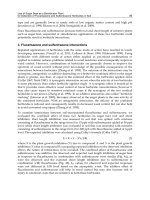
Figure 10.14 depicts the typical energy cost dis-
tribution for a large commercial building which em-
ploys an all-air reheat-type HVAC system. Excluding
the energy costs associated with lighting, kitchen and
miscellaneous loads which are typically 25-30 percent
of the total, the remaining energy can be divided into
two major categories: the energy associated with heat-
ing and cooling and the energy consumed in distribu-
tion. The total energy consumed for HVAC systems
is therefore dependent on the effi ciency of individual
components, the effi ciency of distribution and the ability
of the control system to accurately regulate the energy
consuming components of the system so that energy is
not wasted.
The size (and heating, cooling, or air-moving ca-
pacity) of HVAC equipment is determined by the me-
chanical designer based upon a calculation of the peak
internal and envelope loads. Since the peak conditions
are arbitrary (albeit well-considered and statistically
valid) and it is likely that peak loads will not occur
simultaneously throughout a large building or complex
Figure 10.14 Energy cost distribution for a typical
non-residential building using an all-air reheat HVAC
system.
Space
cooling
Other
(
magnitude
uncertain)
Kitchen
& process
Domestic
hot water
Cooling of reheat
Pumps
Fans
Lighting
Reheat
Space heating
HVAC SYSTEMS 267
requiring all equipment to operate at its rated capacity,
it is common to specify equipment which has a total
capacity slightly less than the peak requirement. This
diversity factor varies with the function of the space.
For example, a hospital or classroom building will use
a higher diversity multiplier than an offi ce building.
In sizing heating equipment however, it is not un-
common to provide a total heating capacity from several
units which exceeds the design heating load by as much
as fi fty percent. In this way it is assured that the heating
load can be met at any time, even in the event that one
unit fails to operate or is under repair.
The selection of several boilers, chillers, or air-
handling units whose capacities combine to provide
the required heating and cooling capability instead of
single large units allows one or more components of
the system to be cycled off when loads are less than the
maximum.
This technique also allows off-hours use of specifi c
spaces without conditioning an entire building.
Equipment Effi ciency
Effi ciency, by defi nition, is the ratio of the energy
output of a piece of equipment to its energy input, in
like units to produce a dimensionless ratio. Since no
equipment known can produce energy, effi ciency will
always be a value less than 1.0 (100%).
Heating equipment which utilizes electric resis-
tance appears at first glance to come closest to the
ideal of 100 percent effi ciency. In fact, every kilowatt of
electrical power consumed in a building is ultimately
converted to 3413 Btu per hour of heat energy. Since this
is a valid unit conversion it can be said that electric re-
sistance heating is 100 percent effi cient. What is missing
from the analysis however, is the ineffi ciency of produc-
ing electricity, which is most commonly generated using
heat energy as a primary energy source.
Electricity generation from heat is typically about
30 percent effi cient, meaning that only 30 percent of the
heat energy is converted into electricity, the rest being
dissipated as heat into the environment. Energy con-
sumed as part of the generation process and energy lost
in distribution use up about ten percent of this, leaving
only 27 percent of the original energy available for use
by the consumer. By comparison, state-of-the-art heating
equipment which utilizes natural gas as a fuel is more
than eighty percent effi cient. Distribution losses in natu-
ral gas pipelines account for another 5 percent, making
natural gas approximately three times as effi cient as a
heat energy source than electricity.
The relative efficiency of cooling equipment is
usually expressed as a coeffi cient of performance (COP),
which is defi ned as the ratio of the heat energy extracted
to the mechanical energy input in like units. Since the
heat energy extracted by modem air conditioning far
exceeds the mechanical energy input a COP of up to 6
is possible.
Air-conditioning equipment is also commonly
rated by its energy effi ciency ratio (EER) or seasonal en-
ergy effi ciency ratio (SEER). EER is defi ned as the ratio
of heat energy extracted (in Btu/hr) to the mechanical
energy input in watts. Although it should have dimen-
sions of Btu/hr/watt, it is expressed as a dimensionless
ratio and is therefore related to COP by the equation
EER = 3.41
• COP (10.4)
Although neither COP nor EER is the effi ciency
of a chiller or air-conditioner, both are measures which
allow the comparison of similar units. The term air-con-
ditioning effi ciency is commonly understood to indicate
the extent to which a given air-conditioner performs to
its maximum capacity. As discussed below, most equip-
ment does not operate at its peak effi ciency all of the
time. For this reason, the seasonal energy effi ciency ratio
(SEER), which takes varying effi ciency at partial load
into account, is a more accurate measure of air-condi-
tioning effi ciency than COP or EER.
In general, equipment effi ciency is a function of
size. Large equipment has a higher effi ciency than small
equipment of similar design. But the rated effi ciency of
this equipment does not tell the whole story. Equipment
effi ciency varies with the load imposed. All equipment
operates at its optimum effi ciency when operated at or
near its design full-load condition. Both overloading
and under-loading of equipment reduces equipment ef-
fi ciency.
This fact has its greatest impact on system effi cien-
cy when large systems are designed to air-condition an
entire building or a large segment of a major complex.
Since air-conditioning loads vary and since the design
heating and cooling loads occur only rarely under the
most severe weather or occupancy conditions, most of
the time the system must operate under-loaded. When
selected parts of a building are utilized for off-hours
operation this requires that the entire building be condi-
tioned or that the system operate far from its optimum
conditions and thus at far less than its optimum effi -
ciency.
Since most heating and cooling equipment oper-
ates at less than its full rated load during most of the
year, its part-load effi ciency is of great concern. Because
of this, most state-of-the-art equipment operates much
closer to its full-load effi ciency than does older equip-
268 ENERGY MANAGEMENT HANDBOOK
ment. A knowledge of the actual operating effi ciency of
existing equipment is important in recognizing econom-
ic opportunities to reduce energy consumption through
equipment replacement.
Distribution Energy
Distribution energy is most commonly electrical
energy consumed to operate fans and pumps, with fan
energy typically being far greater than pump energy ex-
cept in all-water distribution systems. The performance
of similar fans is related by three fan laws which relate
fan power, airfl ow, pressure and effi ciency to fan size,
speed and air density. The reader is referred to the
ASHRAE Handbook: HVAC Systems and Equipment for
additional information on fans and the application of
the fan laws.
3
Fan energy is a function of the quantity of airfl ow
moved by the fan, the distance over which it is moved,
and the velocity of the moving air (which infl uences
the pressure required of the fan). Most HVAC systems,
whether central or distributed packaged systems, all-
air, all-water, or a combination are typically oversized
for the thermal loads that actually occur. Thus the fan
is constantly required to move more air than necessary,
creating inherent system ineffi ciency.
One application of the third fan law describes
the relationship between fan horsepower (energy con-
sumed) and the airfl ow produced by the fan:
W
1
= W
2
× (Q
1
/Q
2
)
3
(10.5)
where
W = fan power required, hp
Q = volumetric fl ow rate, cfm
Because fan horsepower is proportional to the cube
of airfl ow, reducing airfl ow to 75 percent of existing
will result in a reduction in the fan horsepower by the
cube of 75 percent, or about 42 percent: [(0.75)
3
= 0.422]
Even small increases in airfl ow result in disproportional
increases in fan energy. A ten percent increase in airfl ow
requires 33 percent more horsepower [1.103 = 1.33],
which suggests that airfl ow supplied solely for ventila-
tion purposes should be kept to a minimum.
All-air systems which must move air over great
distances likewise require disproportionate increases in
energy as the second fan law defi nes the relationship
between fan horsepower [W] and pressure [p], which
may be considered roughly proportional to the length
of ducts connected to the fan:
W
1
= W
2
× (P
1
/P
1
)
3/2
(10.6)
The use of supply air at temperatures of less than
55°F (13°C) for primary cooling air permits the use of
smaller ducts and fans, reducing space requirements
at the same time. This technique requires a complex
analysis to determine the economic benefi t and is sel-
dom advantageous unless there is an economic benefi t
associated with space savings.
System Modifi cations
In examining HVAC systems for energy conser-
vation opportunities, the less effi cient a system is, the
greater is the potential for signifi cant conservation to
be achieved. There are therefore several “off-the-shelf”
opportunities for improving the energy efficiency of
selected systems.
All-air Systems—Virtually every type of all-air
system can benefi t from the addition of an economizer
cycle, particularly one with enthalpy controls. Systems
with substantial outside air requirements can also ben-
efi t from heat recovery systems which exchange heat
between exhaust air and incoming fresh air. This is a
practical retrofi t only when the inlet and exhaust ducts
are in close proximity to one another.
Single zone systems, which cannot provide suf-
ficient control for varying environmental conditions
within the area served can be converted to variable air
volume (VAV) systems by adding a VAV terminal and
thermostat for each new zone. In addition to improving
thermal comfort this will normally produce a substantial
saving in energy costs.
VAV systems which utilize fans with inlet vanes
to regulate the amount of air supplied can benefi t from
a change to variable speed or variable frequency fan
drives. Fan effi ciency drops off rapidly when inlet vanes
are used to reduce airfl ow.
In terminal reheat systems, all air is cooled to
the lowest temperature required to overcome the peak
cooling load. Modern “discriminating” control systems
which compare the temperature requirements in each
zone and cool the main airstream only to the tempera-
ture required by the zone with the greatest requirements
will reduce the energy consumed by these systems.
Reheat systems can also be converted to VAV systems
which moderate supply air volume instead of supply air
temperature, although this is a more expensive altera-
tion than changing controls.
Similarly, dual-duct and multizone systems can ben-
efi t from “smart” controls which reduce cooling require-
ments by increasing supply air temperatures. Hot-deck
temperature settings can be controlled so that the tem-
perature of warm supply air is just high enough to meet
HVAC SYSTEMS 269
design heating requirements with 100 percent hot-deck
supply air and adjusted down for all other conditions
until the hot-deck temperature is at room temperature
when outside temperatures exceed 75°F (24°C). Dual duct
terminal units can be modifi ed for VAV operation.
An economizer option for multizone systems is
the addition of a third “bypass” deck to the multizone
air-handling unit. This is not appropriate as a retrofi t
although an economizer can be utilized to provide cold-
deck air as a retrofi t.
All-water systems—Wet-side economizers are the
most attractive common energy conservation measure
appropriate to chilled water systems. Hot-water systems
benefi t most from the installation of self-contained ther-
mostat valves, to create heating zones in spaces formerly
operated as single-zone heating systems.
Air-water Induction—Induction systems are sel-
dom installed anymore but many still exist in older
buildings. The energy-effi ciency of induction systems
can be improved by the substitution of fan-powered
VAV terminals to replace the induction terminals.
10.6 COOLING EQUIPMENT
The most common process for producing cooling
is vapor-compression refrigeration, which essentially
moves heat from a controlled environment to a warmer,
uncontrolled environment through the evaporation of
a refrigerant which is driven through the refrigeration
cycle by a compressor.
Vapor compression refrigeration machines are
typically classified according to the method of op-
eration of the compressor. Small air-to-air units most
commonly employ a reciprocating or scroll compres-
sor, combined with an air-cooled condenser to form
a condensing unit. This is used in conjunction with a
direct-expansion (DX) evaporator coil placed within
the air-handling unit.
Cooling systems for large non-residential buildings
typically employ chilled water as the medium which
transfers heat from occupied spaces to the outdoors
through the use of chillers and cooling towers.
10.6.1 Chillers
The most common type of water chiller for large
buildings is the centrifugal chiller which employs a
centrifugal compressor to compress the refrigerant,
which extracts heat from a closed loop of water which is
pumped through coils in air-handling or terminal units
within the building. Heat is rejected from the condenser
into a second water loop and ultimately rejected to the
environment by a cooling tower.
The operating fl uid used in these chillers may be
either a CFC or HCFC type refrigerant. Many existing
centrifugal chillers use CFC-11 refrigerants, the manu-
facture and use of which is being eliminated under the
terms of the Montreal Protocol. New refrigerants HCFC-
123 and HCFC-134a are being used to replace the CFC
refrigerants but refrigerant modifications to existing
equipment will reduce the overall capacity of this equip-
ment by 15 to 25 percent.
Centrifugal chillers can be driven by open or
hermetic electric motors or by internal combustion
Table 10.1 Summary of HVAC System Modifi cations for Energy Conservation
System type Energy Conservation Opportunities
All-air systems (general): economizer
heat recovery
Single zone systems conversion to VAV
Variable air volume (VAV) systems replace fan inlet vane control with variable frequency drive fan
Reheat systems use of discriminating control systems
conversion to VAV
Constant volume dual-duct systems use of discriminating control systems
conversion to dual duct VAV
Multizone systems use of discriminating control systems
addition of by-pass deck*
All-water systems:
hydronic heating systems addition of thermostatic valves
chilled water systems wet-side economizer
Air-water induction systems replacement with fan-powered VAV terminals
*Requires replacement of air-handling unit
270 ENERGY MANAGEMENT HANDBOOK
engines or even by steam or gas turbines. Natural gas
engine-driven equipment sized from 50 to 800 tons of
refrigeration are available and in some cases are used to
replace older CFC-refrigerant centrifugal chillers. These
engine-driven chillers are viable when natural gas costs
are suffi ciently low. Part-load performance modulates
both engine speed and compressor speed to match the
load profi le, mainta ining close to the peak effi ciency
down to 50 percent of rated load. They can also use heat
recovery options to take advantage of the engine jacket
and exhaust heat.
Turbine-driven compressors are typically used on
very large equipment with capacities of 1200 tons or
more. The turbine may be used as part of a cogeneration
process but this is not required. (For a detailed discus-
sion of cogeneration, see Chapter 7.) If excess steam is
available, in industry or a large hospital, a steam turbine
can be used to drive the chiller. However the higher load
on the cooling tower due to the turbine condenser must
be considered in the economic analysis.
Small water chillers, up to about 200 tons of capac-
ity, may utilize reciprocating or screw compressors and
are typically air-cooled instead of using cooling towers.
An air-cooled chiller uses a single or multiple compres-
sors to operate a DX liquid cooler. Air-cooled chillers are
widely used in commercial and large-scale residential
buildings.
Other types of refrigeration systems include liquid
overfeed systems, fl ooded coil systems and multi-stage
systems. These systems are generally used in large indus-
trial or low-temperature applications.
10.6.2 Absorption Chillers
An alternative to vapor-compression refrigeration
is absorption refrigeration which uses heat energy to
drive a refrigerant cycle, extracting heat from a con-
trolled environment and rejecting it to the environment
(Figure 10.15). Thirty years ago absorption refrigeration
was known for its low coeffi cient of performance and
high maintenance requirements. Absorption chillers
used more energy than centrifugal chillers and were
economical only if driven by a source of waste heat.
Today, due primarily to the restriction on the use
of CFC and HCFC refrigerants, the absorption chiller
is making a comeback. Although new and improved, it
still uses heat energy to drive the refrigerant cycle and
typically uses aqueous lithium bromide to absorb the
refrigerant and water vapor in order to provide a higher
coeffi cient of performance.
The new absorption chillers can use steam as a
heat source or be direct-fi red. They can provide simul-
taneous heating and cooling which eliminates the need
for a boiler. They do not use CFC or HCFC refrigerants,
which may make them even more attractive in years
to come. Improved safety and controls and better COP
(even at part load) have propelled absorption refrigera-
tion back into the market.
In some cases, the most effective use of refrig-
eration equipment in a large central-plant scenario is
to have some of each type, comprising a hybrid plant.
From a mixture of centrifugal and absorption equip-
ment the operator can determine what equipment will
provide the lowest operating cost under different con-
Figure 10.15 Simplifi ed absorption cycle schematic diagram.
HVAC SYSTEMS 271
ditions. For example a hospital that utilizes steam year
round, but at reduced rates during summer, might use
the excess steam to run an absorption chiller or steam-
driven turbine centrifugal chiller to reduce its summer-
time electrical demand charges.
10.6.3 Chiller Performance
Most chillers are designed for peak load and then
operate at loads less than the peak most of the time.
Many chiller manufacturers provide data that identifi es
a chiller’s part-load performance as an aid to evaluat-
ing energy costs. Ideally a chiller operates at a desired
temperature difference (typically 45-55 degrees F; 25-30
degrees C) at a given fl ow rate to meet a given load.
As the load requirement increases or decreases, the
chiller will load or unload to meet the need. A reset
schedule that allows the chilled water temperature to
be adjusted to meet thermal building loads based on
enthalpy provides an ideal method of reducing energy
consumption.
Chillers should not be operated at less than 50 per-
cent of rated load if at all possible. This eliminates both
surging and the need for hot-gas bypass as well as the
potential that the chiller would operate at low effi ciency.
If there is a regular need to operate a large chiller at less
than one-half of the rated load it is economical to install
a small chiller to accommodate this load.
10.6.4 Thermal Storage
Thermal storage can be another effective way of
controlling electrical demand by using stored chilled
water or ice to offset peak loads during the peak de-
mand time. A good knowledge of the utility consump-
tion and/or load profi le is essential in determining the
applicability of thermal storage. See Chapter 19 for a
discussion of thermal storage systems.
10.6.5 Cooling Towers
Cooling towers use atmospheric air to cool the
water from a condenser or coil through evaporation. In
general there are three types of cooling tower, named for
the relationship between the fan-powered airfl ow and the
fl ow of water in the tower: counterfl ow induced draft,
crossfl ow induced draft and counterfl ow forced draft.
The use of variable-speed, two-speed or three-speed
fans is one way to optimize the control of the cooling
tower in order to reduce power consumption and provide
adequate water cooling capacity. As the required cooling
capacity increases or decreases the fans can be sequenced
to maintain the approach temperature difference. For
most air-conditioning systems this usually varies between
5 and 12 degrees F (3 to 7 degrees C).
When operated in the winter, the quantity of air
must be carefully controlled to the point where the
water spray is not allowed to freeze. In cold climates it
may be necessary to provide a heating element within
the tower to prevent freeze-ups. Although electric resis-
tance heaters can be used for this purpose it is far more
effi cient to utilize hot water or steam as a heat source if
available.
10.6.6 Wet-side Economizer
The use of “free-cooling” using the cooling tower
water to cool supply air or chilled water is referred to
as a wet-side economizer. The most common and effec-
tive way of interconnecting the cooling tower water to
the chilled water loop is through the use of a plate-and-
frame heat exchanger which offers a high heat transfer
rate and low pressure drop. This method isolates the
cooling tower water from the chilled water circuit main-
taining the integrity of the closed chilled water loop.
Another method is to use a separate circuit and pump
that allows cooling tower w ater to be circulated through
a coil located within an air-handling unit.
The introduction of cooling tower water, into
the chilled water system, through a so-called strainer
cycle, can create maintenance nightmares and should
be avoided. The water treatment program required for
chilled water is intensive due to the required cleanness
of the water in the chilled water loop.
10.6.7 Water treatment
A good water treatment program is essential to
the maintenance of an effi cient chilled water system.
Filtering the cooling tower water should be evaluated.
In some cases, depending on water quality, this can save
the user a great deal of money in chemicals. Pretreating
new system s prior to initial start-up will also provide
longer equipment life and insure proper system perfor-
mance.
Chiller performance is based on given design pa-
rameters and listed in literature provided by the chiller
manufacturer. The performance will vary with building
load, chilled water temperature, condenser water tem-
perature and fouling factor. The fouling factor is the re-
sistance caused by dirt, scale, silt, rust and other deposits
on the surface of the tubes in the chiller and signifi cantly
affects the overall heat transfer of the chiller.
10.7 DOMESTIC HOT WATER
The creation of domestic hot water (DHW) repre-
sents about 4 percent of the annual energy consumption
272 ENERGY MANAGEMENT HANDBOOK
in typical non-residential buildings. In buildings where
sleeping or food preparation occur, including hotels,
restaurants, and hospitals, DHW may account for as
much as thirty percent of total energy consumption.
Some older lavatory faucets provide a fl ow of 4 to 6
gal/min (0.25 to 0.38 l/s). Since hand washing is a func-
tion more of time than water use, substantial savings can
be achieved by reducing water fl ow. Reduced-fl ow fau-
cets which produce an adequate spray pattern can reduce
water consumption to less than 1 gal/min (0.06 l/s). Flow
reducing aerator replacements are also available.
Reducing DHW temperature has also been shown
to save energy in non-residential buildings. Since most
building users accept water at the available tempera-
ture, regardless of what it is, water temperature can be
reduced from the prevailing standard of 140°F (60°C)
to a 105°F (40°C) utilization temperature saving up to
one-half of the energy used to heat the water.
Many large non-commercial buildings employ re-
circulating DHW distribution systems in order to reduce
or eliminate the time required and water wasted in
fl ushing cold water from hot water piping. Recirculating
distribution is economically attractive only where DHW
use is high and/or the cost of water greatly exceeds the
cost of water heating. In most cases the energy required
to keep water in recirculating DHW systems hot exceeds
the energy used to heat the water actually used.
To overcome this waste of energy there is a trend
to convert recirculating DHW systems to localized point-
of-use hot water heating, particularly in buildings where
plumbing facilities are widely separated. In either case
insulation of DHW piping is essential in reducing the
waste of energy in distribution. One-inch of insulation
on DHW pipes will result in a 50% reduction in the
distribution heat loss.
One often-overlooked energy conservation oppor-
tunity associated with DHW is the use of solar-heated
hot water. Unlike space-heating, the need for DHW is
relatively constant throughout the year and peaks dur-
ing hours of sunshine in non-residential buildings. Year-
round use amortizes the cost of initial equipment faster
than other active-solar options.
Many of the techniques appropriate for reducing
energy waste in DHW systems are also appropriate for
energy consumption in heated service water systems for
industrial buildings or laboratories.
10.8 ESTIMATING HVAC
ENERGY CONSUMPTION
The methods for estimating building heating and
cooling loads and the consumption of energy by HVAC
systems are described in Chapter 9.
References
1. ASHRAE Handbook: Fundamentals, American Society of Heating,
Refrigerating and Air-Conditioning Engineers, Inc., Atlanta,
1993.
2. ASHRAE Handbook: HVAC Applications, American Society of Heat-
ing, Refrigerating and Air-Conditioning Engineers, Inc., Atlanta,
1995.
3. ASHRAE Handbook: HVAC Systems and Equipment, American So-
ciety of Heating, Refrigerating and Air-Conditioning Engineers,
Inc., Atlanta, 1992.
4. ASHRAE Handbook: Refrigeration, American Society of Heating,
Refrigerating and Air-Conditioning Engineers, Inc., Atlanta,
1 9 9 4 .
K.K. LOBODOVSKY
BSEE & BSME
Certifi ed Energy Auditor
State of California
11.1 INTRODUCTION
Effi cient use of electric energy enables commercial,
industrial and institutional facilities to minimize operat-
ing costs, and increase profi ts to stay competitive.
The majority of electrical energy in the United
States is used to run electric motor driven systems.
Generally, systems consist of several components, the
electrical power supply, the electric motor, the motor
control, and a mechanical transmission system.
There are several ways to improve the systems'
effi ciency. The cost effective way is to check each com-
ponent of the system for an opportunity to reduce elec-
trical losses. A qualifi ed individual should oversee the
electrical system since poor power distribution within a
facility is a common cause of energy losses.
Technology Update Ch. 18
1
lists 20 items to help
facility management staff identify opportunities to im-
prove drive system effi ciency.
1. Maintain Voltage Levels.
2. Minimize Phase Imbalance.
3. Maintain Power Factor.
4. Maintain Good Power Quality.
5. Select Effi cient Transformers.
6. Identify and Fix Distribution System Losses.
7. Minimize Distribution System Resistance.
8. Use Adjustable Speed Drives (ASDs) or 2-Speed
Motors Where Appropriate.
9. Consider Load Shedding.
10. Choose Replacement Before a Motor Fails.
11. Choose Energy-Effi cient Motors.
12. Match Motor Operating Speeds.
13. Size Motors for Effi ciency.
14. Choose 200 Volt Motors for 208 Volt Electrical Sys-
tems.
15. Minimize Rewind Losses.
16. Optimize Transmission Effi ciency.
17. Perform Periodic Checks.
18. Control Temperatures.
19. Lubricate Correctly.
20. Maintain Motor Records.
Some of these steps require the one-time involve-
ment of an electrical engineer or technician. Some
steps can be implemented when motors fail or major
capital changes are made in the facility. Others involve
development of a motor monitoring and maintenance
program.
11.2 POWER SUPPLY
Much of this information consists of standards
defi ned by the National Electrical Manufacturers As-
sociation (NEMA).
The power supply is one of the major factors affect-
ing selection, installation, operation, and maintenance
of an electrical motor driven system. Usual service con-
ditions, defi ned in NEMA Standard Publication MG1,
Motors and Generators,
2
include:
• Motors designed for rated voltage, frequency, and
number of phases.
• The supply voltage must be known to select the
proper motor.
• Motor nameplate voltage will normally be less
then nominal power system voltage.
Nominal Motor Utilization
Power System (Nameplate) Voltage
Voltage (Volts) Volts
——————— ——————————
208 200
240 230
480 460
600 575
2400 2300
4160 4000
6900 6600
13800 13200
• Operation within tolerance of ±10 percent of the
rated voltage.
CHAPTER 11
E LECTRIC ENERGY MANAGEMENT
273
274 ENERGY MANAGEMENT HANDBOOK
• Operation from a sine wave of voltage source (not
to exceed 10 percent deviation factor).
• Operation within a tolerance of ±5 percent of rated
frequency.
• Operation within a voltage unbalance of 1 percent
or less.
Operation at other than usual service conditions may result
in the consumption of additional energy.
11.3 EFFECTS OF UNBALANCED VOLTAGES ON
THE PERFORMANCE OF POLYPHASE
SQUIRREL-CAGE INDUCTION MOTORS
(MG 1-20.56)
When the line voltages applied to a polyphase
induction motor are not equal, unbalanced currents in
the stator windings result. A small percentage of volt-
age unbalance results in a much larger percentage cur-
rent unbalance. Consequently, the temperature rise of
the motor operating at a particular load and percentage
voltage unbalance will be greater than for the motor
operating under the same conditions with balanced
voltages.
Voltages should be evenly balanced as closely as
they can be read on a voltmeter. If the voltages are
unbalanced, the rated horsepower of polyphase squir-
rel-cage induction motors should be multiplied by the
factor shown in Figure 11.1 to reduce the possibility
of damage to the motor. Operation of the motor with
more than a 5-percent voltage unbalance is not recom-
mended.
When the derating curve of Figure 11.1 is applied
for operation on balanced voltages, the selection and
setting of the overload device should take into ac-
count the combination of the derating factor applied
to the motor and the increase in current resulting from
the unbalanced voltages. This is a complex problem
involving the variation in motor current as a func-
tion of load and voltage unbalance in the addition to
the characteristics of the overload device relative to
I
MAXIMUM
or I
AVERAGE
. In the absence of specifi c in-
formation it is recommended that overload devices be
selected and/or adjusted at the minimum value that
does not result in tripping for the derating factor and
voltage unbalance that applies. When the unbalanced
voltages are unanticipated, it is recommended that the
overload devices be selected so as to be responsive to
I
MAXIMUM
in preference to overload devices respon-
sive to I
AVERAGE
.
11.4 EFFECT ON PERFORMANCE—
GENERAL (MG 1 20.56.1)
The effect of unbalanced voltages on polyphase
induction motors is equivalent to the introduction of a
“ negative-sequence voltage” having a rotation opposite
to that occurring the balanced voltages. This negative-se-
quence voltage produces an air gap fl ux rotating against
the rotation of the rotor, tending to produce high cur-
rents. A small negative-sequence voltage may produce
current in the windings considerably in excess of those
present under balanced voltage conditions.
11.4.1 Unbalanced Defi ned (MG 1 20.56.2)
The voltage unbalance in percent may be defi ned
as follows:
Percent
Voltage
Unbalance
= 100 ×
Maximum voltage deviation
from average voltage
average voltage
Example—With voltages of 220, 215 and 210, the average
is 215, the maximum deviation from the average is 5
PERCENT VOLTAGE UNBALANCE
= 100 * 5/215 = 2.3 PERCENT
11.4.2 Torque (MG 1 20.56.3)
The locked-rotor torque and breakdown torque are
decreased when the voltage is unbalanced. If the voltage
unbalance is extremely severe, the torque might not be
adequate for the application.
11.4.3 Full-Load Speed (MG 1 20.56.4)
The full-load speed is reduced slightly when the
motor operates at unbalanced voltages.
11.4.4 Currents (MG 1 20.56.5)
The locked-rotor current will be unbalanced but
the locked rotor kVA will increase only slightly.
Figure 11.1 Polyphase squirrel-cage induction motors
derating factor due to unbalanced voltage.
ELECTRIC ENERGY MANAGEMENT 275
The currents at normal operating speed with
unbalanced voltages will be greatly unbalanced in the
order of 6 to 10 times the voltage unbalance.
11.5 MOTOR
The origin of the electric motor can be traced back
to 1831 when Michael Faraday demonstrated the fun-
damental principles of electromagnetism. The purpose
of an electric motor is to convert electrical energy into
mechanical energy.
Electric motors are effi cient at converting electric
energy into mechanical energy. If the effi ciency of an
electric motor is 80%, it means that 80% of electrical
energy delivered to the motor is directly converted to
mechanical energy. The portion used by the motor is
the difference between the electrical energy input and
mechanical energy output.
A major manufacturer estimates that US annual
sales exceed 2 million motors. Table 11.1 lists sales vol-
ume by motor horsepower. Only 15% of these sales
involve high-effi ciency motors.
3
Table 11.1 Polyphase induction motors annual sales
volume.
hp Units
———— —————
1-5 1,300,000
7.5-20 500,000
25-50 140,000
60-100 40,000
125-200 32,000
250-500 11,000
———— ————
Total 2,023,000
Motor terms are used quite frequently, usually on
the assumption that every one knows what they mean
or imply. Such is far too often not the case. The follow-
ing section is a list of motor terms.
11.6 GLOSSARY OF FREQUENTLY
OCCURRING MOTOR TERMS
4
Amps
Full Load Amps
The amount of current the motor can be expected
to draw under full load (torque) conditions is called Full
Load Amps. It is also known as nameplate amps.
Locked Rotor Amps
Also known as starting inrush, this is the amount of
current the motor can be expected to draw under starting
conditions when full voltage is applied.
Service Factor Amps
This is the amount of current the motor will draw
when it is subjected to a percentage of overload equal
to the service factor on the nameplate of the motor. For
example, many motors will have a service factor of 1.15,
meaning that the motor can handle a 15% overload. The
service factor amperage is the amount of current that the
motor will draw under the service factor load condition.
Code Letter
The code letter is an indication of the amount of
inrush current or locked rotor current that is required by
a motor when it is started. Motor code letters usually ap-
plied to ratings of motors normally started on full voltage
(chart below).
Code letter Locked rotor* Horsepower Horsepower
kVA per Single-phase Three-phase
horsepower
———————————————————————————————————
F 5.0 to 5.6 15 up
G 5.6 to 6.3 5 7.5 to 10
H 6.3 to 7.1 3 5
J 7.1 to 8.0 1.5 to 2 3
K 8.0 to 9.0 0.75 to 1.00 1.5 to 2
L 9.0 to 10.0 0.5 1
———————————————————————————————————
*Locked rotor kVA is equal to the product of the line voltage times motor current divided by 1,000
when the motor is not allowed to rotate; this corresponds to the fi rst power surge required to start
the motor. Locked-rotor kVA per horsepower range includes the lower fi gure up to but not including
the higher fi gure.
276 ENERGY MANAGEMENT HANDBOOK
Design
The design letter is an indication of the shape of the
torque speed curve. Figure 11.2 shows the typical shape
of the most commonly used design letters. They are A,
B, C, and D. Design B is the standard industrial duty mo-
tor which has reasonable starting torque with moderate
starting current and good overall performance for most
industrial applications. Design C is used for hard to start
loads and is specifi cally designed to have high starting
torque. Design D is the so-called high slip motor which
tends to have very high starting torque but has high slip
RPM at full load torque. In some respects, this motor
can be said to have a ‘spongy’ characteristic when loads
are changing. Design D motors particularly suited for
low speed punch press, hoist and elevator applications.
Generally, the effi ciency of Design D motors at full load
is rather poor and thus they are normally used on those
applications where the torque characteristics are of pri-
mary importance. Design A motors are not commonly
specifi ed but specialized motors used on injection mold-
ing applications have characteristics similar to Design
B. The most important characteristic of Design A is the
high pull out torque.
Figure 11.2
Effi ciency
Effi ciency is the percentage of the input power that
is actually converted to work output from the motor
shaft. Effi ciency is now being stamped on the nameplate
of most domestically produced electric motors. See the
section 11.14.
746 × HP Output
Effi ciency = EFF = ————————
Watts Input
Frame Size
Motors, like suits of clothes, shoes and hats, come
in various sizes to match the requirements of the ap-
plications. In general, the frame size gets larger with
increasing horsepower or with decreasing speeds. In
order to promote standardization in the motor industry,
NEMA (National Electrical Manufacturers Association)
prescribes standard frame sizes for certain horsepower,
speed, and enclosure combinations. Frame size pins
down the mounting and shaft dimension of standard mo-
tors. For example, a motor with a frame size of 56, will al-
ways have a shaft height above the base of 3- 1/2 inches.
Frequency
This is the frequency for which the motor is de-
signed. The most commonly occurring frequency in this
country is 60 cycles but, internationally, other frequencies
such as 25, 40, and 50 cycles can be found.
Full Load Speed
An indication of the approximate speed that the mo-
tor will run when it is putting out full rated output torque
or horsepower is called full load speed.
High Inertia Load
These are loads that have a relatively high fl y wheel
effect. Large fans, blowers, punch presses, centrifuges,
industrial washing machines, and other similar loads can
be classifi ed as high inertia loads.
Insulation Class
The insulation class is a measure of the resistance
of the insulating components of a motor to degradation
from heat. Four major classifi cations of insulation are
used in motors. They are, in order of increasing thermal
capabilities, A, B, F, and H.
Class of Insulation System Temperature, Degrees C
—————————— ——————————
A 75
B 905
F 115
H 130
—————————————————————————
ELECTRIC ENERGY MANAGEMENT 277
Phase
Phase is the indication of the type of power supply
for which the motor is designed. Two major categories
exist: single phase and three phase. There are some very
spotty areas where two phase power is available but this
is very insignifi cant.
Poles
This is the number of magnetic poles within the
motor when power is applied. Poles are always an even
number such as 2, 4, 6. In an AC motor, the number of
poles work in conjunction with the frequency to deter-
mine the synchronous speed of the motor. At 50 and 60
cycles, common arrangements are:
Synchronous speed
—————————————————————————
Poles 60 Cycles 50 Cycles
—————————————————————————
2 3600 3000
4 1800 1500
6 1200 1000
8 900 750
10 720 600
—————————————————————————
Power Factor
Percent power factor is a measure of a particular
motor’s requirements for magnetizing amperage. For
more information se section 11.7.
Power Factor Watts Input
(3 phase) = pf = —————————
Volts × Amps × 1.73
Service Factor
The service factor is a multiplier that indicates the
amount of overload a motor can be expected to handle.
For example, a motor with a 1.0 service factor cannot be
Load Types
Constant Horsepower
The term constant horsepower is used in certain
types of loads where the torque requirement is reduced as
the speed is increased and vice-versa. The constant horse-
power load is usually associated with metal removal ap-
plications such as drill presses, lathes, milling machines,
and similar types of applications.
Constant Torque
Constant torque is a term used to defi ne a load char-
acteristic where the amount of torque required to drive
the machine is constant regardless of the speed at which
it is driven. For example, the torque requirement of most
conveyors is constant.
Variable Torque
Variable torque is found in loads having character-
istics requiring low torque at low speeds and increasing
values of torque required as the speed is increased. Typi-
cally examples of variable torque loads are centrifugal
fans and centrifugal pumps.
278 ENERGY MANAGEMENT HANDBOOK
expected to handle more than its nameplate horsepower
on a continuous basis. Similarly, a motor with a 1.15 ser-
vice factor can be expected to safely handle intermittent
loads amounting to 15% beyond its nameplate horse-
power.
Slip
Slip is used in two forms. One is the slip RPM which
is the difference between the synchronous speed and the
full load speed. When this slip RPM is expressed as a per-
centage of the synchronous speed, then it is called percent
slip or just ‘slip.’ Most standard motors run with a full
loadslip of 2% to 5%.
Synchronous Speed
This is the speed at which the magnetic fi eld within
the motor is rotating. It is also approximately the speed
that the motor will run under no load condition. For ex-
ample, a 4 pole motor running in 60 cycles would have a
magnetic fi eld speed of 1800 RPM. The no load speed of
that motor shaft would be very close to 1800, probably
1798 or 1799 RPM. The full load speed of the same motor
might be 1745 RPM. The difference between the synchro-
nous speed of the full load speed is called the slip RPM of
the motor.
Temperature
Ambient Temperature.
Ambient temperature is the maximum safe room
temperature surrounding the motor if it is going to be
operated continuously at full load. In most cases, the
standardized ambient temperature rating is 40°C (104°F).
This is a very warm room. Certain types of applications
such as on board ships and in boiler rooms, may require
motors with a higher ambient temperature capability
such as 50°C or 60°C.
Temperature Rise.
Temperature rise is the amount of temperature
change that can be expected within the winding of the
motor from non-operating (cool condition) to its tem-
perature at full load continuous operating condition.
Temperature rise is normally expressed in degrees centi-
grade.
Time Rating
Most motors are rated in continuous duty which
means that they can operate at full load torque continu-
ously without overheating. Motors used on certain types
of applications such as waste disposal, valve actuators,
hoists, and other types of intermittent loads, will fre-
quently be rated in short term duty such as 5 minutes, 15
minutes, 30 minutes or 1 hour. Just like a human being,
a motor can be asked to handle very strenuous work as
long as it is not required on a continuous basis.
Torque
Torque is the twisting force exerted by the shaft or a
motor. Torque is measured in inch pounds, foot pounds,
and on small motors, in terms of inch ounces.
Full Load Torque
Full load torque is the rated continuous torque that
the motor can support without overheating within its
time rating.
Peak Torque
Many types of loads such as reciprocating compres-
sors have cycling torque where the amount of torque re-
quired varies depending on the position of the machine.
The actual maximum torque requirement at any point is
called the peak torque requirement. Peak torque are in-
volved in things such as punch presses and other types of
loads where an oscillating torque requirement occurs.
Pull Out Torque
Also known as breakdown torque, this is the maxi-
mum amount of torque that is available from the motor
shaft when the motor is operating at full voltage and is
running at full speed. The load is then increased until the
maximum point is reached. Refer to Figure 11.3.
Pull Up Torque
The lowest point on the torque speed curve for a
motor accelerating a load up to full speed is called pull up
torque. Some motors are designed to not have a value of
pull up torque because the lowest point may occur at the
locked rotor point. In this case, pull up torque is the same
as locked rotor torque.
Figure 11.3 Typical speed—torque curve.
ELECTRIC ENERGY MANAGEMENT 279
Starting Torque
The amount of torque the motor produces when it
is energized at full voltage and with the shaft locked in
place is called starting torque. This value is also frequent-
ly expressed as ‘Locked Rotor Torque.’ It is the amount of
torque available when power is applied to break the load
away and start accelerating it up to speed.
Voltage
This would be the voltage rating for which the mo-
tor is designed. Section 11.2.
11.7 POWER FACTOR
WHAT IS POWER FACTOR (pf)?
It is the mathematical ratio of ACTIVE POWER () to
APPARENT POWER (VA)
Active power
pf = —————————— = W = Cos θ
Apparent power
pf angle in degrees = cos
–1
θ
ACTIVE POWER = W = “real power” = supplied by the
power system to actually turn the motor.
REACTIVE POWER = VA R = (W)tan θ = is used strictly
to develop a magnetic fi eld within the motor.
or (VA)
2
= (W)
2
+ (VAR)
2
NOTE: Power factor may be “leading” or “lagging”
depending on the direction of VAR fl ow.
CAPACITORS can be used to improve the power
factor of a circuit with a large inductive load. Current
through capacitor LEADS the applied voltage by 90 elec-
trical degrees (VAC), and has the effect of “opposing”
the inductive “LAGGING” current on a “one-for-one”
(VAR) basis.
WHY RAISE POWER FACTOR (pf)?
Low (or “unsatisfactory”) power factor is caused
by the use of inductive (magnetic) devices and can in-
dicate possible low system electrical operating effi ciency.
These devices are:
• non-power factor corrected fl uorescent and high
intensity discharge lighting fi xture ballasts (40%-
80% pf)
• arc welders (50%-70% pf)
• solenoids (20%-50% pf)
• induction heating equipment (60%-90% pf)
• lifting magnets (20%-50% pf)
• small “dry-pack” transformers (30%-95% pf)
• and most signifi cantly, induction motors (55%-90%
pf)
Induction motors are generally the principal cause
of low power factor because there are so many in use,
and they are usually not fully loaded. The correction of
the condition of LOW power factor is a problem of vital
economic importance in the generation, distribution and
utilization of a-c power.
MAJOR BENEFITS OF
POWER FACTOR IMPROVEMENT ARE:
• increased plant capacity,
• reduced power factor “penalty” charges for the
electric utility,
• improvement of voltage supply,
• less power losses in feeders, transformers and dis-
tribution equipment.
WHERE TO CORRECT POWER FACTOR?
Capacitor correction is relatively inexpensive both
in material and installation costs. Capacitors can be
installed at any point in the electrical system, and will
improve the power factor between the point of applica-
tion and the power source. However, the power factor
between the utilization equipment and the capacitor will
remain unchanged. Capacitors are usually added at each
piece of offending equipment, ahead of groups of small
motors (ahead of motor control centers or distribution
panels) or at main services. Refer to the National Electri-
cal Code for installation requirements.
280 ENERGY MANAGEMENT HANDBOOK
The advantages and disadvantages of each type of
capacitor installation are listed below:
Capacitor on each piece of equipment (1,2)
ADVANTAGES
• increases load capabilities of distribution system.
• can be switched with equipment; no additional
switching is required.
• better voltage regulation because capacitor use fol-
lows load.
• capacitor sizing is simplifi ed
• capacitors are coupled with equipment and move
with equipment if rearrangements are instituted.
DISADVANTAGES
• small capacitors cost more per KVAC than larger
units (economic break point for individual correc-
tion is generally at 10 HP).
Capacitor with equipment group (3)
ADVANTAGES
• increased load capabilities of the service,
• reduced material costs relative to individual cor-
rection
• reduced installation costs relative to individual
correction
DISADVANTAGES
• switching means may be required to control
amount of capacitance used.
Capacitor at main service (4,5, & 6)
ADVANTAGES
• low material installation costs.
DISADVANTAGES
• switching will usually be required to control the
amount of capacitance used.
• does not improve the load capabilities of the dis-
tribution system.
OTHER CONSIDERATIONS
Where the loads contributing to power factor are
relatively constant, and system load capabilities are not
a factor, correcting at the main service could provide a
cost advantage. When the low power factor is derived
from a few selected pieces of equipment, individual
equipment correction would be cost effective. Most ca-
pacitors used for power factor correction have built-in
fusing; if not, fusing must be provided.
The growing use of ASDs (nonlinear loads) has
increased the complexity of system power factor and its
corrections. The application of pf correction capacitors
without a thorough analysis of the system can aggravate
rather than correct the problem, particularly if the fi fth
and seventh harmonics are present.
POWER QUALITY REQUIREMENTS
6
The electronic circuits used in ASDs may be sus-
ceptible to power quality related problems if care is not
taken during application, specifi cation and installation.
The most common problems include transient over-
voltages, voltage sags and harmonic distortion. These
power quality problems are usually manifested in the
form of nuisance tripping.
TRANSIENT OVERVOLTAGES—Capacitors are
devices used in the utility power system to provide
power factor correction and voltage stability during
periods of heavy loading. Customers may also use ca-
pacitors for power factor correction within their facility.
When capacitors are energized, a large transient over-
voltage may develop causing the ASD to trip.
VOLTAGE SAGS—ASDs are very sensitive to tem-
porary reductions in nominal voltage. Typically, voltage
sags are caused by faults on either the customer’s or the
ELECTRIC ENERGY MANAGEMENT 281
utility's electrical system.
HARMONIC DISTORTION—ASDs introduce har-
monics into the power system due to nonlinear charac-
teristics of power electronics operation. Harmonics are
components of current and voltage that are multiples of
the normal 60Hz ac sine wave. ASDs produce harmon-
electrical system. Typical part-load effi ciency and power
factor characteristics are shown in Figure 11.4.
POWER SURVEY
Power surveys are conducted to compile mean-
ingful records of energy usage at the service entrance,
feeders and individuals loads. These records can be
analyzed to prioritize those areas yielding the greatest
energy savings. Power surveys also provide information
for load scheduling to reduce peak demand and show
operational characteristics of loads that may suggest
component or system replacement to reduce energy
consumption. Only through the measurement of AC
power parameters can true cost benefi t analysis be per-
formed.
7
ics which, if severe, can cause motor, transformer and
conductor overheating, capacitor failures, misoperation
of relays and controls and reduce system effi ciencies.
Compliance with IEEE-519 “Recommended Prac-
tices and Requirements for Harmonic Control in Electri-
cal Power Systems” is strongly recommended.
11.9 ELECTRIC MOTOR OPERATING LOADS
Most electric motors are designed to operate at
50 to 100 percent of their rated load. One reason is the
motors optimum effi ciency is generally 75 percent of the
rated load, and the other reason is motors are generally
sized for the starting requirements.
Several surveys of installed motors reveal that
large portion of motors in use are improperly loaded.
Underloaded motors, those loaded below 50 percent of
rated load, operate ineffi ciently and exhibit low power
factor. Low power factor increases losses in electrical
distribution and utilization equipment, such as wiring,
motors, and transformers, and reduces the load-han-
dling capability and voltage regulation of the building’s
11.8 HANDY ELECTRICAL FORMULAS & RULES OF THUMB
Conversion formulas
Rules of thumb.
At 3600 RPM, a motor develops 1.5 lb ft. per HP.
At 1800 RPM, a motor develops 3 lb ft. per HP.
At 1200 RPM, a motor develops 4.5 lb ft. per HP.
At 550 & 575 Volts, a 3 phase motor draws 1 amp per HP.
At 440 & 460 Volts, a 3 phase motor draws 1.25 amp per HP.
At 220 & 230 Volts, a 3 phase motor draws 2.5 amp per HP.
282 ENERGY MANAGEMENT HANDBOOK
11.10 DETERMINING ELECTRIC
MOTOR OPERATING LOADS
Determining if electric motors are properly loaded
enables a manager to make informed decisions about
when to replace them and which replacement to choose.
There are several ways to determine motor loads. The
best and the simplest way is by direct electrical mea-
surement using a Power Meter. Slip Measurement or
Amperage Readings methods can be used to estimate
the actual load.
11.11 POWER METER
To understand the electrical power usage of a
facility, load or device, measurements must be taken
over a time span to have a profi le of the unit’s opera-
tion. Digital power multimeters, measure Amps, Volts,
kWatts, kVars, kVA, Power Factor, Phase Angle and
Firing Angle. The GENERAL TEST FORM Figure 11.5
provides a format for documentation with correspond-
ing connection diagrams for various power circuit
confi gurations.
Such measurements should only be
performed by trained personnel
Selection of Equipment for Power
Measurement or Surveys
When choosing equipment to conduct a power
survey, many presentation formats are available includ-
ing indicating instruments, strip chart recorders and
digital devices with numeric printout. For most survey
applications, changing loads makes it mandatory for
data to be compiled over a period of time. This period
may be an hour, day, week or month. Since it is not
practical to write down varying readings from an indi-
cating device for a long period of time, a chart recorder
or digital device with numeric printout is preferred. If
loads vary frequently, an analog trend recording will be
easier to analyze than trying to interpret several numeric
reports. Digital power survey monitors are typically less
expensive than analog recordings systems. Complete
microprocessor based power survey systems capable of
measuring watts, VARs, kVA, power factor, watt hours,
VAR hours and demand including current transformers
are available for under $3000. With prices for memory
and computers going down, digital devices interfaced
to disk or cassette storage will provide a cost effective
method for system analysis.
7
Loads
When analyzing polyphase motors, it is important
to make measurements with equipment suited for the
application. Watt measurements or VAR measurements
should be taken with a two element device. Power factor
should be determined from the readings of both mea-
surements. When variable speed drives are encountered,
it is always preferable to take measurements on the line
side of the controller. When measurements are required
on the load side of the controller, the instrument specifi -
cations should be reviewed and if there is a question on
the application the manufacturer should be contacted.
7
11.12 SLIP MEASUREMENT
Conditions
1. Applied voltage must be within 5% of nameplate
rating.
2. Should not be used on rewound motors.
Figure 11.4 Typical part-load effi ciency and power factor characteristics
ELECTRIC ENERGY MANAGEMENT 283
Figure 11.5 General test form (for use with power meter).
TO MEASURE 1 Phase, 2 Wire 1 Phase, 3 Wire 3 Phase, 3 Wire 3 Phase, 4 Wire 3 Phase, 4 Wire TAP
L - 1 to N L - 1 to N A to B Phase A Phase to N B Phase to N
VOLTAGE L - 2 to N C to B Phase B Phase to N A Phase to N
(V) C Phase to N C Phase to N
L - 1 L - 1 A Phase A Phase B Phase
CURRENT L - 2 C Phase B Phase A Phase
(A) C Phase C Phase
L - 1 to N L - 1 to N A Phase to N
POWER L - 2 to N B Phase to N
(kW) C Phase to N
Total kW Total kW Total kW Total kW
L - 1 to N L - 1 to N A Phase to N
VOLT-AMPERES L - 2 to N B Phase to N
REACTIVE C Phase to N
(kVAR) Total kVAR Total kVAR Total kVAR Total kVAR
L - 1 to N L - 1 to N A Phase to N
VOLT-AMPERES L - 2 to N B Phase to N
(kVA) C Phase to N
Total kVA Total kVA Total kVA Total kVA
L - 1 to N L - 1 to N A Phase to N
POWER FACTOR L - 2 to N B Phase to N
PF % C Phase to N
Combined PF % Combined PF % Combined PF % Total PF %
SOURCE SOURCE SOURCE SOURCE SOURCE
L1 N L1 N L2 L1 L2 L3 L1 L2 L3 N L1 TAP L2 L3
RD
WE
RD
RD
WE
BE
BE
RD
BK
RD
WE
BE
BE
RD
BK
RD
BE
WE
BE
RD
BK
BK
RD
WE
BE
BE
RD
BK
BK
BK
VOLTAGE LEAD
CURRENT
TRANSFORMER
with white lead
towards load
RE = RED
BE = BLUE
BK = BLACK
WE = WHITE
LOAD LOAD
LOAD
LOAD LOAD
284 ENERGY MANAGEMENT HANDBOOK
3. Motors should be operating under steady load
conditions.
4. Should be performed by trained personnel.
Note: Values used in this analysis are subject to round-
ing errors. For example, full load speed often rounded
to the nearest 5 RPM.
Procedure
1. Read and record the motors nameplate Full Load
Speed. (RPM)
2. Determine Synchronous speed No Load Speed
(RPM) (900, 1200, 1800, 3600)
3. Measure and record Operating Load Speed with
tachometer. (RPM)
4. Insert the recorded values in the following formula
and solve.
NLS – OLS
(% Motor load) = ——————— × 100
NLS – FLS
Where:
NLS = No load or synchronous speed
OLS = Operating load speed
FLS = Full load speed
Example:
Consider a 100 HP, 1800 RM Motor
FLS = 1775 RPM, OLS = 1786 RPM
1800– 1786
(% Motor load) = ——————— × 100 = 56
1800 – 1775
Approximate load on motor = 100 HP × 0.56 = 56 HP
11.13 AMPERAGE READINGS
4
Conditions
1. Applied voltage must be within 5% of nameplate
rating.
2. You must be able to disconnect the motor from
the load. (By removing V-belts or disconnecting a
coupling).
3. Motor must be 7-1/2 HP or larger, 3450, 1725 or
1140 RPM.
4. The indicated line amperage must be below the full
load nameplate rating.
Procedure
1. Measure and record line amperage with load con-
nected and running.
2. Disconnect motor from load. Measure and record
the line amperage when the motor is running with-
out load.
3. Read and record the motors nameplate amperage
for the voltage being used.
4. Insert the recorded values in the following formula
and solve.
(2 × LLA) – NLA
(% Rated HP) = ———————— × 100
(2 × NPA) – NLA
Where:
LLA = Loaded Line Amps
NLA = No Load Line Amps (Motor
disconnected from load)
NPA = Nameplate Amperage (For
operating voltage)
Please note: This procedure will generally yield reason-
ably accurate results when motor load is in the 40 to
100% range and deteriorating results at loads below
40%.
Example:
• A 20 HP motor driving a pump is operating on 460
volts and has a loaded line amperage of 16.5.
• When the coupling is disconnected and the motor
operated at no load the amperage is 9.3.
• The motor nameplate amperage for 460 volts is
24.0.
Therefore we have:
Loaded Line Amps LLA = 16.5
No Load Amps NLA = 9.3
Nameplate Amps NPA = 24.0
(
2 × 16.5) – 9.3 23.7
(%Rated HP) = —————— × 100 = —— × 100 = 61.2%
(2 × 24.0) – 9.3 38.7
Approximate load on motor = 20 HP × 0.612 = 12.24
or slightly over 12 HP
11.14 ELECTRIC MOTOR EFFICIENCY
The effi ciency of a motor is the ratio of the me-
chanical power output to the electrical power input. It
may be expressed as:
ELECTRIC ENERGY MANAGEMENT 285
Output Input – Losses Output
Effi ciency = ——— = —————— = ———————
Input Input Output + Losses
Design changes, better materials, and manufac-
turing improvements reduce motor losses, making
premium or energy-effi cient motors more effi cient than
standard motors. Reduced losses mean that an energy-
effi cient motor produces a given amount of work with
less energy input than a standard motor.
3
In 1989, the National Electrical Manufacturers As-
sociation (NEMA) developed a standard defi nition for
energy-effi cient motors.
2
How should we interpret effi ciency labels?
Effi ciencies and Different Standards
—————————————————————————
Standard 7.5 HP motor 20 HP motor
—————————————————————————
International (IEC 34-2) 82.3% 89 4%
British (BS-269) 82.3% 89.4%
Japanese (IEC-37) 85.0% 90.4%
U.S. (IEEE -112 Method B)* 80.3% 86.9%
—————————————————————————
The critical part of the effi ciency comparison cal-
culations is that the effi ciencies used must be compa-
rable.
The Arthur D Little report contained the following
interesting statement: “Reliable and consistent data on
motor effi ciency is not available to motor appliers. Data
published by manufacturers appears to range from very
conservative to cavalier.”
Recognizing that less than a 10 percent spread in
losses is statistically insignifi cant NEMA has set up ef-
fi ciency bands. Any motor tested by IEEE - 112, Method
B, will carry the nominal effi ciency of the highest band
for which the average full load effi ciency for the model
is equal to or above that nominal.
The NEMA nominal effi ciency is defi ned as the
average effi ciency of a large population of motors of the
same design. The spread between nominal effi ciency in
the table based on increments of 10 percent losses. The
spread between the nominal effi ciency and the associ-
ated minimum is based on an increment of 20 percent
losses.
11.14.1 The Following is Reprinted
From NEMA MG 1-1987
Effi ciency (MG 1-12.54)
Determination of Motor Effi ciency and
Losses (MG 1-12.54.1)
Effi ciency and losses shall be determined in ac-
cordance with IEEE Std 112 Standard Test Procedures
for Polyphase Induction Motors and Generators*. The
effi ciency shall be determined at rated output, voltage,
and frequency.
Unless otherwise specifi ed, horizontal polyphase
squirrel-cage medium motors rated 1 to 125 horsepower
shall be tested by dynamometer (Method B) as described
in par. 5.2.2.4 of IEEE Std 112. Motor effi ciency shall be
calculated using MG 1-12.57 in lieu of Form E of IEEE
Std 112. Vertical motors in this horsepower range shall
also be tested by Method B if bearing construction per-
mits; otherwise they shall be tested by segregated losses
(Method E) as described in par. 5.2.3.1 of IEEE Std 112,
including direct measurement of stray-load loss.
The following losses shall be included in determin-
ing the effi ciency:
1. Stator I
2
R.
2. Rotor I
2
R.
3. Core Loss.
4. Stray load loss.
5. Friction & windage loss.
†
6. Brush contact loss of wound-rotor machines
Power required for auxiliary items, such as exter-
nal pumps or fans, that are necessary for the operation
of the motor shall be stated separately.
In determining I
2
R losses, the resistance of each
winding shall be corrected in a temperature equal to an
*See Referenced Standards, MG 1-1.01
†In the case of motors which are furnished with thrust bearings, only
that portion of the thrust bearing loss produced by the motor itself
shall be included in the effi ciency calculation. Alternatively, a calcu-
lated value of effi ciency, including bearing loss due to external thrust
load, shall be permitted to be specifi ed.
In the case of motors which are furnished with less than a full set of
bearing, friction and windage losses which are representative of the
actual installation shall be determined by (1) calculations or (2) experi-
ence with shop tested bearings and shall be included in the effi ciency
calculations.
Nominal Minimum
Effi ciency Effi ciency
93.6 ————— 20% Greater Losses → 92.4
|
10% Greater Losses
↓
93.0
286 ENERGY MANAGEMENT HANDBOOK
ambient temperature of 25°C plus the observed rated
load temperature rise measured by resistance. When
the rated load temperature rise has not been measured,
the resistance of the winding shall be corrected to the
following temperature:
————————————————————————————
Class of Insulation System Temperature, Degrees C
————————————————————————————
A 75
B 95
F 115
H 130
—————————————————————————
This reference temperature shall be used for deter-
mining I
2
R losses at all loads. If the rated temperature
rise is specifi ed as that of a lower class of insulation
system, the temperature for resistance correction shall
be that of the lower insulation class.
NEMA Standard 5-12-1975, revised 6-21-1979; 11-12-1981;
11-20-1986; 1-11-1989.
Effi ciency Of Polyphase Squirrel-cage
Medium Motors with Continuous Ratings
(MG 1-12.54.2)
The full-load effi ciency of Design A and B single-
speed polyphase squirrel-cage medium motors in the
range of 1 through 125 horsepower for frames assigned in
accordance with NEMA Standards Publication No. MG 13,
Frame Assignments for Alternating Current Integral-horse-
power Induction Motors, (see MG1-1.101) and equivalent
Design C ratings shall be identifi ed on the nameplate by
a nominal effi ciency selected from the Nominal Effi ciency
column in Table 11.2 (NEMA Table 12.6A) which shall be
not greater than the average effi ciency of a large popula-
tion of motors of the same design.
The effi ciency shall be identifi ed on the nameplate
by the caption “NEMA Nominal Effi ciency” or “NEMA
Nom. Eff.”
The full load effi ciency, when operating at rated
voltage and frequency, shall be not less than the mini-
mum value indicated in Column B of Table 11.2 (NEMA
Table 12.6A) associated with the nominal value in Col-
umn A.
Suggested Standard for Future Design 3-16-1977,
NEMA Standard 1-17-1980, revised 3-8-1983; 3-14-1991.
The full-load effi ciency, when operating at rated
voltage and frequency, shall be not less than the mini-
mum value indicated in Column C of Table 11.2 (NEMA
Table 12.6A) associated with the nominal value in Col-
umn A.
Suggested Standard for Future Design 3-14-1991.
Variations in materials, manufacturing processes,
and tests result in motor-to-motor effi ciency for a large
population of motors of a single design is not a unique
efficiency but rather a band of efficiency. Therefore,
Table 11.2 (NEMA Table 12.6A) has been established to
indicate a logical series of nominal motor effi ciencies
and the minimum associated with each nominal. The
nominal effi ciency represents a value which should be
used to compute the energy consumption of a motor or
group of motors.
Authorized Engineering Information 3-6-1977, revised
1-17-1980;1-11-1989.
Effi ciency Levels of Energy Effi cient Polyphase
Squirrel-Cage Induction Motors (MG 1-12.55)
The nominal full-load efficiency determined in
accordance with MG 1-12.54.1, identifi ed on the name-
plate in accordance with MG 1.12.54.2, and having
corresponding minimum effi ciency in accordance with
Column B of Table 11.2 (NEMA Table 12.6A) shall equal
or exceed the values listed in Table 11.3 (NEMA Table
12.6B) for the motor to be classified as “energy effi-
cient.”
NEMA Std 1-11-1989;3-14-1991.
Effi ciency Levels of Energy Effi cient Polyphase
Squirrel-Cage Induction Motors (MG 1-12.55A)
(SUGGESTED STANDARD FOR FUTURE DESIGN)
The nominal full-load effi ciency determined in ac-
cordance with MG 1-12.54.1, identifi ed on the nameplate
in accordance with MG 1-12.54.2 and having minimum
effi ciency in accordance with Column C of Table 11.2
(NEMA Table 12.6A) shall equal or exceed the values
listed in Table 11.4 (NEMA Table 12.6C) for the motor
to be classifi ed as “energy effi cient.”
Suggested Standard for future design 9-5-1991.
11.15 COMPARING MOTORS
It is essential that motor comparison be done on the
same basis as to type, size, load, cost of energy, operating
hours and most importantly the effi ciency values such as
nominal vs. nominal or guaranteed vs. guaranteed.
The following equations are used to compare the
two motors.
For loads not sensitive to motor speed—
Note: Replacing a standard motor with an energy-
effi cient motor in a centrifugal pump or fan application
can result in increased energy consumption if energy-ef-
fi cient motor operates at a higher RPM.
ELECTRIC ENERGY MANAGEMENT 287
Table 11.2 (NEMA Table 12.6A)
—————————————————————————
Column A Column B* Column C
†
Minimum
Nominal Effi ciency Minimum Effi ciency Effi ciency
based on 20% Based on 10% Loss
Loss Difference Difference
—————————————————————————
99.0 98.8 98.9
98.9 98.7 98.8
98.8 98.6 98.7
98.7 98.5 98.6
98.6 98.4 98.5
98.5 88.2 98.4
98.4 98.0 98.2
98.2 97.8 98.0
98.0 97.6 97.8
97.8 97.4 97.6
97.6 97.1 97.4
97.4 96.8 97.1
97.1 96.5 96.8
96.8 96.2 96.5
96.5 95.8 96.2
96.2 95.4 95.8
95.8 95.0 95.4
95.4 94.5 95.0
95.0 94.1 94.5
94.5 93.6 94.1
94.1 93.0 93.6
93.6 92.4 93.0
93.0 91.7 92.4
92.4 91.0 91.7
91.7 90.2 91.0
91.0 89.5 90.2
90.2 88.5 89.5
89.5 87.5 88.5
88.5 86.5 87.5
87.5 85.5 86.5
86.5 84.0 85.5
85.5 82.5 84.0
84.0 81.5 82.5
82.5 80.0 81.5
81.5 78.5 80.0
80.0 77.0 78.5
78.5 75.5 77.0
77.0 74.0 75.5
75.5 72.0 74.0
74.0 70.0 72.0
72.0 68.0 70.0
70.0 66.0 68.0
68.0 64.0 66.0
66.0 62.0 64.0
64.0 59.5 62.0
62.0 57.5 59.5
59.5 55.0 57.5
57.5 52.5 55.0
55.0 50.5 52.5
52.5 48.0 50.5
50.5 46.0 48.0
—————————————————————————
*Column B approved as NEMA Standard 3/14/1991
†
Column C approved as Suggested Standard for Future Designs 3/14/1991
288 ENERGY MANAGEMENT HANDBOOK
Table 11.3 (NEMA Table 12.6B) Full-load effi ciencies of energy effi cient motors.
ELECTRIC ENERGY MANAGEMENT 289
Table 11.4 (NEMA Table 12.6C) (Suggested standard for future design)
Full-load effi ciencies of energy effi cient motors.