Energy management problem Part 8 pptx
Bạn đang xem bản rút gọn của tài liệu. Xem và tải ngay bản đầy đủ của tài liệu tại đây (1.79 MB, 20 trang )
Equivalentconsumptionminimizationstrategiesofserieshybridcitybuses 133
Equivalent consumption minimization strategies of series hybrid city
buses
LiangfeiXu,GuijunCao,JianqiuLi,FuyuanYang,LanguangLuandMinggaoOuyang
X
Equivalent consumption minimization
strategies of series hybrid city buses
Liangfei Xu, Guijun Cao, Jianqiu Li, Fuyuan Yang, Languang Lu
and Minggao Ouyang
State Key Lab of Automotive Safety and Energy, Tsinghua University
P.R.China
1. Introduction
With ever growing concerns on energy crisis and environmental issues, alternative clean
and energy efficient vehicles are favoured for public applications. Internal combustion
engine(ICE)-powered series hybrid buses and fuel cell (FC) hybrid buses, respectively as a
near-term and long-term strategy, have a very promising application prospect.
The series hybrid vehicle utilizes an ICE/FC as the main power source and a battery/ultra
capacity (UC) as the auxiliary power source. The main power source supplies the average
vehicle power, and the auxiliary power source functions during accelerating and
decelerating. Because the battery/UC fulfills the transient power demand fluctuations, the
ICE/FC can work steadly. Thus, the durability of the fuel cell stack could be improved
compared with a pure FC-powered bus in the FC series hybrid bus. And the PM and NOx
can be greatly lowered in the ICE series hybrid bus compared with a traditional city bus.
Besides, the ability of the energy storage source to recover braking energy enhances the fuel
economy greatly.
The hybrid configuration raises the question of energy management strategy, which chooses
the power split between the two. The strategy is developed to achieve system-level
objectives, e.g. fuel economy, low emission and battery charge-sustaining, while satisfying
system constraints.
Energy management strategies in the recent literature can be generally categorized into two
types: rule-based strategies and optimal strategies. A rule based strategy can be easily
implemented for the real-time applications based on heuristics (N.Jalil, N.A.Kheir &
M.Salman, 1997). Such a strategy could be further improved by extracting optimal rules
from optimal algorithms (S.Aoyagi, Y.Hasegawa & T.Yonekura, 2001).
Optimal strategies differ from each other in the time range. Fuel consumption in a single
control cycle is minimized in an instantaneous optimal strategy (G.Paganelli, S.Delprat &
T.M.Guerra, 2002). And a global optimal strategy minimises it over a whole determined
driving cycle using determined dynamic programming method (DDP) (Chan Chiao Lin et
al., 2003), or over a undetermined driving cycle using stochastic dynamic programming
method (SDP) (Andreas Schell et al., 2005). Other strategies minimize fuel consumption over
an adaptive time span, which could be adjusted on the basis of vehicular speed, pedal
7
EnergyManagement134
positions, historical vehicle power and power forcasting in the future (Bin He, Minggao
Ouyang, 2006).
From a mathematical viewpoint, the optimal problem could be solved using different
methods. Energy management strategies based on DDP, SDP, fuzzy logic (Schouten N J,
Salman M A & Kheir N A, 2002), neural network optimal algorithm (Amin Hajizadeh,
Masoud Aliakbar Golkar, 2007), genetic algorithm (Vanessa Paladini et al., 2007) and
wavelet algorithm (Xi Zhang et al., 2008) have been proposed by different researchers.
This chapter describes the implementation of an equivalent consumption minimization
strategy in a FC+battery city bus and an ICE+battery city bus. It belongs to the
instantaneous optimization strategies. The strategy is based on an equivalent consumption
model, which was firstly proposed by Paganelli G (Paganelli G et al., 2002) to evalutate the
battery electrical energy consumption. The analytical solutions to the optimal problems are
given, avoiding using complex mathematical tools.
The charpter proceeds as follows. Section 2 describes the powertrain systems of the FC/ICE-
powered hybrid city buses. Section3 details the equivalent consumption model. Section 4
gives the equivalent consumption minimization strategy (ECMS) on the basis of the
analytical solutions. Section 5 discusses the results in the "China city bus typical cycle"
testing. Section 6 is the conclusions.
2. The series hybrid powertrains
In the 11
th
Five-Year Plan of China, a series of hybird city buses have been developed. Fig. 1
(a) and (b) show a fuel cell city bus and a diesel engine hybrid city bus respectively.
(a)
(b)
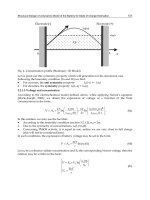
Fig. 1. (a) Fuel cell city bus (b) Diesel engine series hybrid city bus
Equivalentconsumptionminimizationstrategiesofserieshybridcitybuses 135
The series hybrid powertrain under discussion is mainly composed of a power unit (PU), an
auxiliary power source and an alternating current motor, as shown in Fig. 2 (a) and (b). A
Ni-MH battery has the advantage of good charging / discharging characteristics compared
with a Pb-Acid battery. And it is relatively cheap compared with a Li-ion battery. Thus, a
Ni-MH battery is selected as the auxiliary power source. The two kinds of city buses differ
in the PU configuration. In the fuel cell hybrid bus, the PU consists of a proton exchange
membrane (PEM) fuel cell system and a direct current to direct current (DC/DC) converter,
as in Fig. 2 (a). In the ICE hybrid bus, the PU consists of an internal combustion engine, a
generator and a rectifier, as in Fig. 2 (b).
As an electrochemical device, the PEM fuel cell system converts hydrogen energy to electrical
energy directly without mechanical processes. For the city bus in Fig. 1 (a), two stacks with a
rated power of 40kW are installed. The city bus is powered by an AC motor with a rated
power of 100kW. In order to fulfill the peak power during accelerating, a Ni-MH battery with
a rated capacity of 80A.h, and a rated open circuit voltage of 380V is utilized. The fuel cell
stack, the Ni-MH battery and the AC motor are connected as in Fig. 2 (a).
Compared with the FC-powered hybrid bus, the ICE-powered hybrid bus is much more
popular in the market because of the price. The city bus in Fig. 1 (b) is equipped with a
diesel engine SOFIM 2.8L. It reaches its maximal torque at 1500r.min
-1
. Its lowest specific
fuel consumption is 210g.kWh
-1
at about 1600r.min
-1
. A three-phase synchronous generator
is connected with the diesel engine directly to convert the mechanical power into alternating
current (AC). A three-phase rectifier is used to convert AC into direct current (DC). The AC
motor and the battery are similar as in the FC city bus. The diesel engine, the generator, the
rectifier, the battery and the motor are connected as in Fig. 2 (b).
Fig. 2 (a) and (b) also present the control systems of the hybrid powertrain. It is a distributed
control system based on a time-triggered controller area network (TTCAN). The vehicle
controller unit (VCU) is the “brain” of the control system. It receives driver commands
(pedal positions, shift signals, on-off swithes et al.) through its digital/analog input channels,
and sends control commands to other controllers.
In the FC+battery hybrid powertrain, the TTCAN consists of the VCU, a fuel cell controller,
a DC/DC controller, a battery management system and a motor controller. The output
torque of the motor and the output current of the DC/DC converter are controlled by the
VCU to regulate the motor power and the fuel cell power respectively (Xu Liangfei, 2008).
In the ICE+battery hybird powertrain, the TTCAN is composed of the VCU, an engine
controller, a excitation controller, a battery management system and a motor controller. The
output power of the PU is controlled by a PWM signal from the VCU to the excitation
controller, and the rotational speed of the diesel engine is controlled by a simulant throttle
signal from the VCU to the engine controller (Cao Guijun, 2009).
Main parameters of the two city buses are presented in Table 1.
EnergyManagement136
(a) (b)
Fig. 2. Series hybrid powertrain structure (He Bin, 2006) (a) PEM fuel cell+Ni-MH battery (b)
Diesel engine+Ni-MH battery
Parameter (Unit) Value
Fuel cell hybrid bus empty mass m (kg) 1.45×10
4
Diesel engine hybrid bus empty mass m
(kg)
1.35×10
4
Frontal area A (m2) 7.5
Drag coefficient C
D
0.7
Rolling resistance coefficient 1.8×10
-2
Mechanical efficiency η
T
(%) 95
Mass factor 1.1
PEM fuel cell rated power (kW) 80
DC/DC rated power (kW) 80
Style of the diesel engine SOFIM 2.8L
Diesel engine lowest fuel consumption 210g.kWh
-1
Style of the generator 4UC224G
Rated power of the generator 68kW at 1500r.min
-1
Style of the rectifier three phase full bridge uncontrollable
Power range of the rectifier (kW) 10~120
Ni-MH battery rated capacity (A.h) 80 in Fig. 1 (a), 60 in Fig. 1 (b)
Electric motor rated power (kW) 100
Table 1. Main parameters of the two hybrid city buses
Equivalentconsumptionminimizationstrategiesofserieshybridcitybuses 137
3. The equivalent consumption model
The concept of equivalent fuel consumption was proposed by Paganelli et al. for an
instantaneous optimization energy management strategy (Paganelli G et al., 2002). In the
two kinds of series hybrid vehicles, both the PU and the battery provide energy. The
electrical energy consumption of the battery is transformed into an equivalent fuel
consumption to make the two comparable. If some energy is drawn from the battery at the
current sample time, the battery will have to be recharged to maintain the state of charge
(SOC) in the future. The energy will be provided by the PU, or by the motor in braking
regeneration. That will imply extra fuel consumption. Because the operating points of the
PU and the battery in the future are unknown, the average values are used to calculate the
battery equivalent hydrogen consumption C
bat
.
C
bat
=δP
bat
C
pu,avg
/(η
dis
η
chg,avg
P
pu,avg
), P
bat
≥0
(1)
where:
P
bat
is the battery power, kW.
C
pu,avg
is the PU mean fuel consumption, g.s
-1
.
P
pu,avg
is the PU mean output power, kW.
η
dis
is the battery discharging efficiency.
η
chg,avg
is the battery mean charging efficiency.
δ is a ratio factor that defines as follows.
δ=E
pu,chg
/(E
pu,chg
+E
recycle,chg
)
(2)
where:
E
pu,chg
is the battery charging energy provided by the PU. E
recycle,chg
is the battery charging
energy which is recycled by the electric motor. The energy should be calculated over a
certain time range, depending on the working conditions. If no braking energy is recovered,
δ=1. If no PU energy is used to charge the battery, δ=0. The battery could not only be
charged by braking energy, 0<δ≤1.
If the battery is recharged at the current sample time, a discharge of the battery is required
to maintain the SOC. This discharge will lead to a reduction of the fuel consumption in the
future. The battery equivalent consumption can be calculated as
C
bat
=P
bat
η
chg
η
dis,avg
C
pu,avg
/P
pu,avg
, P
bat
<0
(3)
where:
η
chg
is the battery recharging efficiency.
η
dis,avg
is the battery mean discharging efficiency.
The battery charging/discharging efficiencies are calculated based on the Rint model (V. H.
Johnson, 2002), which is shown in Fig. 3. They can be formulated as
EnergyManagement138
dis bat
dis bat
2
ocv
chg bat
chg bat
2
ocv
4
1
1 1 0
2
4
2 / 1 1 0
R P
P
U
R P
P
U
(4)
where R
dis
and R
chg
are the battery discharging and charging resistance respectively, U
ocv
is
the open circuit voltage. All of them are functions of the battery SOC.
For the 80Ah Ni-MH battery, the relationship between R
dis
/R
chg
and SOC is shown in Fig. 3
(b), as well as the relationship between U
ocv
and SOC. Fig. 3 (c) presents the relationship
between battery efficiency and P
bat
, SOC. Fig. 3 (d) indicates the relationship between the
battery equivalent consumption and P
bat
, SOC, where δ=1.
20 30 40 50 60 70 8080
0.2
0.3
0.4
SOC (%)
R
bat
(
)
20 30 40 50 60 70 80
340
360
380
400
SOC (%)
U
ocv
(V)
(a) (b)
(c) (d)
Fig. 3. (a) The battery Rint model (b) Relationship between battery resistance/open circuit
voltage and SOC (solid line for charging, dashed line for discharging) (c) Battery efficiency
v.s. battery power and SOC (d) Battery equivalent hydrogen consumption C
bat
v.s. battery
power and SOC, δ=1.
In the fuel cell + battery hybrid powertrain, the PU is composed of the fuel cell system and
the DC/DC converter. In the following equations, C
fc
is the fuel cell hydrogen consumption,
and P
dc
is the DC/DC output power. According to the experimental data, the fuel cell
hydrogen consumption C
fc
can be expressed as
Equivalentconsumptionminimizationstrategiesofserieshybridcitybuses 139
0 dc 1 dc dc0
fc
2
0 dc 1 dc 2 dc dc0
,
+ + ,
a P a P P
C
b P b P b P P
(5)
where a
i
, b
i
are fit coefficients, P
dc0
is a critical value of P
dc
.
The relationship between C
fc
and P
dc
is nonlinear when P
dc
is smaller than the critical value
P
dc0
, and it is linear when P
dc
is larger than P
dc0
. Fig. 4 (a) and (b) compare the experiment
curves and the fitting curves in the two cases. P
dc0
is about 7.5kW for the hybrid powertrain
under discussion.
0 2 4 6 8
0
0.02
0.04
0.06
0.08
0.1
0.12
0.14
0.16
P
dc
(kW)
C
fc
(g.s
-1
)
Experiment
Fitting curve
0 20 40 60 80
0
0.2
0.4
0.6
0.8
1
1.2
1.4
1.6
P
dc
(kW)
C
fc
(g.s
-1
)
Experiment
Fitting curve
(a) (b)
Fig. 4. (a) Relationship between fuel cell hydrogen consumption C
fc
and DC/DC power P
dc
when P
dc
≤7.5kW (b) Relationship between fuel cell hydrogen consumption C
fc
and DC/DC
power P
dc
when P
dc
>7.5kW
In the diesel engine + battery hybrid powertrain, the PU is composed of the diesel engine,
the generator and the rectifier. In the following equations, C
ice
is the diesel engine fuel
consumption, and P
rec
is the rectifier output power. The specific fuel consumption of the
diesel engine is a complex function of torque and speed. Fig. 5 (a) gives an example of a TDI
1.9 L diesel engine. The engine can work at different working points when the output power
is P
ice
. Among these points there is an optimal working point, where the specific fuel
consumption is minimal. The optimal working points compose an optimal curve, as shown
in Fig. 5 (a). According to the optimal curve in Fig. 5 (a), we can find the relationship
between the diesel engine output power P
ice
and the minimal fuel consumption C
ice
, as in
Fig. 5 (b).
EnergyManagement140
0 10 20 30 40 50 60 70 8080
0
0.5
1
1.5
2
2.5
3
3.5
4
4.5
55
P
ice
(kW)
C
ice
(g.s
-1
)
Experiment
Fitting curve
(a) (b)
Fig. 5. (a) The relationship between specific fuel consumption, torque and rotational speed
of TDI 1.9L Diesel Engine. The dashed is the external characteristic, and the solid blue line is
the optimal curve. (He Bin, 2006) (b) The minimal fuel consumption when the engine output
power is P
ice
The fitting curve in Fig. 5 (b) can be expressed as:
2
ice 0 ice 1 ice 2
C c P c P c
(6)
where c
i
, i=0~2 are fitting coefficients. For the TDI 1.9L engine, c
0
=0.0002g.s
-1
.kW
-2
, c
1
=0.0456
g.s
-1
.kW
-1
, c
2
=0.2036g.s
-1
. The output power of the rectifier is calculated as:
rec ice gen rec
P P
(7)
where η
gen
and η
rec
are the generator and rectifier efficiencies respectively.
Then, the total fuel consumption C of the hybrid powertrain can be written as
p
u bat
C C C
(8)
4. The equivalent consumption minimization strategy (ECMS)
In the instantaneous optimization algorithm, an optimal output power of the PU is
calculated to minimize the powertrain fuel consumption in one control cycle. It can be
formulated mathematically as follows.
pu pu
p
u,opt pu bat
arg min arg min
P P
P C C C
subject to:
L H
bus,min bus bus,max
pu pu,max
SOC SOC SOC
0
U U U
P P
(9)
Equivalentconsumptionminimizationstrategiesofserieshybridcitybuses 141
where U
bus,min
and U
bus,max
are the minimal and maximal value of bus voltage, P
pu,max
is the
maximan of P
pu
, C
pu
equals to C
fc
in the fuel cell hybrid bus, C
pu
equals to C
ice
in the diesel
engine hybrid bus.
4.1 ECMS for the fuel cell hybrid powertrain
As for the fuel cell city bus under discussion, the vehicle auxiliary power P
aux
, which is
consumed by the cooling system, the electric assistant steering system et al., is about 5kW
(without the air condition) or 17kW (with the air condition). Therefore, the possibility of
P
dc
<7.5kW is very small. That means, the relationship between the fuel cell hydrogen
consumption C
fc
and the DC/DC power P
dc
could be regarded as linear in most of the time.
Then, the optimized problem defined in Equation (9) could be simplified and the analytic
solution to the problem is as follows.
2 2
ocv
bus,min ocv bus,min
bat,opt
dis dis
1
min ,
4
U
U U U
P
R R
(10)
where P
bat,opt
is the optimal battery power. If no braking energy is recovered, δ=1, then
P
bat,opt
=0. This is because the relationship between the hydrogen consumption and the
DC/DC power is linear, any charging/discharging process of the battery will cost an extra
energy.
With such a strategy, the battery SOC will fluctuate around the initial value. But usually we
want to keep the SOC around a target value SOC
tg
. Thus, a balance power P
bat,balance
is
defined as follows.
b
at,balance tg
SOC-SOCP k
(11)
where k is a coefficient, k>0. Then, the DC/DC target power P
dc,tg
is calculated as follows.
dc,tg demand bat,opt bat,balance dc,max
max min , ,0P P P P P
(12)
where P
demand
is the powertrain demand power, including the electric motor power and the
vehicle accessorial power. The VCU calculates the DC/DC target voltage/current according
to P
dc,tg
, sends the signal to the DC/DC controller through TTCAN. There is a time-delay
between the DC/DC target signal and its actual output. This is because the fuel cell can’t
response quickly to dynamic loads. The fuel cell voltage drops with increasing current. A
reactant starvation occurs at high currents and dynamic loads because the transport of
reactant gases is not able to keep pace with the amount used in the reaction (Xu Liangfei et
al., 2008).
EnergyManagement142
4.2 ECMS for the diesel engine hybrid powertrain
According to equations (6) and (7), the relationship between the C
ice
and P
rec
is.
' 2 '
ice 0 rec 1 rec 2
2
'
0 0 gen rec
'
1 1 gen rec
C c P c P c
c c
c c
(13)
The analytic solution for the optimized problem defined in Equation (9) can be written as
follows.
bus,min ocv bus,min
min
dis
2
2
ocv
min
2
dis
bat,opt chg,avg dis,avg
2
2
chg,avg dis,avg
ocv max
2
chg chg,avg dis,avg chg,avg dis,avg
bus,max bus,max o
1 ,
4
0, /
1 ,
4
U U U
K dx
R
U
K
dx K d
R a
P d K d
K
U dx
d
K
R a
U U U
,
cv
max
chg chg,avg dis,avg
,
dx
K
R
(14)
where d, K, x
min
, x
max
are coefficients defined as follows.
' '
1 0 demand
fc,avg dis,avg chg,avg bat
fc,avg dis,avg chg,avg bat
2
min bus,min bus,min ocv ocv
2
max bus,max bus,max ocv ocv
2
/ , 0
/ , 0
1 4
1 4
d c c P
C P
K
C P
x U U U U
x U U U U
(15)
Equations (14) and (15) indicate that, the battery optimal power P
bat,opt
is a function of
vehicle power demand P
demand
, battery SOC and the ratio coefficient δ. P
bat,opt
=f(P
demand
, SOC,
δ). In real-time application, this function can be calculated and stored in the ECU memory.
The target power of the rectifier P
rec,tg
is calculated using a similar formula as Equation (12).
rec,tg demand bat,opt bat,balance rec,max
max min , ,0P P P P P
(16)
Equivalentconsumptionminimizationstrategiesofserieshybridcitybuses 143
The output power of the rectifier is controlled by a PWM signal from the VCU to the
excitation controller. According to P
rec,tg
and the optimal curve in Fig. 5 (a), the optimal
working point (ω
eng
, T
eng
) can be found. The target rotational speed of the diesel engine ω
eng
is controlled by a simulant throttle signal from the VCU to the engine controller. In order to
reduce the emission during dynamic loads, there is a time-delay between the command of
VCU and the actual output of the engine (He Bin, 2006).
5. Results in the cycle testing
The instantaneous optimal energy management strategies have been successfully
implemented in the two hybrid city buses. The hybrid powertrains were tested on the test
bench with “China city bus typical cycle”. Results are presented in Fig. 6 (a)~(d).
Fig. 6 (a) and (b) presents the results of the fuel cell hybrid city bus in the cycle testing, δ =
0.6. The vehicle velocity is shown in Fig. 6 (a). The test lasts about 20mins, and the maximal
speed is 60km.h
-1
. The battery SOC was kept around 70%.
Fig. 6 (b) shows the power split between the electric motor, the battery and the PU (Fuel cell
+ DC/DC converter). Part of the braking energy was recycled. In this figure, P
m
stands for
the electric power of the motor. The electric power ranged from -50kW to 100kW. Because of
the time-delay between the DC/DC target command and its actual output, the DC/DC
output power changed much more slowly than the motor electric power. The battery
functioned during accelerating and decelerating. It was kept charge-sustaining.
Fig. 6 (c) indicates the energy flow diagram. The hydrogen energy is calculated on the basis
of its low heat value. The average efficiencies of the fuel cell system, the DC/DC converter
and the electric motor were 50%, 96% and 85% respectively. About 5.5% of the whole energy
was consumed by the vehicle auxiliary components, e.g. the air condition. About 45.2% of
the hydrogen energy was output from the electric motor, and about 9.5% of the hydrogen
energy was recycled. The battery slightly discharged. The fuel economy of the city bus was
about 7.4kg.100km
-1
.
The fuel consumption increases with δ increases. Testing results show that, their relationship
is as follows.
δ=0.6, fuel economy = 7.4kg.100km
-1
;
δ=0.85, fuel economy = 8.9kg.100km
-1
;
δ=1, fuel economy = 9.7kg.100km
-1
.
The energy flow diagram of the diesel hybrid powertrain, but not the city bus, is shown in
Fig. 6 (d). The average diesel engine efficiency was about 33.5%, which is lower than the fuel
cell engine. The total efficiency of the generator and the rectifier was about 85%. There were
no vehicle auxiliary components, because the testing was carried out on a test bench. About
33.1% of the whole energy was output from the electric motor, and about 11% of the energy
was recycled. The battery slightly discharged. As a result, the fuel economy was 30L.100km
-1
,
the NOx emission was 8.5g.km
-1
, and the PM emission was 0.1g.km
-1
(Cao Guijun, 2009).
EnergyManagement144
6. Conclusions
This chapter proposes an Equivalent Consumption Minimization Strategy (ECMS) for the
series hybrid city buses with two different powertrain configurations, Fuel cell + battery and
diesel engine + battery.
An equivalent consumption model is firstly introduced, incorporating the fuel consumption
of power unit and the battery equivalent consumption. The concept of the equivalent
consumption is further developed compared with its origin. The ECMS is developed based
on the analytical solution to the instantaneous optimization problem.
Because of the linear relationship between the fuel consumption and the DC/DC power, the
battery optimal power is a function of the battery SOC and the ratio coefficient δ.
The ratio coefficient δ depends on the braking regeneration strategy. And it changes with
the working conditions of the powertrain system. It is the key parameter of the ECMS, and
changes with time. Besides, a battery balance power is introduced to keep the battey SOC
around a target value.
0 200 400 600 800 1000 1200 1400
0
20
40
6060
t
(s)
V
h
(km.h
-1
)
0 200 400 600 800 1000 1200 14001400
65
70
75
t
(s)
SOC (%)
(a)
0 200 400 600 800 1000 1200 14001400
-50
0
50
t
(s)
P
bat
(kW)
0 200 400 600 800 1000 1200 14001400
0
50
t
(s)
P
dc
(kW)
0 200 400 600 800 1000 1200 14001400
-50
0
50
100
t
(s)
P
m
(kW)
(b)
Equivalentconsumptionminimizationstrategiesofserieshybridcitybuses 145
(c) (d)
Fig. 6. (a) Vehicle velocity and the battery SOC in the “China city bus typical cycle” (b)
Power split of the fuel cell hybrid city bus, δ = 0.6 (c) energy flow diagram of the fuel cell
hybrid city bus (d) energy flow diagram of the diesel hybrid powertrain, δ = 0.6
The ECMS of the diesel hybrid powertrain is a little complex, because there is a quadratic
relationship between the fuel consumption and the engine power. The battery optimal power is a
function of powertrain demand power, battery SOC and the ratio coefficient δ. For the same
reason, the balance power is introduced to calculate the target power of the rectifier.
The fuel cell + battery city bus was tested in the “China city bus typical cycle“. Results show
that, the battery SOC was kept around 70%, and the fuel economy was 7.4kg.100km
-1
. Fuel
consumption increases with the ration coefficient δ increases.
The diesel + battery powertrain was tested in lab with the same cycle. Results show that, the
battery SOC was kept in balance, and the fuel economy was 30L.100km
-1
.
In this chapter, we only consider the fuel economy in the optimal strategy. However, the fuel cell
durability and the exhaust emission should also be included in the optimized strategy.
Because of the linear characteristics of the fuel cell system, the fuel economy is mainly
determined by the ratio coefficient δ. It means that, the braking regeneration strategy contributes
much more than the power split strategy. Thus, the primary challenge in power split strategy is
to prolong the fuel cell durability, while fulfill the powertrain power demand.
The fuel economy of the diesel engine hybrid bus is determined by δ, SOC and vehicle
power demand. The braking regeneration strategy is also very important. The primary
challenge of the control system is to make the engine work on the optimal curve, as in Fig. 5
(a). Actually we use a feedforward + feedbackward method to control the engine working
point so as to lower the fuel consumption and the exhaust emission (Cao Guijun, 2009). This
control problem is valuable to be studied in future.
EnergyManagement146
7. References
N., Jalil; N., A., Kheir & M., Salman. (1997). A rule-based energy management strategy for a
series hybrid vehicle, Proceedings of the American Control Conference, pp. 689-693
S., Aoyagi; Y., Hasegawa; T., Yonekura; H., Abe. (2001). Energy efficiency improvement of
series hybrid vehicle. JSAE Review, Vol. 22, (2001), pp. 259-264
G., Paganelli; S., Delprat; T., M., Guerra; J., Rimaux; J., J., Santin. (2002). Equivalent
consumption minimization strategy for parallel hybrid powertrains. IEEE Vehicular
Technology Conference, Vol. 4, (2002), pp. 2076-2081
C., C., Lin; H., Peng; J.,W., Grizzle; J., Kang. (2003). Power managment strategy for a parallel
hybrid electric truck. IEEE Transactions on Control Systems Technology, Vol. 11, (2003),
pp. 839-849
Andreas Schell; Huei Peng; Doanh Tran; et al. (2005). Modelling and control
strategy development for fuel cell electric vehicles. Annual Reviews in
Control, Vol. 29, No. 1, pp. 159~168
B., He; M., Yang. (2006). Optimization-based energy management of series hybrid
vehicles considering transient behavior. International Journal of Alternative
Propulsion,Vol. 1, No. 1, pp. 79~96
Schouten N., J.,; Salman M., A.,; Kheir N., A. (2007). Fuzzy Logic Control for Parallel Hybrid
Vehicles. IEEE Transactions on Control Systems Technology, Vol. 10, No. 3, pp. 460~468
Amin Hajizadeh; Masoud Aliakbar Golkar. (2007). Intelligent power management strategy
of hybrid distributed generation system. International Journal of Electrical Power &
Energy Systems, Vol. 29, No. 10, pp. 783~795
Vanessa Paladini; Teresa Donateo; Arturo de Ris; et al. (2007). Super-capacitors fuel cell
hybrid electric vehicle optimization and control strategy development. Energy
Conversion and Management, Vol. 48, No. 1, pp. 3001~3008
Xi Zhang; Chunting Mi; Abul Masrur & David Daniszewski. (2008). Wavelet Based Power
Management of Hybrid Electric Vehicles with Multiple Onboard Power Sources.
Journal of Power Sources, Vol. 185, No. 2, pp. 1533-1543
Paganelli G., ; Delprat S., ; Guerra T., ; et al. (2002). Equivalent consumption
minimization strategy for parallel hybrid powertrains. IEEE 55th VTC,
Birmingham, Al, USA,Vol. 4, pp. 2076~2081
Xu Liangfei; Hua Jianfeng; Li Xiangjun; Meng Qingran; Li Jianqiu; Ouyang Minggao. (2008).
Control strategy optimization of a hybrid fuel cell vehicle with braking energy
regeneration. IEEE Vehicle Power and Propulsion Conference, Harbin, China, pp. 1-6
Cao Guijun. (2009).Research on the auxiliary power unit of the diesel based series hybrid
electric powertrain. PhD dissertation, Tsinghua University, Beijing, China
He Bin. (2006). Energy management and dynamic control of series hybrid vehicles. PhD
dissertation, Tsinghua University, Beijing, China
V., H., Johnson. (2002). Battery performance models in ADVISOR. Journal of Power Sources,
Vol. 110, No. 2, pp. 321~329
IntelligentEnergyManagementinHybridElectricVehicles 147
IntelligentEnergyManagementinHybridElectricVehicles
HamidKhayyam,AbbasKouzani,SaeidNahavandi,VincenzoMaranoandGiorgioRizzoni
X
Intelligent Energy Management
in Hybrid Electric Vehicles
Hamid Khayyam
1
, Abbas Kouzani
1
, Saeid Nahavandi
1
,
Vincenzo Marano
2
and Giorgio Rizzoni
2
Deakin University Australia
1
and The Ohio State University USA
2
1. Introduction
Energy management in vehicles is an important issue because it can significantly influence the
performances of the vehicles. Improving energy management in vehicles can deliver
important benefits such as reducing fuel consumption, decreasing emission, lower running
cost, reducing noise pollution, and improving driving performance and ease of use. According
to Mainins (Manins, 2000), each year more then 50 million new cars are produced in the world.
However, usually only 30% to 40% of the energy produced by the engine is used to drive a car.
The large energy waste of around 60% is the result of having an engine powerful enough to
cope with the maximum power demand despite the fact that such power is required for only a
vary small percentage of vehicles’ operating time. In addition, vehicle emissions are a source of
greenhouse gas pollution emitting 70% to 90% of urban air pollution (SOE, 2006). Fuel
economy benchmarks and emission regulations have encouraged vehicle manufactures and
researchers to investigate new technologies to enhance fuel economy and minimise emissions.
The energy efficiency of vehicles can be improved by enhancing the efficiency of the vehicle.
Implementing energy management strategies in classical vehicles does not fully deliver the
expected benefits. Hybrid electric vehicles, on the other hand, offer a platform that can
accommodate advanced energy management strategies giving rise to full realization of the
stated benefits. Intelligent energy management methods can observe and learn driver
behavior, environmental and vehicle conditions, and intelligently control the operation of
the hybrid electric vehicle.
A Hybrid Electric Vehicle (HEV) takes advantage of an Internal Combustion Engine (ICE)
and an Electric Motor (EM) to deliver fuel consumption and exhaust emission reduction. An
EM is powered by on-board battery packs to drive the vehicle. From the consumers overall
perspective, the HEV is essentially the same as a Conventional Vehicle (CV). Moreover,
HEVs are refuelled in the same way as a CV. A HEV has the advantage over a pure Electric
Vehicle (EV) in both travelling range and convenience, as there is no need to recharge the
battery through a power point for long hours. Importantly, a HEV has the potential to
improve fuel economy by almost 50%, while also possessing all the advantages and
flexibility of a CV (Ehsani et al,. 2005). Hence, HEVs solve the problems of EVs whilst
minimising the shortcoming of CVs providing the benefits of both electric and conventional
8
EnergyManagement148
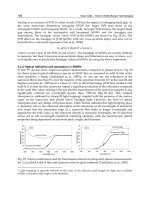
vehicles. HEVs are categorised into three groups: Series (S-HEV), Parallel (P-HEV), and
Series/Parallel (S/P-HEV) as shown in Fig. 1.
In an S-HEV, there is no mechanical link between the ICE and drive train. This means that
the ICE can run continuously in its preferred operating range, whereas the drivetrain is
driven by an electric machine. For the electric power request, it relies on the battery plus the
generator. The generator is driven by the ICE and maintains an appropriate energy level in
the battery. A disadvantage of this configuration is that energy is first converted from
mechanical power to electric power with the generator and then back to mechanical power
by the electric machine, both introducing losses.
The P-HEV establishes a parallel connection between the ICE and the electric machine that
both are allowed to give force to the drive the vehicle. The power through the EM can be
positive as well as negative. This allows the EM to operate in motor mode and generator
mode. At a top-level view, the P-HEV configuration looks similar to a conventional vehicle,
although the EM in a conventional vehicle operates only in generator mode.
Finally, the last vehicle configuration is an S/P-HEV. It merges the topology of a series and a
parallel HEV. S/P-HEVs have the highest complexity since power to the drivetrain can follow
various trajectories. Recently plug-in hybrid electric vehicle (PHEV) has come to market. A
PHEV is a hybrid electric vehicle that described above. The PHEV batteries can be recharged
by plugging into an electric power source. A PHEV combines type of conventional hybrid
electric vehicles and battery electric vehicles, possessing both an internal combustion engine
and batteries for power. The desire strategy using PHEV can be employed as follows: in short
distance travelling electric vehicle (EV) mode operation such as urban and for long distance
travelling hybrid electric vehicle (HEV) mode operation such as highways.
The most important challenge for the development of P-HEV is the synchronization of
multiple energy sources and conversion of power flow control for both the mechanical and
electrical paths in optimal fuel efficiency and battery areas.The difficulty in the development
of hybrid electric vehicles is the coordination of multiple sources such as mechanical and
electrical. The reason why a P-HEV is considered in this work is that it has fewer disadvantages
and less complexity (Kessels.J, 2007) (Ehsani et al.,2005).
Fig. 1. Three HEVs structures.
Nevertheless, any vehicle needs to deal with uncertain factors such as environment
conditions and also driver behaviour. HEVs are a highly complex systems comprising a
IntelligentEnergyManagementinHybridElectricVehicles 149
large number of mechanical, electronic, and electromechanical elements (Zhu et al.,2002).
Hence a HEV can be considered as a Complex System (CS).
A Complex System is a system that can be analyzed into many components having
relatively many relations among them, so that the behaviour of each component depends on
the behaviour of others (Simon. A.H,1973).
In the real world, many problems and systems exist that are too complex or uncertain to be
represented by complete and accurate mathematical models. However, such systems need
to be designed, optimized, and controlled. CSs can be handled by Intelligent Systems (ISs).
ISs can learn from examples, are fault tolerant, are able to deal with non-linear problems,
and once trained can perform prediction and generalization at high speed. Intelligence
systems have been used in diverse applications in control, robotics, pattern recognition,
forecasting, medicine, power systems, manufacturing, optimization, signal processing, and
social/psychological sciences. They are useful in system modelling such as in implementing
complex mappings and system identification. ISs comprise areas like expert systems,
artificial neural networks, genetic algorithms, fuzzy logic and various hybrid systems,
which combine two or more of these techniques. ISs play an important role in modelling
and prediction of the performance and control of energy and renewable energy processes.
According to literature, ISs have been applied to energy and renewable energy engineering.
ISs can be developed through modelling and simulation. The modelling and simulation
approach has become an essential tool for mechanical engineers and automotive researches in
improving efficiency and timing of vehicle design and development, resulting in the delivery of
significant cost saving as well as environmental benefits. The modelling and simulation is
generally defined as mathematical realisation and computerised analysis of abstract
representation of systems. The modelling and simulation helps achieve insight into the
functionality of the modelled systems, and investigate the systems' behaviours and
performances. The modelling and simulation is used in a variety of practical contexts relating to
the design, development, and use of conventional as well as advanced vehicles including: design
and evaluation of vehicle performance, fuel consumption, emission, energy storage devices,
internal combustion engine, hybrid engine, accessories, composite materials, determination of
drag using wind tunnel, training drivers trough virtual vehicle, collecting and analysing sensory
information, identifying critical test conditions, investigating crash factors, characterising road
topology, testing and analysing energy management strategies, and so on.
This work employs the modelling and simulation approach to develop an Intelligent Energy
Management System (IEMS) for a P-HEV.
The main objective is to optimize fuel consumption and reduce emissions. The work involves the
analysis of the role of drivetrain, energy management control strategy and the associated impacts
on the fuel consumption with combined wind/drag, slope, rolling, and accessories loads.
2. Literature Review and Background
This section provides a review of the main approaches used in modelling and control of
energy management of HEVs. In a CV, energy can be dissipated in a number of ways
including (Kessels.J, 2007):
i. Brake utilisation: The brake is applied by the driver to decelerate the vehicle
resulting in the loss of kinetic energy in the form of heat.
EnergyManagement150
ii. Engine start/stop: The engine often runs idle during the utilisation of vehicle
resulting in an unnecessary consumption of fuel.
iii. Uneconomic engine operating condition: An engine often demonstrates non- linear
fuel consumption behaviour in certain operating conditions that causes an
excessive use of fuel.
iv. Unscheduled load: Certain mechanical and electrical loads get activated outside the
economic operating point of engine increasing the fuel consumption.
P-HEVs provide a platform to reduce the wasted energy. The most important challenge for the
development of P-HEV is the synchronization of multiple energy sources and conversion of
power flow control for both the mechanical and electrical paths. Control in HEVs is recognized
as two levels of actions: supervisory control and component control. In this study supervisory
control is investigated as a suitable control strategy in energy management.
The control strategy is an algorithm that is used for issuing a sequence of instructions from
the vehicle central controller to operate the drivetrain of the vehicle. The control strategy
needs to monitor uncertain events. Moreover, in order to improve the system, the control
strategy can provide optimized energy management. The control strategies in a P-HEV can
be classified in two main groups as follows.
2.1 Rule-Based Control
The control rules techniques are based on mathematical, heuristics, and human expertise
generally with an analytical knowledge of a predefined driving cycle. Control rules can be
categorized in three methods.
A. Rule-Based
This method is based on an examination of the power requirements, ICE efficiency, fuel or
emission maps. Human knowledge is used to design rules to split the requested power between
converters. The method can be categorized into three groups: on/off control (Ehsani et al.,2005),
base line control (Zhu et al.,2002) (Sciarretta et al., 2004) (Linl et al.,2004) (Lyshevski,1999)
(Barsali et al., 2004) (Khayyam et al., 2008), and discrete time events (Zhang & Chen, 2001)
approaches.
B. Fuzzy logic
Fuzzy logic control has a nonlinear structure that can deal with the nonlinear structure of
the power split problem. Fuzzy logic has a more robust structure and offers more design
flexibility. The problem with fuzzy logic is the optimization and mathematical manipulation
of defuzzification system. The defuzzification process consumes memory and time in
controller. Some fuzzy logic controller have been developed for HEVs including (Baumann
et al., 2000) (Farrokhi & Mohebbi, 2005) (Langari &won, 2005) (Mohebbi et al.,2005) ( Salman
et al., 2000) (Schouten et al.,2002) (Hajimiri at al., 2008).
C. Neuro-Fuzzy
There are also combinations of fuzzy logic and artificial neural called neuro-fuzzy control
(Mohebbi et al.,2005) and fuzzy discrete event control (Bathaee et al., 2005).
IntelligentEnergyManagementinHybridElectricVehicles 151
2.2 Optimal Control
In optimal control the controller is optimized according to a cost function of the system.
Therefore, optimal control strategies are almost perfect. However, the optimal controllers
are sensitive to parameter changes and also to noise. To perform the optimization process,
all the dynamic and static behaviours of the system components are taken into
consideration. Calculations are usually simplified by introducing assumptions which means
that the solution is optimum only under the assumptions. On the other hand, the discrete
time events method is simple and more robust. System behaviours are divided into discrete
events. Each event is connected to another by certain rules (Mohebbi & Farrokhi, 2007).
If this optimal control is performed over a fixed driving cycle, a global optimum solution
can be found. In fact, the optimal control system solution is noncasual in that it achieves the
reduction of fuel consumption using information of future and past power demands.
Obviously, this technique cannot be used directly for real-time energy management.
Optimal control can be divided in two groups as follows.
A. Global Optimization (off line)
There are several reported solutions to achieve performance targets by optimization of a cost
function representing efficiency over a drive cycle, yielding global optimal operating points.
The global optimization techniques are not directly applicable for real-time problems,
considering the fact that they are casual solutions. This is due to their computational
complexity. Some of the global optimization methods are given below:
A.1 Neural Networks
Neural networks have the ability to be trained online or offline, but online training
consumes memory in a controller. This trainability characteristic makes neural networks as
a good candidate for adaptive energy management systems. As an example, the work
presented in (Mohebbi &Farrokhi,2007) developed a neural network for optimal control.
Prokhorov (Prokhorov D.V , 2008) used a neural network controller for improved fuel
efficiency of the Toyota Prius hybrid electric vehicle. A new method to detect and mitigate a
battery fault was also presented. The developed approach was based on recurrent networks
and included the extended Kalman filter.
A.2 Classical Optimal Control
(Delprat et al,. 2004) used the optimal control theory based on Lewis and Syrmos (Lewis &
Syrmos., 1995) work. This method is directly applied to find a global solution for the energy
management problem in a parallel torque-addition arrangement. The analytical nature of
this method makes it a good one. However, variation of drivetrain structure makes it
difficult to find an analytical solution, compared with numerical and iterative-based
methods. Some optimal control have been developed for HEVs including (Wei et al.,2007)
(Pisu & Rizzoni,2007) (Musardo et al.,2007).
A.3 Linear Programming
This method can formulate the problem of optimizing the fuel efficiency as a nonlinear
convex optimization problem that is approximated by a large linear program (Tate &
EnergyManagement152
Boyd,1998). The approximations used for transformations and the fact that LP may not be
applicable to a more sophisticated drivetrain degrade the proposed approach.
A.4 Dynamic and Stochastic Programming
Dynamic Programming (DP) method utilizes the minimizing cost function over a driving
cycle. (Lin et al.,2003) demonstrated that the approach does not give a real-time solution by
nature. A family of random driving cycles needs to be used to find an optimal solution.
A.5 Genetic Algorithm
The Genetic Algorithm (GA) has been used to solve a constrained nonlinear programming
problem. (Piccolo et al.,2001) showed that GA is very useful for complex nonlinear optimization
problems. This is because GA leads to a more accurate exploration of the solution space than a
conventional gradient-based procedure. But GA dose not give the necessary view to the designer
of the powertrain , unlike an analytical approach. Montazeri et al. (Montazeri et al., 2006)
described the application of genetic algorithm for optimization of control parameters in P-HEV.
B. Real Time Optimization (on line)
In order to develop a cost function for real-time optimization, the following methods can be used.
B.1 Model Predictive Control
(Salman et al., 2005) utilized a look-ahead window to find a real-time predictive optimal
control law. This approach can be used for superior fuel economy by previewing the driving
pattern and road information.
B.2 Decoupling Control
(Barbarisi et al.,2005) proposed a novel strategy to assure acceptable drivability of the
vehicle that was based on the vehicle’s dynamic model. Based on the proposed decoupling
methods, the controller’s output is composed of different components.
B.3 Genetic-Fuzzy
The genetic-fuzzy control strategy is a fuzzy logic controller that is tuned by a genetic
algorithm. Poursamad et al. (Poursamad et al.,2008) and Montazeri et al. (Montazeri et al.,
2008) applied these control strategy model to minimize fuel consumption and emission.
2.3 Discussions
The presented work is focused on a control strategy to reduce fuel consumption though
considering performance and driveability. Our optimal control strategy is found in two
steps, first finding the control which results in the reduction of fuel consumption together
and offering the best performance, and second taking vehicle driveability into consideration.
Among the control strategies for the best fuel economy, dynamic programming is the only
one that assures global optimality if the driving cycle is known in advance.
However, it does not apply to real-time problems. On the other hand, fuzzy logic, rule-
based, and neuro-fuzzy controllers are not generally optimized, but applied to real-time