POWER QUALITY phần 10 potx
Bạn đang xem bản rút gọn của tài liệu. Xem và tải ngay bản đầy đủ của tài liệu tại đây (3.44 MB, 22 trang )
© 2002 by CRC Press LLC
8.11 MEASUREMENT OF STATIC VOLTAGES
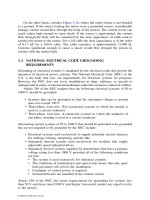
Static voltages are measured using an electrostatic meter, a handheld device that
utilizes the capacitance in air between a charged surface and the meter membrane.
Figure 8.8 shows how a static meter is used to measure static voltages. The meters
are battery powered and self-contained; the meter scale is calibrated according to
the distance of the meter membrane from the point at which static potentials are to
be measured. Static meters are useful for detecting static potentials ranging between
100 and 30,000 V.
8.12 DISCHARGE OF STATIC POTENTIALS
What should be considered a safe static potential level? From Table 8.2, a potential
of 100 V may be established as the maximum permissible level for facilities handling
or using sensitive devices. A model for safe discharge of static potentials might be
developed as follows. A capacitor (
C
) charged to a voltage of
E
and discharged
through a resistance
R
will discharge exponentially as determined by the following
expression:
V
=
Ee
–t
/
RC
where
t
is the instant in time after closing the switch at which the value of
V
is
required. The voltage across the capacitor decreases exponentially as dictated by the
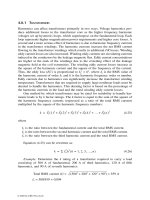
FIGURE 8.7
Measurement of surface resistance using 5-lb electrodes according to the NFPA
99 Standard for Health Care Facilities.
3 FT
OHM
METER
5 LB 5 LB
ANTISTATIC FLOOR
© 2002 by CRC Press LLC
product of the quantity
RC
, which is known as the time constant of the series
resistive/capacitive circuit. The circuit model is shown in Figure 8.9
Example:
A triboelectric material with a capacitance of 1
µ
F is charged to a
potential of 20,000 V. What is the value of the resistance required to discharge the
material to a safe voltage of 100 V in 1 sec? The expression is given by:
100 = 20,000
e
–1.0/
R
(0.000001)
1/
e
1,000,000/
R
= 0.005
Therefore,
e
1,000,000/
R
= 200
1,000,000/
R
= ln(200) = 5.298
R
≅ 189 κ Ω
FIGURE 8.8
Static voltmeter. The meter scale is calibrated at .5 and 4 inches away from the
test surface.
+5000-500
-3000 +3000
D=1/2"
D =4"
D
LOW HIGH
MULTIPLY SCALE BY 10
AT HIGH SETTING
SURFACE WHERE STATIC MEASUREMENTS ARE REQUIRED
MEMBRANE
© 2002 by CRC Press LLC
This is the maximum value of resistance to be used to discharge the capacitor
to 100 V in 1 sec. In the same example, if the capacitor was initially charged to
30,000 V and using
R
= 189 k
Ω
, the time to discharge to 100 volts is 1.078 sec (the
reader is encouraged to work this out).
In the design of a static-control system, parameters such as capacitance of the
personnel, maximum anticipated potential static buildup, and the time to discharge
the personnel to safe levels should be known for the model. This is also true when
designing static discharge systems for containers entering static protected environ-
ments. Such containers should be discharged to safe levels prior to entering the
protected space.
8.13 CONCLUSIONS
Static potentials are troublesome in many ways. While examining many different
types of facilities experiencing static phenomena, the author has seen firsthand the
damaging effects of such static voltage accumulations. In one case, static voltage
problems resulted in disruption of operation of a car dealership by locking up the
computers several times a day. A semiconductor manufacturing facility was affected
due to static potentials building up to levels exceeding 30,000 V. The voltages built
up on personnel walking across the production floor on metal gratings that had been
coated with a synthetic coating to prevent corrosion. Grocery stores have been prone
to static problems primarily due to the use of carts with wheels made of synthetic
materials that are highly nonconductive. A facility that handles hazardous chemicals
was shut down by the local jurisdiction because static voltages were creating a
variety of problems, including malfunction of material-handling equipment. While
the underlying problem was the same in each of these cases, the cures were different.
In some instances, the problem was corrected by a single fix and in other cases a
combination of fixes was necessary. Static electricity is not easy to identify because
even at levels far below the threshold of human perception equipment damage or
malfunction can result. This chapter has attempted to provide the basic tools neces-
sary to identify static potentials and solutions for dealing with them.
FIGURE 8.9
Capacitance discharge configuration used in static voltage discharge model.
CR
SWITCH
E
TIME CONSTANT = RC
© 2002 by CRC Press LLC
9
Measuring and Solving
Power Quality Problems
9.1 INTRODUCTION
Comprehensive knowledge of power quality issues is important in today’s electrical
power system operating environment, but the ultimate purpose of learning about
power quality is to be able to solve power quality problems. Whether the reader is
going to put on personal protective equipment and set up instrumentation to deter-
mine the problem or entrust someone else to perform this task, information on how
to actually accomplish this is vital. Solving power quality problems depends on
acquiring meaningful data at the optimum location or locations and within an
expedient time frame. In order to acquire useful and relevant data, instruments most
suited for a particular application should be utilized. Most power quality problems
that go unrecognized are due to use of instruments not ideally suited for that
application. One also needs to have a sense about the location or locations where
data need to be collected and for how long. After the data is acquired, sort it to
determine what information is pertinent to the problem on hand and what is not.
This process requires knowledge of the power system and knowledge of the affected
equipment. Initially, all data not determined to be directly useful should be set aside
for later use. All data deemed to be relevant should be prioritized and analyzed to
obtain a solution to the problem. It should be stressed once again that some power
quality problems require not a single solution but a combination of solutions to
obtain the desired end results. In this chapter, some of the power quality instrumen-
tation commonly used will be discussed and their application in the power quality
field will be indicated.
9.2 POWER QUALITY MEASUREMENT DEVICES
9.2.1 H
ARMONIC
A
NALYZERS
Harmonic analyzers or harmonic meters are relatively simple instruments for mea-
suring and recording harmonic distortion data. Typically, harmonic analyzers contain
a meter with a waveform display screen, voltage leads, and current probes. Some
of the analyzers are handheld devices and others are intended for tabletop use. Some
instruments provide a snapshot of the waveform and harmonic distortion pertaining
to the instant during which the measurement is made. Other instruments are capable
of recording snapshots as well as a continuous record of harmonic distortion over
time. Obviously, units that provide more information cost more. Depending on the
© 2002 by CRC Press LLC
power quality issue, snapshots of the harmonic distortion might suffice. Other prob-
lems, however, might require knowledge of how the harmonic distortion character-
istics change with plant loading and time.
What is the largest harmonic frequency of interest that should be included in
the measurement? It has been the author’s experience that measurements to the 25th
harmonics are sufficient to indicate the makeup of the waveform. Harmonic analyzers
from various manufacturers tend to have different, upper-harmonic-frequency mea-
surement capability. As described in Chapter 4, harmonic distortion levels diminish
substantially with the harmonic number. In order to accurately determine the fre-
quency content, the sampling frequency of the measuring instrument must be greater
than twice the frequency of the highest harmonic of interest. This rule is called the
Nyquist frequency criteria. According to Nyquist criteria, to accurately determine
the frequency content of a 60-Hz fundamental frequency waveform up to the 25th
harmonic number, the harmonic measuring instrument must have a minimum sam-
pling rate of 3000 (25
×
60
×
2) samples per second. Of course, higher sampling
rates more accurately reflect the actual waveform.
Measurement of voltage harmonic data requires leads that can be attached to
the points at which the distortion measurements are needed. Typical voltage leads
are 4 to 6 ft long. At these lengths, cable inductance and capacitance are not a
concern, as the highest frequency of interest is in the range of 1500 to 3000 Hz
(25th to 50th harmonic); therefore, no significant attenuation or distortion should
be introduced by the leads in the voltage distortion data.
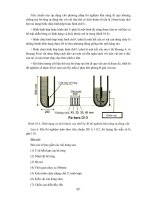
Measuring current harmonic distortion data requires some special consider-
ations. Most current probes use an iron core transformer designed to fit around the
conductors in which harmonic measurements are needed (Figure 9.1). Iron-core
current probes are susceptible to increased error at high frequencies and saturation
at currents higher than the rated values. Prior to installing current probes for harmonic
distortion tests, it is necessary to ensure that the probe is suitable for use at high
frequencies without a significant loss in accuracy. Manufacturers provide data as to
the usable frequency range for the current probes. The probe shown in Figure 9.1
is useful between the frequencies of 5 Hz and 10 kHz for a maximum current rating
of 500 A RMS. It should be understood that, even though the probe might be rated
for use at the higher frequencies, there is an accompanying loss of accuracy in the
data. The aim is to keep the loss of accuracy as low as possible. At higher frequencies,
currents and distortions normally looked at are considerably lower than at the lower
frequencies, and some loss of accuracy at higher frequencies might not be all that
important. Typically, a 5.0% loss in accuracy might be expected, if the waveform
contains significant levels of higher order harmonics.
Figure 9.2 shows the use of a handheld harmonic measuring instrument. This
particular instrument is a single-phase measurement device capable of being used in
circuits of up to 600 VAC. Table 9.1 provides a printout of harmonic distortion data
measured at a power distribution panel supplying a small office building. The table
shows the voltage and current harmonic information to the 31st harmonic frequency.
Along with harmonic distortion, the relative phase angle between the harmonics and
the fundamental voltage is also given. Phase angle information is useful is assessing
the direction of the harmonic flow and the location of the source of the harmonics.
© 2002 by CRC Press LLC
A point worth noting is that the harmonics are shown as a percent of the total RMS
value. IEEE convention presents the harmonics as a percent of the fundamental
component. Using the IEEE convention would result in higher harmonic percent
values. As pointed out in Chapter 4, it does not really matter what convention is
used as long as the same convention is maintained throughout the discussion.
Figure 9.3 shows a tabletop harmonic analyzer for measuring harmonic distortion
snapshots and harmonic distortion history data for a specified duration. Table 9.2
contains the harmonic current distortion snapshot data recorded at a lighting panel
in a high-rise building. Figure 9.4 provides the current waveform and a record of
the current history at the panel over 5 days. The harmonic distortion snapshots along
with the history graph are very useful in determining the nature of the harmonics
and their occurrence pattern.
9.2.2 T
RANSIENT
-D
ISTURBANCE
A
NALYZERS
Transient-disturbance analyzers are advanced data acquisition devices for capturing,
storing, and presenting short-duration, subcycle power system disturbances. As one
might expect, the sampling rates for these instruments are high. It is not untypical
for transient-disturbance recorders to have sampling rates in the range of 2 to
4 million samples per second. Higher sampling rates provide greater accuracy in
describing transient events in terms of their amplitude and frequency content. Both
FIGURE 9.1
Current probe for measuring currents with waveform distortion due to
harmonics.
© 2002 by CRC Press LLC
these attributes are essential for performing transient analysis. The amplitude of the
waveform provides information about the potential for damage to the affected
equipment. The frequency content informs us as to how the events may couple to
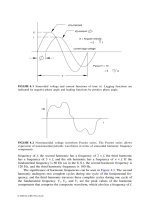
other circuits and how they might be mitigated. Figure 9.5 shows a transient that
reached peak amplitude of 562 V with a frequency content of approximately 200
kHz. Once such information is determined, equipment susceptibility should be
determined. For instance, a 200-V peak impulse applied to a 480-V motor might
not have any effect on the motor life; however, the same impulse applied to a process
controller could produce immediate failure. Equipment that contains power supplies
or capacitor filter circuits is especially susceptible to fast rise-time transients with
high-frequency content.
When measuring fast rise time or higher frequency transients, the length of the
wires used to connect the instrumentation to the test points becomes very important.
In all of these measurements, the leads should be kept as short as possible. Typically,
lead lengths of 6 ft or less should not introduce significant errors in the measurements
of fast transients. At higher frequencies, cable inductance as well as capacitance
become important factors. The use of longer cable lengths in transient measurements
results in higher inductance and capacitance and greater attenuation of the transient
waveform. Also, in order to minimize noise pickup from external sources, the voltage
leads should be kept away from high-voltage and high-current conductors, welding
equipment, motors, and transformers. The leads should be kept as straight as possible
FIGURE 9.2
Handheld harmonic analyzer showing voltage leads and current probe for
voltage and current harmonic measurements. (Photograph courtesy of Fluke.)
© 2002 by CRC Press LLC
without sharp bends or loops. In any case, excess lead length should never be wound
into a coil.
Current transformers used in transient current measurements must have a peak
current rating at least equal to the maximum expected currents; otherwise, current
peaks are lost in the data due to saturation of the current probe. Figure 9.6 indicates
how current probe saturation resulted in a flat-top current waveform and loss of vital
information, making power quality analysis more difficult.
TABLE 9.1
Voltage and Current Harmonic Spectrum at an Office Building
Harmonics Frequency
V
Magnitude
%
V RMS
V
(Phase)
I
Magnitude
%
I RMS
I
(Phase)
DC 0 0.09 0.07 0 0.06 0.14 0
1 59.91 122.84 99.82 0 43.44 97.17 –18
2 119.82 0.09 0.07 74 0.11 0.24 –63
3 179.73 6.33 5.14 42 7.63 17.07 150
4 239.64 0.06 0.05 135 0.09 0.21 90
5 299.56 0.2 0.17 –67 6.3 14.09 –49
6 359.47 0.03 0.03 –156 0.05 0.11 –70
7 419.38 1.15 0.93 20 2.22 4.96 116
8 479.29 0.05 0.04 –80 0 0 105
9 539.2 0.91 0.74 108 0.34 0.77 –150
10 599.11 0.02 0.02 –5 0.01 0.01 45
11 659.02 0.42 0.34 –160 0.81 1.8 –56
12 718.93 0.04 0.03 82 0.01 0.03 165
13 778.84 0.13 0.11 –80 0.52 1.16 96
14 838.76 0.02 0.01 60 0.03 0.07 –88
15 898.67 0.66 0.53 84 0.13 0.28 –159
16 958.58 0.01 0.01 –174 0.01 0.03 63
17 1018.49 0.28 0.23 120 0.37 0.82 –124
18 1078.4 0.01 0.01 –146 0.02 0.04 –129
19 1138.31 0.05 0.04 –145 0.33 0.74 52
20 1198.22 0.01 0.01 –13 0.01 0.03 124
21 1258.13 0.17 0.14 44 0.14 0.31 –179
22 1318.04 0.02 0.01 36 0.02 0.04 –90
23 1377.96 0.15 0.12 101 0.08 0.18 –157
24 1437.87 0.02 0.02 –162 0.01 0.03 –156
25 1497.78 0.02 0.02 167 0.12 0.27 –9
26 1557.69 0.04 0.03 –169 0.01 0.03 –86
27 1617.6 0.09 0.07 –32 0.1 0.22 146
28 1677.51 0.02 0.02 –62 0.04 0.1 34
29 1737.42 0.04 0.03 –29 0.03 0.07 70
30 1797.33 0.02 0.02 –33 0.01 0.03 4
31 1857.24 0.04 0.03 –80 0.08 0.18 –39
Note:
The table shows the harmonic number, harmonic frequency, magnitudes, percent harmonic in
terms of the total RMS, and the phase angle of each with respect to the fundamental voltage.
© 2002 by CRC Press LLC
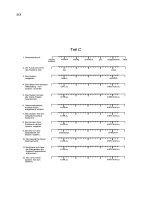
TABLE 9.2
Current Harmonic Spectrum for a Lighting Panel Supplying
Fluorescent Lighting
a
Harmonics RMS Value Phase % of Fundamental
0 10.298 180 74.603
1 13.804 157.645 100
2 0.209 337.166 1.511
3 2.014 62.148 14.588
4 0.136 333.435 0.983
5 1.187 81.18 8.603
6 0.051 0 0.366
7 0.372 45 2.695
8 0.121 270 0.879
9 0.551 20.433 3.989
10 0.087 324.462 0.63
11 0.272 15.068 1.973
12 0.101 143.13 0.733
13 0.285 6.116 2.064
14 0.083 345.964 0.604
15 0.083 75.964 0.604
16 0.042 284.036 0.302
17 0.243 45 1.762
18 0.054 21.801 0.395
19 0.051 53.13 0.366
20 0.103 348.69 0.747
21 0.04 0 0.293
22 0.103 281.31 0.747
23 0.036 123.69 0.264
24 0.103 101.31 0.747
25 0.02 90 0.147
26 0.062 189.462 0.446
27 0.068 206.565 0.492
28 0.052 78.69 0.374
29 0.187 49.399 1.351
30 0.03 270 0.22
31 0.145 155.225 1.049
32 0.059 210.964 0.427
33 0.113 10.305 0.819
34 0.074 285.945 0.534
35 0.045 26.565 0.328
36 0.096 341.565 0.695
37 0.136 318.013 0.986
38 0.074 254.055 0.534
39 0.109 201.801 0.789
40 0.109 248.199 0.789
41 0.051 143.13 0.366
42 0.103 281.31 0.747
© 2002 by CRC Press LLC
9.2.3 O
SCILLOSCOPES
Oscilloscopes are useful for measuring repetitive high-frequency waveforms or
waveforms containing superimposed high-frequency noise on power and control
circuits. Oscilloscopes have sampling rates far higher than transient-disturbance
analyzers. Oscilloscopes with sampling rates of several hundred million samples per
second are common. This allows the instrument to accurately record recurring noise
and high-frequency waveforms. Figure 9.7 shows the pulse-width-modulated wave-
form of the voltage input to an adjustable speed AC motor. Such data are not within
the capabilities of harmonic analyzers and transient-disturbance recorders. Digital
storage oscilloscopes have the ability to capture and store waveform data for later
use. Using multiple-channel, digital storage oscilloscopes, more than one electrical
parameter may be viewed and stored. Figure 9.8 shows the noise in the ground grid
of a microchip manufacturing facility that could not be detected using other instru-
mentation. The noise in the ground circuit was responsible for production shutdown
at this facility.
43 0.103 101.31 0.747
44 0.045 153.435 0.328
45 0.082 330.255 0.591
46 0.136 228.013 0.986
47 0.043 45 0.311
48 0.152 53.13 1.099
49 0.064 251.565 0.463
50 0.02 270 0.147
51 0.133 278.746 0.964
52 0.086 315 0.622
53 0.125 345.964 0.906
54 0.132 274.399 0.956
55 0.032 341.565 0.232
56 0.045 116.565 0.328
57 0.162 90 1.173
58 0.136 131.987 0.986
59 0.064 288.435 0.463
60 0.154 336.801 1.116
61 0.165 47.49 1.193
62 0.122 221.634 0.882
63 0.051 143.13 0.366
Note:
Total harmonic distortion = 18.7%.
a
Phase A current harmonics, June 27, 2001, 08:57:27.
TABLE 9.2 (CONTINUED)
Current Harmonic Spectrum for a Lighting Panel Supplying
Fluorescent Lighting
a
Harmonics RMS Value Phase % of Fundamental
© 2002 by CRC Press LLC
Selection of voltage probes is essential for proper use of oscilloscopes. Voltage
probes for oscilloscopes are broadly classified into passive probes and active probes.
Passive probes use passive components (resistance and capacitance) to provide the
necessary filtering and scale factors necessary. Passive probes are typically for use
in circuits up to 300 VAC. Higher voltage passive probes can be used in circuits of
up to 1000 VAC. Most passive probes are designed to measure voltages with respect
to ground. Passive probes, where the probe is isolated from the ground, are useful
for making measurements when connection to the ground is to be avoided. Active
probes use active components such as field effect transistors to provide high input
impedance to the measurements. High input impedance is essential for measuring
low-level signals to minimize the possibility of signal attenuation due to loading by
the probe itself. Active probes are more expensive than passive probes. The high-
frequency current probe is an important accessory for troubleshooting problems
FIGURE 9.3
Three-phase harmonic and disturbance analyzer for measuring voltage and
current harmonics, voltage and current history over a period of time, voltage transients, and
power, power factor, and demand. (Photograph courtesy of Reliable Power Meters.)
© 2002 by CRC Press LLC
using an oscilloscope. By using the current probe, stray noise and ground loop
currents in the ground grid can be detected.
9.2.4 D
ATA
L
OGGERS
AND
C
HART
R
ECORDERS
Data loggers and chart recorders are sometimes used to record voltage, current,
demand, and temperature data in electrical power systems. Data loggers and chart
FIGURE 9.4
Current waveform and current history graph at a lighting panel supplying
fluorescent lighting.
© 2002 by CRC Press LLC
recorders are slow-response devices that are useful for measuring steady-state data
over a long period of time. These devices record one sample of the event at prede-
termined duration, such as 1 sec, 2 sec, 5 sec, etc. The data are normally stored
within the loggers until they are retrieved for analysis. The data from data loggers
and chart recorders are sufficient for determining variation of the voltage or current
at a particular location over an extended period and if there is no need to determine
instantaneous changes in the values. In some applications, this information is all
that is needed. But, in power quality assessments involving transient conditions,
these devices are not suitable. The advantage of data loggers is that they are relatively
inexpensive compared to power quality recording instrumentation. They are also
easier to set up and easier to use. The data from the device may be presented in a
text format or in a graphical format. Figure 9.9 is the recording of current data at
the output of a power transformer using a data logger. The data were produced at
the rate one sample every 5 sec. Data loggers and chart recorders are not intended
for installation directly on power lines. They are designed to operate using the low-
level output of suitable voltage, current, or temperature transducers; however, care
should be exercised in the installation and routing of the wires from the transducers
to ensure that the output of the transducers is not compromised due to stray noise
pickup. Also, data loggers and chart recorders do not provide information about the
waveshape of the measured quantity. If that level of information is needed, a power
quality analyzer should be used instead.
FIGURE 9.5
Switching transient disturbance with a peak of 562 V and a frequency content
of 20 kHz.
© 2002 by CRC Press LLC
9.2.5 T
RUE
RMS M
ETERS
The term
true
RMS
is commonly used in power quality applications. What are true
RMS meters? As we saw in previous chapters, the RMS value of the current or
voltage can be substantially different from the fundamental component of the voltage
or current. Using a meter that measures average or peak value of a quantity can
produce erroneous results if we need the RMS value of the waveform. For waveforms
rich in harmonics, the average and peak values would be considerably different than
waveforms that are purely sinusoidal or close to sinusoidal. Measuring the average
or peak value of a signal and scaling the values to derive a RMS value would lead
to errors.
For example, consider a square wave of current as shown in Figure 9.10. The
average and peak reading meters indicate values of 111 A and 70.7 A RMS current,
respectively. The square waveform has an average value of 100 A. The peak value
of the waveform also has a value of 100 A. In order to arrive at the RMS value, the
100 A average value is multiplied by 1.11, The ratio between the RMS and the
average value of a pure sinusoidal waveform is 1.11. The peak reading meter would
read the 100 A peak value and multiply it by 0.707 to arrive at the RMS value of
70.7 A, with 0.707 being the ratio between the RMS value and the peak value of a
pure sinusoid waveform. The disparities in the values are quite apparent. Figure 9.10
also shows a triangular waveform and the corresponding current data that would be
reported by each of the measuring instruments.
FIGURE 9.6
Current transformer saturation resulting in the loss of vital peak current
information.
© 2002 by CRC Press LLC
Analog panel meters give erroneous readings when measuring nonsinusoidal
currents. Due to higher frequency components, analog meters tend to indicate values
that are lower than the actual values. The presence of voltage and current transform-
ers in the metering circuit also introduces additional errors in the measurements.
True RMS meters overcome these problems by deriving the heating effect of
the waveform to produce an accurate RMS value indication. After all, RMS value
represents the heating effect of a voltage or current signal. Most true RMS meters
do not provide any indication of the waveform of the quantity being measured. To
accomplish this, the meters require high-frequency signal sampling capability. The
sampling rate should satisfy Nyquist criteria in order to produce reasonably accurate
results. Some benchtop RMS meters do have the sampling capability and ports to
send the information to a computer for waveform display.
9.3 POWER QUALITY MEASUREMENTS
The first step in solving power quality problems is to determine the test location or
locations. Even the best available power quality instrumentation is only as good as the
personnel using it. Setting up instrumentation at a location that is not optimum with
respect to the affected equipment can yield misleading or insufficient information.
Electrical transients are especially prone to errors depending on the type of the instru-
ment used and its location. The following example might help to make this point clear.
FIGURE 9.7
Pulse-width-modulated waveform from an adjustable speed drive output.
© 2002 by CRC Press LLC
FIGURE 9.8
Electrical noise in the ground grid of a computer center at a microchip manu-
facturing plant.
FIGURE 9.9
Current data from a data logger for one month of tests.
© 2002 by CRC Press LLC
Example:
A large mainframe printing machine was shutting down randomly
with no apparent cause. The machine was installed in a computer data center
environment and was supplied from an uninterruptible power source (UPS) located
about 10 ft from the machine. The power cord from the UPS to the printer was a
15-ft, three-conductor cable. Simultaneous measurement of power quality at the
printer input terminals and the UPS terminals supplying the printer revealed that,
while transients were present at the machine, no corresponding transients were
evident at the UPS. In this case, the 15 ft of cable was sufficient to mask the transient
activity. It was determined that the transients were caused by the printer itself due
to its large current inrush requirement during the course of printing. The printer
contained sensitive voltage detection circuitry which was causing the printer to shut
down. To take care of the problem, inline filters were installed at the printer input
which reduced the transient amplitudes to levels that could be lived with. In this
case, if the power quality measurement instrument had been installed at the UPS
output only, the cause of the problem would have gone undetected.
The best approach to investigating power quality problems is to first examine
the power quality to the affected equipment at a point as close as possible to the
equipment. If power quality anomalies are noticed, then move upstream with a
process-of-elimination plan. That is, at each location determine if the problem is
due to load-side anomalies or line-side problems. Even though this process is time
consuming and perhaps cost ineffective, valuable information can be obtained.
Understanding and solving power quality problems is rarely quick and easy.
FIGURE 9.10
Variation in rms measurements when using different types of meters.
100 A
100 A
TRUE RMS METER = 100 A
AVERAGE READING METER = 111 A
PEAK DETECTING METER = 70.7 A
TRUE RMS METER = 57.7 A
AVERAGE READING METER = 55.5 A
PEAK DETECTING METER = 70.7 A
SQUARE WAVE
TRIANGULAR WAVE
© 2002 by CRC Press LLC
9.4 NUMBER OF TEST LOCATIONS
If at all possible, power quality tests should be conducted at multiple locations
simultaneously. The data obtained by such means are useful in determining the
nature of the power quality problem and its possible source as quickly as possible.
If simultaneous monitoring is not feasible due to cost or other factors, each location
may be individually monitored, taking care to ensure similar operating environments
for testing at each location to allow direct comparison of information. The number
of test locations would depend on the nature of the problem and the nature of the
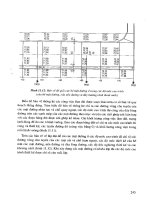
affected equipment. For example, in Figure 9.11, if power quality problems are
observed at location C and not at B, it is not necessary to monitor A. On the other
hand, if problems are noticed at C and B, then location A should be tested as well
as location D, if necessary. The experience of the power quality engineer becomes
important when trying to resolve the different scenarios. For a large facility with
multiple transient sources and susceptible equipment, the challenge can be immense.
9.5 TEST DURATION
Deciding upon the length of time that each test point should be monitored for
adequate data collection is something that even a well-trained engineer has to
struggle with at times. Ideally, you would want to continue tests until the actual
cause shows up. This is not always feasible, and the approach can be quite costly.
In power quality tests, you are looking not only for the actual failure mode to repeat
itself (which would be ideal) but also for any event that might show a tendency
toward failure.
Example:
The main circuit breaker for a large outlet store would trip randomly.
Each occurrence was accompanied by a loss of revenue, not to mention customer
dissatisfaction. To determine the cause, the three-phase currents as well as the sum
of the phase and the neutral currents were monitored for 3 days. Even though no
trips were produced during the time, appreciable phase-neutral residual current was
noticed. The sum of the phase and the neutral currents should be zero except in case
of a phase-to-ground fault. The problem was traced to a power distribution panel
where the neutral bus was also bonded to ground, resulting in residual currents at
the main switchboard. Under certain loading conditions, the residual current was
high enough to cause the main circuit breaker to trip in a groundfault mode. Once
this situation was corrected, the facility experienced no more breaker trips at the
main. This is an example of how a particular power quality problem can lead to a
solution even when the failure mode cannot be repeated during testing.
Another problem encountered by the author involved trips on a solid-state motor
starter, which indicated that the problem was due to a ground fault. The circuit was
monitored for a month before any indication of stray ground currents (Figure 9.12)
was noticed. If the tests had been discontinued after a week or so, the cause of the
trips would have gone undetected, which again emphasizes how difficult it can be
to solve power quality problems.
© 2002 by CRC Press LLC
As a general rule, it is necessary to test each location for at least one week unless
results definitely indicate power quality issues at the location that could be causing
problems. In such a case, the interval could be shortened. Most power quality issues
or tendencies present themselves within this time frame. The actual test durations
depend on the experience of the power quality engineers and their comfort level for
deriving conclusions based on the data produced. Test duration may be shortened if
different power system operating conditions that can cause power system distur-
bances can be created to generate an adequate amount of data for a solution. Once
again, an experienced power quality engineer can help in this process. It is also
important to point out that using power quality tendencies to generate conclusions
can be risky. This is because under certain conditions more than one power quality
problem can produce the same type of symptoms, in which case all possible scenarios
should be examined.
Example:
A solid-state motor starter was tripping during startup of the motor.
Power quality measurements indicated large current draw during the startup. The
FIGURE 9.11
Test locations for power quality instrumentation.
M
C
B
D
A
© 2002 by CRC Press LLC
trips were thought to be due to the starting currents, which exceeded the setting of
the starter protection. The actual cause, however, was severe undervoltage conditions
produced during startup. The source feeding the starter was not a rigid circuit,
causing a large voltage drop during motor start. The excessive current draw was due
to severe undervoltage conditions. Once the source to the adjustable speed drive was
made rigid, the problem disappeared. In this example, measuring only the current
input to the adjustable speed drive would have led to inaccurate conclusions.
9.6 INSTRUMENT SETUP
Setting up instruments to collect power quality data is probably the most critical
aspect of testing and also one that most often can decide the end results. Setting
up is a time when utmost care must be exercised. The first step is making sure to
observe certain safety rules. In the majority of cases, power to electrical equipment
cannot be turned off to allow for instrument setup. The facility users want as few
interruptions as possible, preferably none. Opening the covers of electrical switch-
boards and distribution panels requires diligence and patience. Personal protective
equipment (PPE) is an important component of power quality testing. Minimum
PPE should contain electrical gloves, safety glasses, and fire-retardant clothing.
While removing panel covers and setting up instrument probes it is important to
have someone else present in the room. The second person may not be trained in
FIGURE 9.12
Stray ground current at the output of a motor that caused the adjustable speed
drive to shut down. This event was not recorded until a month after the start of the test.
© 2002 by CRC Press LLC
power quality but should have some background in electricity and the hazards
associated with it. Figure 9.13 demonstrates the proper use of PPE for performing
power quality work.
9.7 INSTRUMENT SETUP GUIDELINES
Installing power quality instruments and probes requires special care. It is preferred
that voltage and current probe leads do not run in close proximity to high-current
cables or bus, especially if they are subjected to large current inrush. This can
inductively induce voltages in the leads of the probes and cause erroneous data to
be displayed. Voltage and current lead runs parallel to high-current bus or cable
FIGURE 9.13
Proper personal protective equipment (PPE), which is essential to performing
power quality instrument setup and testing. The photograph shows the use of fire-retardant
clothing, safety hat, and shoes. Safety glasses must be worn while connecting instrument
probes to the test point. The test location shown here is properly barricaded to prevent
unauthorized persons from entering the area.
© 2002 by CRC Press LLC
should be avoided or minimized to reduce the possibility of noise pickup. When
connecting voltage probes, the connections must be secure. Loose connections are
prone to intermittent contact, which can produce false indications of power quality
problems. Voltage and current probe leads should be periodically inspected. Leads
with damaged insulation or those that look suspect must be promptly replaced to
avoid dangerous conditions. While making current measurements, one of the main
causes of errors is improper closing of the jaws of the probe. Substantial errors in
current measurements and phase angles can be produced due to air gaps across the
jaws of the current probes.
It is important to keep the test location well guarded and secured to prevent
unauthorized access. The test locations must be secured with barrier tapes or other
means to warn people of the hazards. If power distribution panels or switchboards
are monitored, all openings created as the result of instrument setup should be sealed
to prevent entry by rodents and other pests. All these steps are necessary to ensure
that the tests will be completed without accidents.
9.8 CONCLUSIONS
Measurement of power quality requires the use of proper instrumentation to suit
the application. The user of the instrument must be well trained in the use and care
of the instrumentation. The engineer should be knowledgeable in the field of power
quality. Most importantly, the engineer should be safety conscious. All these factors
are equally important in solving power quality problems. As indicated earlier, power
quality work requires patience, diligence, and perseverance. It is very rare that the
solution to a problem will present itself accidentally, although it does happen
occasionally. Power quality work has its rewards. One that the author cherishes the
most is the satisfaction of knowing that he has left clients happier than when he
first met them.