Designing Capable and Reliable Products Episode 1 Part 6 pdf
Bạn đang xem bản rút gọn của tài liệu. Xem và tải ngay bản đầy đủ của tài liệu tại đây (3.16 MB, 20 trang )
table (see Appendix VI) for later mechanical deformation, the risk index, a
p
, is:
A (automated process) A 1.0
B (medium skill level) B 1.3
C (poor access) C 1.6
D (pressure used for deformation) D 1.2
E (no heat applied) E 1.0
F (one stage operation) F 1.0
For the bending the tab washer operation, the Additional Assembly Variability Risk
is given by:
a
p
A ÂB ÂC ÂD ÂE ÂF
a
p
2:5
Therefore,
q
a
5 2:5
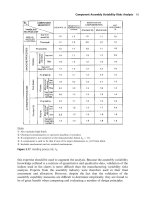
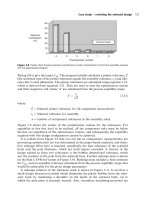
A completed variability risks result table for the ®xing bolt assembly is shown in
Figure 2.30, highlighting the assembly variability risks only. The risk indices can
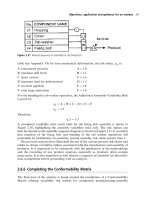
then be entered on the assembly sequence diagram as shown in Figure 2.31. It is evident
that insertion of the ®xing bolt and bending of the tab washer operations will
potentially be problematic on assembly, scoring assembly risk values greater than 2.
The previous sections have illustrated the use of the various process risk charts and
tables to obtain variability indices associated with the manufacture and assembly of
products. It is important to be systematic with the application of the methodology
and the recording of any product analyses, especially as products often contain
many parts. It is also important to ®rst declare a sequence of assembly for the indivi-
dual components before proceeding with an analysis.
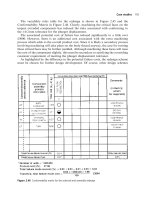
2.6.6 Completing the Conformability Matrix
The ®nal part of the analysis is based around the completion of a Conformability
Matrix relating variability risk indices for component manufacturing/assembly
Figure 2.31
Revised sequence of assembly for the ®xing bolt
Objectives, application and guidance for an analysis 85
processes to potential failure modes, their severity and the costs of failure. A blank
Conformability Matrix is provided in Appendix VII. The ®nal results of an
analysis are best displayed in the Conformability Matrix to provide a traceable
record of the costs of failure and how these costs are related to the conformance
problems through the design decisions made. The symbols, shown in Figure 2.32,
are placed in the nodes of the Conformability Matrix, and represent the levels of
design acceptability obtained with reference to the Conformability Map given in
Figure 2.22.
The link with FMEA brings into play the additional dimension of potential vari-
ability into the assessment of the failure modes and the eects on the customer.
The Conformability Matrix also highlights those `bought-in' components and/or
assemblies that have been analysed and found to have conformance problems and
require further communication with the supplier. This will ultimately improve the
supplier development process by highlighting problems up front.
Once the variability risks, q
m
and q
a
, have been calculated, the link with the
particular failure mode(s) from an FMEA for each critical characteristic is made.
However, determining this link, if not already evident, can be the most subjective
part of the analysis and should ideally be a team-based activity. There may be
many component characteristics and failure modes in a product and the matrix
must be used to methodically work through this part of the analysis. Past failure
data on similar products may be useful in this respect, highlighting those areas of
the product that are most aected by variation. Variation in ®t, performance or
service life is of particular interest since controlling these kinds of variation is most
closely allied with quality and reliability (Nelson, 1996).
For each q
m
and q
a
risk value and the Severity Rating (S), a level of design accept-
ability is determined from where these values intersect on the Conformability Map.
The symbols, relating to the levels of design acceptability, are then placed in the
nodes of the Conformability Matrix for each variability risk which the failure
mode is directly dependent on for the failure to occur. Once the level of design accept-
ability has been determined, it can then be written on the Conformability Matrix in
the `Comments' section. C
pk
values predicted or comments for suppliers can be
added too, although predicted C
pk
values can also be written in the variability risks
results table.
Figure 2.32
Conformability matrix symbols and their quanti®cation
86 Designing capable components and assemblies
Figure 2.33
Conformability matrix example
Objectives, application and guidance for an analysis 87
Example ± determining the failure costs for product design
We will now consider calculating the potential costs of failure in more detail for the
cover support leg shown earlier. The process for calculating the failure costs for a
component is as follows:
. Determine the value of q
m
or q
a
. Obtain an FMEA Severity Rating (S)
. Estimate the number of components to be produced (N)
. Estimate the component cost (Pc).
For example, the characteristic dimension `A' on the cover support leg was critical to
the success of the automated assembly process, the potential failure mode being
a major disruption to the production line. An FMEA Severity Rating S8is
allocated. See a Process FMEA Severity Ratings table as provided in Chrysler
Corporation et al. (1995) for guidance on process orientated failures. The component
cost, Pc £5.93 and the number planned to be produced per annum, N 50 000.
The characteristic was analysed using CA and q
m
was found to be 9. The values of
q
m
9 and S 8 are found to intersect on the Conformability Map above the 10%
isocost line. (If they had intersected between two isocost lines, the ®nal isocost value is
found by interpolation.) If there is more than one critical characteristic on the com-
ponent, then the isocosts are added to give a total isocost to be used in equation 2.15.
The total failure cost is determined from:
Total failure cost
isocost7ÂN Â Pc
100
(2.15)
Total failure cost
10 Â 50 000 Â 5:93
100
£29 650
This ®gure is of course an estimate of lost pro®t and may even be conservative, but it
clearly shows that the designer has a signi®cant role in reducing the high costs of
failure reported by many manufacturing companies. The results are repeated in the
Conformability Matrix in Figure 2.33.
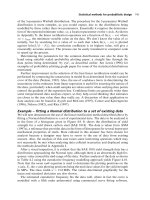
2.7 Case studies
2.7.1 Electronic power assisted steering hub design
Under this heading, a ¯exible hub design for an automotive steering unit is analysed.
The application of CA resulted from the requirement to explain to a customer how
dimensional characteristics on the product, identi®ed as safety critical, could be
produced capably. A key component in this respect is the hub. The component is
made by injection moulding, the material being un®lled polybutylene terephthalate
(PBT) plastic. The moulding process was selected for its ability to integrate a
number of functional elements into a single piece and reduce assembly costs. The
design outline of the hub is shown in Figure 2.34(a) together with an optical plate
that is mounted on it.
88 Designing capable components and assemblies
Figure 2.34(b) shows a line from the design FMEA related to the plastic
moulded hub. It gives the component function, the potential failure mode, the
potential eects and potential causes of failure. In addition, the columns of current
controls, Occurrence (O), Severity (S), Detectability (D) ratings and associated
Risk Priority Number (RPN) have been completed. A high severity rating was
given (S 8) since faulty positional readings due to out of tolerance variation
could cause loss of car control and driver injury. The Detectability was rated at
D 8 because complex inspection processes would be required. The possibility
of Occurrence was provisionally estimated at O 4, giving an RPN equal to
256. The design FMEA speci®es compatible dimensioning as the current control
to avoid failure, and it was this aspect of the design that needed to be explored
further. A quotation from a supplier had been received for volume production
of the component.
Some detail on the analysis of the hub design is given below. The hub performed
several functions in the controller and therefore carried several critical characteristics.
The positional tolerance of the recesses to accommodate a system of location pegs
needed to be close. Faces on the hub for mounting the optical plate required precise
positioning to provide the necessary spacing between two optical grids (one mounted
on the hub and the other carried on a torsion shaft). The depth of the moulded
recesses needed to be controlled as they were part of a tolerance chain. It is important
to note that the recesses and faces were in dierent planes and the depth was across a
mould parting line.
The positional tolerance on a 10 mm dimension was Æ0:1 mm (tol
1
), providing an
angular position of 0.68. Additionally, the widths of the recesses needed to be held to
4 Æ 0:08 mm (tol
2
), the dimensional tolerance on the faces to 1 Æ 0:07 mm (tol
3
)and
the depth to 10 Æ0:12 mm (tol
4
). Also, the thin sections of the hub gave two geome-
trical concerns as these vanes were on the limits of plastic ¯ow and distortion was
likely on cooling.
The results of the analyses carried out by the business on the hub are given in the
variability risks table shown in Figure 2.34(c). The four critical characteristics
described above were examined. The positional tolerance (tol
1
) set across the thin
vanes resulted in high geometry to process risk (g
p
) and gave q
m
9. This equates
to an out of control C
pk
, as does the q
m
value for the recess depth across the
mould parting line (tol
4
) which came to 8. The q
m
scores for the characteristics tol
2
and tol
3
suggest initially that the process will be in control giving estimated C
pk
values of 1.33 and 1.75 respectively.
Following the completion of the variability risks table, a Conformability Matrix
was produced. This was used to relate the failure modes and their severity coming
out of the design FMEA to the results of the Component Manufacturing Variability
Risk Analysis. The portion of the matrix concerned with the moulded hub can be
found in Figure 2.34(d) and was completed using the Conformability Map.
It is evident that the two characteristics described earlier as being out of control,
tol
1
and tol
4
, give costs of failure greater than 10%. Also, the characteristics tol
2
and tol
3
which may have been regarded as having acceptable C
pk
values are shown
to have costs of failure of greater than 10% and 0.2% respectively, due to the high
Severity Rating S8 for the potential failure modes in question. Note that two
additional failure modes are also illustrated.
Case studies 89
90 Designing capable components and assemblies
Figure 2.34
Hub analysis results
Case studies 91
The analysis indicated that the conformance problems associated with the hub
design had a cost of failure of more than 30%. This would represent at the annual
production quantity required and target selling price, a loss to the business of several
million pounds. As a result of the study the business had further detailed discussions
with their suppliers and not surprisingly it turned out that the supplier would only be
prepared to stand by its original quotation provided the tolerances on the hub,
discussed above, were opened up considerably (more than 50%). Subsequently, this
result supported the adoption of another more capable design scheme.
2.7.2 Solenoid security cover
This case study concerns the initial design and redesign of a security cover assembly
for a solenoid. The analysis only focuses on those critical aspects of the assembly of
the product that must be addressed to meet the requirement that the electronics inside
the unit are sealed from the outside environment. An FMEA Severity Rating (S) for
the assembly was determined as S 5, a warranty return if failure is experienced.
Cover assembly initial design
The initial design of the cover assembly as shown in Figure 2.35 uses an O-ring to seal
the electronics against any contamination. Concerns were raised about three mains
aspects of the assembly, these being:
. The compression of the O-ring may work against the needs of an adhesive cure on
®nal assembly with an end unit.
. There is a risk that the O-ring will not maintain its proper orientation in the cover
recess during subsequent assembly processes, and therefore may not be correctly
positioned on ®nal assembly. Restricted vision of the inside of the cover is the
key problem here.
. The wire cable may present problems using either manual or automated assembly.
The analysis in Figure 2.35 shows that there is a high risk of non-conformance for the
insertion of the frame into the cover, the process relying on the position of the O-ring
being maintained (operation a8). The situation is complicated by the restriction of
vision during O-ring placement, and this is re¯ected in the analysis. Using the
Conformability Map, it is possible to calculate the potential failure costs for this
design scheme in meeting the sealing integrity requirement, as documented in the
Conformability Matrix. The ®nal failure cost is calculated to be £805 000. This
potential failure cost for this single failure mode is far too high, representing over
10% of the total product cost. A more reasonable target value would be less than
1%. An alternative design scheme should be developed, focusing on reducing the
risks of the ®nal assembly operation to reduce the potential for non-conformance
as highlighted by the analysis.
Cover assembly redesign
Unfortunately, the design of the wire could not be changed to a more simple arrange-
ment, for example using a spade connector integrated with a recess for the O-ring. The
wire is part of the customer's requirements and will inevitably present problems using
92 Designing capable components and assemblies
Figure 2.35
Cover assembly design analysis
Case studies 93
either manual or automatic assembly operations. Looking to the O-ring, a better
design would be to eliminate it altogether and integrate the seal with the wire as
shown in Figure 2.36. The wire is then positively located with the seal in the
cover hole. Clearly, the risks associated with the cover assembly have been reduced
Figure 2.36
Cover assembly redesign analysis
94 Designing capable components and assemblies
following the elimination of one positionally unstable component and its integration
with another. Again, with an FMEA S5, and referring to the Conformability
Map, isocosts for each assembly variability risk can be evaluated and the total failure
cost is calculated to be £7000.
Comparing this value with the initial design's high potential cost of failure, it is
evident that a major design fault in the cover has been eliminated although the assem-
bly process must remain within special control. Subsequently, the redesign solution
was chosen for further design development.
2.7.3 Telescopic lever assembly
Consider the telescopic lever assembly, Design A in Figure 2.37, which is part of a
stretcher, and hence safety critical. The assembly has an FMEA Severity Rating
S8, and is used in a product having a cost of £150. It is estimated that 5000
units are produced per annum. The assembly is subjected to bending in operation,
with the maximum bending stresses occurring at a point on the main tube correspond-
ing to the stop ring recess. In order to provide additional support, a reinforcing tube is
positioned as shown. It is crucial that the tube is placed where it is, since fracture of
the telescopic lever may result in injury to users and third parties. Figure 2.37 shows
part of the results from the Conformability Matrix for Design A. At each node in the
matrix, consideration has been given to the eect of the component or assembly
variability risk, represented by q
m
or q
a
, on the failure mode in question determined
from an FMEA.
While the design is satisfactory from a design for strength point of view, the
analysis highlights a number of areas where potential variability and failure severity
combine to make the risks unacceptably high. For example, there are no design
features which ensure the positioning of the reinforcement tube in the assembly
(assembly process a3 in Figure 2.37). There are also several critical component
tolerances which need to be controlled if its position is to be maintained in service,
such as the inner diameter of the main tube, c1, the outside diameter of the reinforce-
ment tube, c2, and the application of the adhesive, a2.
The conclusion from the analysis is that the assembly should be redesigned. This is
further justi®ed by calculating the potential costs of failure for the assembly. If this
design of telescopic lever assembly fractured in service, user injury, high losses,
including legal costs, could be incurred. A cost of failure of £257 000 was calculated
from the analysis, which is far too high representing more than 36% of annual
revenue from the product. This ®gure was calculated by summing the isocosts for
each characteristic/assembly process whose variability risks potentially contribute
to each failure mode, and then multiplying the total failure mode isocost (%) by
the product cost and number of items produced. The calculation of the costs for
the second failure mode type (reinforcing tube moves out of position) on Design A
is shown in detail in Figure 2.37.
Failure of this design in service did in fact result in user injury. High losses of the
order of those calculated above for the particular failure mode, including legal costs,
were incurred. A number of alternative designs are possible, and one which does not
involve the above problems is included with its Conformability Matrix in Figure 2.38.
Case studies 95
Figure 2.37
Telescopic lever assembly analysis for Design A
96 Designing capable components and assemblies
The costs of failure for this Design B were subsequently reduced to a negligible
amount.
The above example demonstrates the use of CA in supporting the identi®cation of
manufacturing and assembly problems before production commences, but more
importantly safety problems can be systematically identi®ed and the potential for
harm eliminated before the product is in use by the customer. Given the huge
losses that are associated with safety critical products when they fail, considerations
of this type must be on the agenda of all manufacturing companies, especially when
the product has a high degree of interaction with the user.
2.7.4 Solenoid end assembly
The following case study determines the manufacturing and assembly variability risks
for a solenoid end assembly design, shown in Figure 2.39, and projects the potential
Figure 2.38
Telescopic lever assembly analysis for Design B
Case studies 97
costs of failure associated with the capability of an assembly tolerance stack. The
solenoid is to operate as a fuel cut-o device in a vehicle, operated when a signal is
received from the ignition. The signal allows current to ¯ow to the inductor coil
which then withdraws the plunger seal and allows the fuel to ¯ow. The solenoid
assembly is to be screwed into an engine block at the fuel port in a counterbored
hole. An important requirement is that the plunger displacement from the engine
block face through the solenoid tolerance stack to the plunger seal face must be
within a tolerance of Æ0:2 mm. If this requirement is not met, fuel ¯ow restriction
could occur, this being the main failure mode. The product will be in the warranty
return category as it has little eect on user safety if it fails in service, which relates
to an FMEA Severity Rating S5. The product cost is £7.66 and it is estimated
that one million units will be manufactured in total.
Solenoid end assembly initial design
The initial design is analysed using CA at a component level for their combined
ability to achieve the important customer requirement, this being the tolerance of
Æ0:2 mm for the plunger displacement. Only those characteristics involved in the
tolerance stack are analysed. The `worst case' tolerance stack model is used as
directed by the customer. This model assumes that each component tolerance is
at its maximum or minimum limit and that the sum of these equals the assembly tol-
erance, given by equation 2.16 (see Chapter 3 for a detailed discussion on tolerance
stack models):
n
i 1
t
i
t
a
2:16
where:
t
i
bilateral tolerance for ith component characteristic
t
a
bilateral tolerance for assembly stack:
Figure 2.40 shows the initial detailed design including the tolerances required on each
component in the stack to achieve the Æ0:2 mm assembly tolerance, t
a
(not included is
the dimensional tolerance on the fuel port block of 12 Æ 0:05 mm which is set by the
Figure 2.39
Solenoid end assembly
98 Designing capable components and assemblies
supplier). Also shown is a table describing the process used to manufacture each
component and an assembly sequence diagram is given in Figure 2.41. Referring
back to Figure 2.40, the tolerance stack starts at face A on the fuel port and accumu-
lates through the individual components to face B on the plunger seal.
Figure 2.40
Solenoid end assembly initial design
Case studies 99
Figure 2.41
Assembly sequence diagram for the solenoid end assembly design
100 Designing capable components and assemblies
The body is impact extruded from a cold forming steel. The characteristic dimen-
sion to be analysed in the tolerance stack is the base thickness of 3 mm (on a 120 mm
bore) and this dimension has been assigned a tolerance of Æ0:02 mm.
Following the tolerance stack through the end assembly, the bobbin dimension of
22 mm from the outside face to the back face of the magnetic pole is analysed next.
This characteristic dimension does not include the tolerance on the impact extruded
pole. The pole is to be moulded into the bobbin and the pole face is considered to be
part of a mould related dimension. The bobbin is injection moulded using 30% ®lled
polybutylene terephthalate (PBT). The tolerance assigned to the bobbin dimension is
Æ0:035 mm.
Figure 2.42
Variability risks analysis for the solenoid end assembly initial design
Case studies 101
The pole has a characteristic dimension of 8 mm from the rear of the bobbin to the
recess face and has a tolerance assigned to it of Æ0:02 mm. From the pole recess face,
the tube base tolerance is the last component to make up the tolerance stack. The
brass tube has been given a dimensional tolerance on its base of 0:2 Æ 0:025 mm.
Note, the dimensional tolerance on the plunger is 28 Æ 0:05 mm, but the analysis
will concentrate on the silicone rubber seal length of 6 mm because this is moulded
onto the plunger and again is a mould related dimension.
Figure 2.42 shows the variability risks analysis based on the tolerances assigned to
meet the Æ0:2 mm tolerance for the assembly. Given that an FMEA Severity Rating
S5 has been determined, which relates to a `de®nite return to manufacturer',
both impact extruded components are in the unacceptable design region, as well
as the bobbin and plunger end seal as shown on the Conformability Matrix in
Figure 2.43. The tolerance for the brass tube base thickness has no risk and is an
acceptable design.
Figure 2.43
Conformability matrix for the solenoid end assembly initial design
102 Designing capable components and assemblies
The associated cost of failure for the solenoid end assembly is calculated to be over
£3 million for a product cost of £7.66 and production volume of one million units.
This ®gure is for the tolerance stack failure mode alone as this is most important
to the customer. Although the assembly variability risks are analysed, they are not
taken into account in the ®nal costs of failure. In conclusion, the process capabilities
Figure 2.44
Solenoid end assembly redesign
Case studies 103
of several characteristics in this tolerance stack are inadequate and will not meet the
customer's requirements consistently.
Solenoid end assembly redesign
This is similar to the initial design, but involving turning as a secondary process on the
body to improve a key tolerance capability as indicated in Figure 2.44. The body is
still impact extruded, but the face which mates with the fuel port block is machined,
together with a shoulder on the inside diameter. The front face of the pole, now fully
machined and assuming no component cost increase, is assembled up to the machined
shoulder on the body. Only the tolerances on the pole length, tube and plunger end
seal remain in the stack, reducing the number of components to ®ve.
Figure 2.45
Variability risks analysis for the solenoid end assembly redesign
104 Designing capable components and assemblies