Inspection Evaluation And Repair Of Steel structures Part 9 pot
Bạn đang xem bản rút gọn của tài liệu. Xem và tải ngay bản đầy đủ của tài liệu tại đây (194 KB, 10 trang )
EM 1110-2-6054
1 Dec 01
7-3
Figure 7-3. Two-stage CVN-K
Id
-K
Ic
correlation (°C = 5/9 (°F – 32); 1 psi-
in
.
= 1.099 kPa-
m
; 1 ft-lb = 1.36 J)
(3) A CVN-K
Ic
correlation that is valid at higher temperatures in the upper shelf region is given by
CVN
2
Ic
yy
K
= 0.646 - 0.0098
σσ
(7-3)
where
K
Ic
= MPa -
m
σ
y
= static yield stress in MPa
CVN = joules
(For non-SI units,
CVN
2
Ic
yy
K
= 5 - 0.05
σσ
EM 1110-2-6054
1 Dec 01
7-5
structure is framed similar to the standard tainter gate geometry as described by EM 1110-2-2702 with a
0.95-cm (3/8-in.) skin plate, C12 × 25 vertical ribs, two W30 × 118 horizontal girders, and W18 × 80 strut arm
frames. All connections are riveted except for the use of bolts at the strut arm-trunnion block detail. The gates
have Type J side seals and steel bottom seal details. The gates have a history of structural problems including
significant gate vibrations and buckled web and flange plates on the strut arm. No extreme loads or unusual
events had been reported since the last inspection. A change in operational practice was instituted to avoid
gate opening settings that cause structural vibration. Because of the history of problems at this site, a thorough
visual inspection was made previously on several gates.
(2) Inspection. An in-depth inspection was made of the gate with particular attention to the critical areas.
Weather conditions at the dam site during the inspection were sunny and warm. The examination was
conducted while water was being released from the gates. The following conditions were noted:
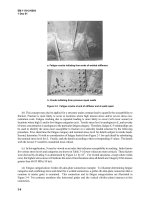
(a) Member or component deformation. Local web and flange plate buckling on the strut arms adjacent to
the knee brace intersection from the upper horizontal girder was visible on several gates and is most severe on
Gate 24. The condition has not deteriorated since the last inspection and was most likely caused by excessive
ice loads on the structure.
(b) Seal problems. Water was observed flowing through the side seals.
(c) Rivet deterioration. Corrosion and a small amount of section loss were visible on some rivet heads.
(d) Mechanical/electrical problems. At Gate 25, one chain hoist was out of its guide on the skin plate.
This hoist was toward the Minnesota side of the gate.
(e) Fabrication defects. There was no previous indication that fabrication defects existed in the structural
members, and none were observed during this inspection.
(f) Corrosion. Paint loss and blistering were visible along the top surface of the web on the upper
horizontal girder under the diversion plate. Blistered paint was left intact during the inspection.
(g) Fatigue cracking. No fatigue cracks were observed.
(h) Vibration or other unusual behavior. To check for vibration, the gate was fully closed and then
reopened approximately 3.0 cm (0.1 ft) when vibration began. By rough measurement, the vibration frequency
was estimated at 5-10 Hz. The amplitude of vibration was maximum at midspan of the gate and was sufficient
to create an audible noise and make ripples in the backwater. The vibration ceased when the gate was opened
further.
(i) Application of unusual loads. Except for the noted vibration, no unusual or extreme loads were
reported. There was, however, an extensive accumulation of debris on the structural members in back of the
skin plate, primarily large timber pieces.
(3) Evaluation. Because several detrimental conditions were detected during the inspection, the structural
integrity of the spillway gate must be evaluated.
(a) Since an evaluation of the local buckling of the strut arms was conducted when it was first observed
and the amount of buckling on the strut arms had not increased since the last inspection, it is believed that the
structural capacity of the buckled members or of the gate is not in jeopardy at this time.
EM 1110-2-6054
1 Dec 01
7-6
(b) The amount of water leakage from the side seals is considered tolerable and will have no effect on
normal gate operations.
(c) Misalignment of the chain hoist is not severe enough to jeopardize operation of the gate but should be
corrected.
(d) Deterioration due to corrosion and rivet head loss are considered minor and will have no effect on
normal gate operations or gate strength.
(e) Flow-induced structural vibrations can cause serious damage to the spillway gate. In previous studies,
stress ranges of approximately 27.6 MPa (4 ksi) have been calculated. Although this stress range is below the
41.4-MPa (6-ksi) threshold for fatigue crack growth at riveted details, the presence of groove welds to water-
seal gaps between adjacent skin plates and tack welds to attach the diversion plate to the gate ribs may reduce
this threshold stress range. However, since no fatigue cracks were detected and it is known how to control the
gate vibrations, the structural capacity is not in jeopardy.
(f) Although the accumulation of debris on the gate structure has not caused any structural or corrosion
problems, it should be removed.
(4) Recommendations. Based on the evaluation of conditions for the riveted tainter gates, the following
recommendations are provided as steps that should be taken to ensure structural integrity for normal operations
until the next regular inspection:
(a) Continue operation of the spillway gates outside the range that causes vibration.
(b) Schedule maintenance at Gate 25 to make repairs or adjustments to reinstall the chain hoist in the
guide on the skin plate.
(c) Schedule maintenance to remove large debris from all gate structures.
(d) The buckled strut arm members should be occasionally monitored by lock personnel to detect any
increases in deformation or distress to adjacent components.
(e) Gate vibrations should be monitored by lock personnel to detect any changes. The inspection interval
should be reduced to 2 to 3 years to monitor the buckled members and any future effects of the noted vibration
problem more closely.
b. Fatigue evaluation.
(1) To illustrate fatigue strength considerations, let it be assumed that during the inspection of tainter gates
a more significant mode of vibration had recently been observed. Because of this new information, a thorough
inspection was made at all fatigue-sensitive details on several gates where this vibration was observed.
However, no fatigue cracks were visible.
(2) Based on the inspection findings in this assumed example, a field study was recommended to deter-
mine the significance of these new vibrations. The results of the field study revealed that vibrations of
approximately five cycles per second or Hertz (Hz) were producing cyclic stresses of up to 55.2 MPa (8 ksi) at
several details on the riveted structure.
(3) The integrity of the riveted gate structure must be assessed by determining the fatigue strength of the
details that are subjected to these cyclic loads. Since the measured maximum stress range is less than
EM 1110-2-6054
1 Dec 01
7-7
68.9 MPa (10 ksi), the Category C curve will be used to determine the approximate number of cycles to failure
at the detail (this does not imply that the entire structure will fail). By projecting lines on the S
r
-N curve shown
in Figure 6-22, it can be determined that the number of cycles to failure is approximately 12.5 million. With
the measured frequency of vibration equal to 5 Hz, it would take approximately 694 hours (29 days) of
vibration at this stress range to exceed the fatigue strength of the riveted connection. But because this new
mode of vibration has only recently been observed, it is probable that not many cycles have accumulated to
date. In fact, unless the gates in this assumed example are allowed to vibrate for extended periods, it may take
up to 3-1/2 years before fatigue cracks develop if vibrations are limited to 1/2 hour per day while the gates are
being adjusted.
(4) The recommended action to address this assumed condition would consist of three steps:
• Minimize the occurrence of gate vibrations by operating outside the range causing vibration.
• Reduce the inspection interval to approximately 1 year and inspect a greater number of gates to ensure
that similar vibration is not occurring.
• Begin engineering studies to determine solutions to reduce the stresses caused by these vibrations.
c. Fracture evaluation example.
(1) During an inspection, a 9-cm (3.5-in.) crack was found on the downstream flange of a horizontal girder
on a tainter gate. The crack is an edge crack similar to that shown in Figure 6-10. Prior to the inspection, no
indication of damage had been reported. Since the cracked girder is a main framing element of the tainter gate,
an immediate assessment of its critical nature is required. The crack is near the midlength of the girder. The
girder flange is 35.6 cm (14 in.) wide and 3.8 cm (1.5 in.) thick.
(2) To evaluate this crack, a fracture analysis must be conducted. For this example, a linear-elastic
fracture mechanics (LEFM) analysis will be used. The first step in performing the analysis is to obtain data on
the three key parameters necessary for any fracture analysis: the crack size and geometry, the nominal stress in
the member or component σ, and the critical stress intensity factor, K
Ic
or K
c
.
(3) The crack size and the geometry have already been determined from the inspection. For an LEFM
analysis, the nominal member stress is required. For this case, the nominal girder flange stress can be deter-
mined from a plane frame analysis similar to that used in the design of tainter gate girders. An analysis showed
that the nominal girder flange stress in the vicinity of the crack was 117.2 MPa (17 ksi) in tension.
(4) The next step in the analysis is to determine the fracture toughness. A review of the hypothetical
design documents indicated that the gate had been fabricated from A36 steel. Since K
Ic
testing (ASTM E399)
of mild steels at reasonable service temperatures is impractical if not impossible, the fracture toughness will be
determined from correlations with CVN data. As a first estimate, published CVN data for A36 steel will be
used. This can be only an estimate, since K
Ic
values can vary significantly for the same type of steel. K
Ic
is also
very dependent on temperature, so a minimum operating temperature for the structure must be established.
Based on A36 steel CVN data (Barsom and Rolfe 1987), Figure 7-4 shows the approximation of K
Ic
as a
function of temperature. The curve on the left is calculated from the two-stage CVN-K
Id
-K
Ic
correlation (valid
for the lower shelf and the lower end of the transition region; see paragraph 7-1b), and the curve on the right is
from the upper shelf CVN-K
Ic
correlation (Equation 7-3). The heavy line of each curve indicates the range in
which the correlations are valid, as discussed in paragraph 7-1. The minimum service temperature for this
example is -31.6 °C (-25 °F). Since neither curve is valid at this temperature, an estimate for K
Ic
is determined
by linear interpolation between the two correlations as indicated by the dashed line in Figure 7-4. This
interpolation indicates that K
Ic
is approximately 62.6 Mpa-
m
(57 ksi-
.in
) at -31.6 °C (-25 °F).
Conservatively, an estimate of K
Ic
of 55 MPa-
m
(50 ksi-
.in
) is selected for use in the analysis.
EM 1110-2-6054
1 Dec 01
7-8
Figure 7-4. CVN-K
Ic
correlations (°C = 5/9 (°F – 32);
1 ksi-
.in
= 1.099 MPa-
m
)
(5) Since the crack size and geometry of detail are known and the stress level and material fracture
toughness have been estimated, the crack can be evaluated for fracture by calculating the stress intensity factor
and comparing to the fracture toughness. For a single-edge crack perpendicular to the stress field in a finite-
width plate, the stress intensity factor incorporating a factor of safety (FS), K
If
, is given by
•
b
FSa
k FSa 1.12 =
K
If
πσ
(7-7)
where
a = crack size
k = function of a and b
b = half-width of the plate
(Tabulated values for k and stress intensity factor formulas for other crack geometries are given in Chapter 6.)
For a factored crack length-to-plate half-width ratio of (a × FS)/b = (3.5 × 2)/7 = 1.0, k = 2.55, then
in ksi288m- MPa2502.55)2()09.0()2.117(12.1 = = =
K
If
•
π
(7-8)
Since K
If
is greater than K
Ic
= 54.95 MPa-
m
(50 ksi-
in.
), an unsafe condition exists for plane-strain condi-
tions. Checking the plane strain assumption with Irwin's β factor from Equation 2-2:
0.4 > 1.3
248
55
0.038
1
2
= =
Ic
β
(7-9)
EM 1110-2-6054
1 Dec 01
7-9
Since β
Ic
> 0.4, the plane-strain condition assumption is not valid and the fracture toughness is represented by
the critical stress intensity factor K
c
. Using Equation 7-6 to estimate K
c
(even though there is considerable
deviation from plane strain condition) gives
()
()
()()
()
()
22
22 2
2
1 1.4 1 + 1.4 1.29 10,072 MPa- m 8,324 ksi- in.
55
100 MPa- m 91 ksi- in.
250 MPa- m 228 ksi- in.
2
clc
Ic
c
If
c
K K + = =
K =
K < =
K
β
=⋅
(7-10)
(6) Since K
c
is less than K
If
, an unsafe condition exists. This indicates that an immediate repair plan
should be developed and implemented. If the repair will be costly and/or substantially affect the function of
the project, a more accurate analysis should be made. The analysis was based on an estimation of K
Ic
that may
not accurately reflect the plane-strain fracture toughness of the material, and the approximation of K
c
from K
Ic
introduces more uncertainty in the estimation of the fracture toughness of the girder flange. A more exact
analysis would require having tests conducted on the girder material so that a more accurate value of K
c
may be
obtained. A CTOD test, which can be used to estimate K
c
(Equation 7-5), would likely be most appropriate
because of the uncertainty in correlating CVN data at the service temperature. Alternatively, an elastic-plastic
fracture assessment can be performed as outlined in Chapter 6.
d. Lock gate fracture example. Cracks of various shapes were revealed on two tension members on a
lock gate by nondestructive testing inspection. One member has the cross-sectional dimensions of 10 cm
(4 in.) thick by 30.5 cm (12 in.) wide. The other member is 2.5 cm (1 in.) thick by 30.5 cm (12 in.) wide. The
crack types and shapes include single-edge crack; through-thickness center crack; surface crack along the
0.3-m (12-in.) side (a/2c = 0.1 and 0.2), and embedded circular cracks. The material properties at the
minimum service temperature of –1.1 °C (30 °F) were determined by material testing and are summarized as
follows:
σ
ys
= offset yield strength of 345 MPa (50 ksi)
!
ult
= 552 MPa (80 ksi)
E = 206,840 MPa (30,000 ksi)
K
Ic
= 66 MPa-
m
(60 ksi-
.in
)
K
Id
= 44 MPa-
m
(40 ksi-
.in
)
"
crit
= critical CTOD value of 0.0052 cm (0.002 in.) (static)
"
crit
= 0.0025 cm (0.001 in.) (dynamic)
From structural analysis, the maximum applied tensile stress is 207 MPa (30 ksi). For each cracked member,
the critical crack size will be determined for each cracking condition under static loading and dynamic loading,
respectively:
(1) Example for 10-cm (4-in.) by 30-cm (12-in.) plate:
EM 1110-2-6054
1 Dec 01
7-10
. = =
K
t
=
2
ys
Ic
2
Ic
360
345
66
10
11
σ
β
β
Ic
< 0.4; therefore, LEFM is applicable.
(a) Single-edge crack (see Figure 6-10):
1.12
I
a
Kak
b
σπ
=
where σ is the nominal stress.
a
C = 1.12 k
b
π
in Equation 6-1
Assume
(/) 1.0k a b =
. The critical discontinuity size is calculated as
)in (1.02 cm592
121
1
2
=
.
K
=
a
Ic
cr
σπ
(Equation 6-2 with no factor of safety)
(a/b) = 0.17 and k(a/b) = 1.06; therefore, iteration is needed for a
cr
and k(a/b). After iteration,
a
cr
= 2.34 cm (0.92 in.) (k(a/b) = 1.05). With FS = 2.0, a
cr
= 0.5 (2.34) = 1.17 cm (0.46 in.) for dynamic
loading:
)in230( cm 58.0
121
50
. . =
.
K
.
=
a
Id
2
cr
σπ
(b) Through-thickness center crack (Figure 6-8). Calculate the stress intensity factor:
2b
a
a
2b
a =
K
I
π
π
πσ
tan
Assume
tan 1.0
2b a
=
a2b
π
π
1
3.23 cm (1 27 in )
2
tan 1 02
2
2
Ic
cr
K
= = . .
a
ba
= .
ab
πσ
π
π
After iteration, a
cr
= 3.1 cm (1.22 in.). With FS = 2.0, a
cr
= 3.1/2 = 1.55 cm (0.61 in.) and for dynamic
loading,
05
0.71 cm (0 28 in )
2
Id
cr
.
K
= = . .
a
πσ
EM 1110-2-6054
1 Dec 01
7-11
(c) Surface crack along the 30.5-cm (12-in.) side (2c is the length of the surface crack along the slope of
the component; see Figure 6-15):
•
/2ac
= 0.1
112
207
06
345
IK
ys
a
= .
KM
Q
= = .
σπ
σ
σ
where Q is the flow shape parameter defined by Figure 6-14 and M
k
is a variable that describes the effect of a/t
on K
I
.
From Figure 6-14, Q = 1.02, assume M
k
= 1.0
)in04(1 cm 2.64
121
. . =
.
K
Q
=
a
Ic
2
cr
σπ
(a/t = 0.26; M
k
= 1.0)
With FS = 2.0, a
cr
= 2.64/2 = 1.32 cm (0.52 in.), and for dynamic loading,
05
0.58 cm (0 23 in )
112
2
Ic
cr
. Q
K
= = . .
a
.
πσ
• a/2c = 0.2
From Figure 6-14, Q = 1.24, assume M
k
= 1.0
3.2 cm (1 23 in.)
112
2
Ic
cr
Q
K
= = .
a
.
πσ
(a/t = 0.32; M
k
= 1.0)
With FS = 2.0, a
cr
= 3.2/2 = 1.6 cm (0.63 in.), and for dynamic loading,
2
05
0.71 cm (0 28 in )
112
Ic
cr
. Q
K
= = . .
a
.
πσ
(d) Embedded circular crack (see Figure 6-14).
Q
a
=
K
I
πσ
a/2c = 0.5; from Figure 6-14, Q = 2.4
with FS = 2.0,
05
2
Ic
cr
. Q
K
=
a
πσ
= 3.89 cm (1.53 in.)
EM 1110-2-6054
1 Dec 01
7-12
and for dynamic loading:
2
05
Ic
cr
. Q
K
=
a
πσ
= 1.73 cm (0.68 in.).
(2) Example for 2.5-cm (1-in.) by 30-cm (12-in.) plate:
=
K
t
=
ys
Ic
2
Ic
345
66
025.0
11
2
σ
β
= 1.46.
#
Ic
> 0.4; therefore, elastic-plastic fracture mechanics is applicable.
Determine the allowable discontinuity parameter
m
a
(paragraph 6-5b).
C =
a
y
crit
m
ε
δ
(Equation 6-4)
where ε
y
is the yield strain of the material
,
=
E
=
ys
y
843206
345
σ
ε
= 0.0017
60
345
207
. = =
ys
σ
σ
From Figure 6-20, C = 0.44
For static loading
0017.0
00520
440
.
. =
a
m
=1.32 cm (0.52 in.)
For dynamic loading
.
. =
a
m
0017.0
00250
440
= 0.65 cm (0.26 in.)
Critical crack lengths can be determined for various crack shapes from the allowable discontinuity
parameter
a
m
(paragraph 6-5b).
7-3. Example Fatigue Analysis
This example shows how to apply fatigue analysis to determine expected life given an initial flaw size a
i
. For
this case, consider an initial surface flaw of the type shown in Figure 6-15 with a/2c = 0.25. The member is a
10-cm- (4-in ) thick plate of ASTM A572/572M Grade 345 (50) steel. The critical stress intensity factor
(fracture toughness) K
Ic
of this steel is 66 MPa-
m
(60 ksi-
.in
) at the minimum service temperature.
a. The maximum stress level is 207 MPa (30 ksi) and the minimum stress is zero. A curve relating the
initial surface flaw size a
i
to number of cycles to failure N
p
will be developed. From Figure 6-15