Sổ tay kỹ sư cơ khí P16 pdf
Bạn đang xem bản rút gọn của tài liệu. Xem và tải ngay bản đầy đủ của tài liệu tại đây (1.1 MB, 18 trang )
72.1
WHAT
IS
TOTAL
QUALITY MANAGEMENT?
72.1.1
The
Traditional Approach
to
Quality
Before
considering
a
definition
of
Total Quality Management,
for
contrast let's review
the
traditional
approach
to
quality. During
the
Industrial Revolution,
a
major
change that allowed manufacturing
to
achieve
significant
efficiency
gains
was a
division
of
labor
for all
aspects
of
manufacturing work.
This approach,
led by
Frederick
W.
Taylor, advocated management
of
factory work
by
dividing
it
into simple, repetitive tasks that could
be
executed quickly
and
easily with
a
minimum
of
skill.
Mechanical
Engineers' Handbook,
2nd
ed., Edited
by
Myer
Kutz.
ISBN 0-471-13007-9
©
1998 John Wiley
&
Sons, Inc.
CHAPTER
72
TOTAL
QUALITY MANAGEMENT
AND
THE
MECHANICAL ENGINEER
R.
Alan
Kemerling
Staff Quality Systems
Engineer—New
Product
Development
Ethicon
Endo-Surgery,
Inc.
Cincinnati, Ohio
Jack
B.
ReVeIIe
Hughes Missile Systems Company
Tucson,
Arizona
72.1 WHAT
IS
TOTAL QUALITY
MANAGEMENT? 2159
72.1.1
The
Traditional Approach
to
Quality 2159
72.1.2
The New
Paradigm
of
Total Quality Management 2160
72.2
DEFINITIONS
OF
QUALITY 2160
72.3 WHAT
ARE THE
BENEFITS
FOR MY
COMPANY? 2161
72.4
HOW
WILL
IT
CHANGE
MY
ROLE?
2162
72.4.1
As a
Mechanical Engineer 2162
72.4.2
As a
Manager
of
Mechanical Engineers 2163
72.5 WHAT
ARE THE
TOOLS
OF
TOTAL
QUALITY
MANAGEMENT
AND HOW
DO
I USE
THEM?
2164
72.5.1 Technical
Tools
—
Quality
Function Deployment
(QFD)
2164
72.5.2 Technical
Tools—
Seven
Management
and
Planning
(7
MP)
Tools 2166
72.5.3
Technical
Tools—
Design
of
Experiments (DOE) 2168
72.5.4 Technical
Tools—
SPC,
SQC,
and 7 QC
2171
72.5.5
Technical
Tools—
Process
Capability
or
Validation
Studies 2172
72.5.6
Technical
Tools—
Other
TQM
Tools
2173
72.5.7
Cultural
/Social
Tools
—
Concurrent
Engineering 2173
72.5.8
Cultural
/Social
Tools-
Teams 2175
72.5.9
Cultural
/Social
Tools—
The
Variability Reduction
Process (VRP) 2175
72.6 SUMMARY 2176
Generally, Taylor's approach worked well
for the
time, making durable consumer items
affordable
for
many.
During
World
War II, the
Department
of
Defense pressed
for a
similar specialization
in the
quality
function
as a
means
to
assure
the
quality
of war
materials.
The
government's document
for
quality,
MIL-Q-9858,
specified
a
separate
and
independent quality department with
the
responsibility
to
plan,
audit,
and
assure that required quality levels were met. Usually, outgoing quality levels were
met by
significant
amounts
of
inspection
and
test
of the final
product. Goods
or
services that
did not
conform
to
requirements were made
to
conform (reworked)
or
scrapped. Other documents, such
as
MIL-STD-
105, specified
how to
sample
and
what decisions
to
make, based
on the
results
of
inspections.
Commercial
firms
have
often
followed this organizational approach, some even adopting government
inspection
standards.
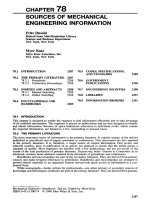
The
practical
effect
of
this organizational approach,
as
shown
in
Fig. 72.1,
was to
make
the
quality
of the finished
goods
or
services
the
responsibility
of the
quality department.
There
was
little
incentive
for any
other operation
in the
company
to be
concerned with quality.
After
all,
the
quality
department
was the
department paid
to find and fix
defective goods
or
services.
By
Frederick Taylor's logic, this arrangement still made sense. Quality engineers could improve
their ability
to
plan
for
quality, develop inspection
and
test plans,
and
direct inspection
staff.
However,
this
was one
area where division
of
labor
and
separation
of
responsibilities
did not
prove
to be the
most
efficient
approach
for the
entire enterprise, especially
as
products
and
services became more
and
more complex. First
of
all, inspection, particularly visual inspection,
is
never 100%
successful
in
catching defects.
As a
result, there were still dissatisfied customers
and
warranty
costs,
even with
significant
levels
of
inspection. Second,
it
became apparent
to
some far-sighted business leaders that
inspection
and
test were
not
adding value,
but
businesses were
in
fact
supporting
an
entire
"hidden
factory"
of
extra
floor
space, materials, labor,
and
machinery
to
take care
of
rework
and
scrapped
material. Some organizations paid
lip
service
to the
concept that "quality cannot
be
inspected
into"
the
product,
but few
made
an
attempt
to
change. Those that
did
began
to
grasp
the
fact
that
the
quality
of
goods
and
services,
as
perceived
by the
customer,
is a
function
of the
entire enterprise.
Hence,
the
entire enterprise must
be
engaged
in
planning
for
quality
and
delivering quality results.
As
suggested
in
Fig. 72.2,
it
will take
a
different
organizational approach
to
answer
the new
quality
requirements.
72.1.2
The New
Paradigm
of
Total
Quality Management
This insight leads
to a
review
of
Total Quality Management (TQM). First, here
is a
definition
of
TQM for
discussion purposes:
"Total
Quality Management
is an
evolving management philosophy
and
methodology
for
guiding
the
continuous improvement
of
products, processes
and
services
with
the
objective
of
realizing optimum customer value
and
satisfaction.
It
fosters
the
engagement
of
everyone
in the
enterprise
toward this
end."
1
As is
evident
from
the
definition,
TQM
departs
from
the
division
of
labor theory
of
Taylorism
to
assert that what
the
customer perceives
as
quality
is the
responsibility
of
everyone
in the
organization. This doesn't mean that
the
assembler
of the
engine
is
responsible
for the finish on the
hood
of the
car.
The
tools
of TQM
include methods
to
deploy
and
measure
appropriate quality characteristics
for
each operation
in the
organization.
72.2
DEFINITIONS
OF
QUALITY
Several
definitions
of
quality
have been used over
the
years. Following
are
some
of the
predominant
ones.
Leadership
.
izzI
zz
.
Design
Manufactur-
Quality
ing
Design
Economical Catch
all
performance
production defective
products
Responsibility
Fig.
72.1
Who has the
responsibility
for
quality?
Design
recognizes
the
responsbility
to
produce
a
design
that
can be
manufactured economically.
Manufacturing
recognizes
the
responsibility
to
develop
stable processes
and
maintain control.
Quality
audits
products
and
systems
to
foster
continuous
improvement.
Fig.
72.2
A
unified approach
is
needed.
•
Freedom
from
defects
2
•
Fitness
for
use
3
• The
totality
of
features
and
characteristics
of a
product
or
service that bear
on its
ability
to
satisfy
given
needs
4
• The
features
and
characteristics that delight
the
customer
5
A
review
of
these definitions will show
a
progression
from
a
narrow consideration
of the
absence
or
presence
of
defects
to a
more holistic consideration
of the
ability
of the
product
or
service
to
satisfy
the
customer. This progression parallels
the
evolution
of
quality management
from
just
the
manage-
ment
of
inspection
to
TQM.
72.3
WHAT
ARE THE
BENEFITS
FOR MY
COMPANY?
There
are
several
benefits
stemming
from
the
adoption
of an
active
and
effective
TQM
program.
These include:
•
Improved customer satisfaction
from
better products
and
services
•
Improved
profit
margins
from
reduced costs
•
Easier introduction
of new
products
and
services
•
Higher worker satisfaction
due to
involvement with improvement teams, integrated product
and
process development teams,
and
design
for
manufacture
and
assembly (DFMA) teams
These
are
strong claims,
but
they
can
easily
be
supported
by
data.
The first
study
to
address
the
effects
of TQM
application beyond
the
quality
of
products
and
services
was
conducted
by the
General
Accounting
Office
(GAO)
at the
request
of
Congressman Donald Ritter
(R—Pa).
6
This
study
looked
at
20
companies that received
a
site visit
for the
Malcolm
Baldrige
National Quality Award (MBNQA)
(see Chapter
73) in
1988
and
1989.
To
receive
a
site
visit
for the
MBNQA indicates that
the
company
is a
"finalist"
in
this assessment
of TQM
applications.
The GAO
study considered data (where available)
in
four
broad areas with
a
number
of
specific
elements
in
each:
(1)
employee relations,
(2)
operating procedures,
(3)
customer satisfaction,
and (4)
financial
performance.
In
each case,
the
available companies' data were analyzed
for
trends
from
the
time
the
company reported
it
started
its TQM
initiatives.
In
addition,
the
companies' data were
compared with metrics available
from
their specific industry.
The
results
are
shown
in
Fig. 72.3.
All
charts
are to the
same scale, represent average annual percent improvement,
and
have
the
results
stated
so
that
a
positive
bar
represents
a
favorable result
for the
company.
The
specific
elements
for
each area
are
printed under
the
bar.
In
the
area
of
employee-related
indicators,
the
survey
looked
at
employee satisfaction
(from
surveys),
attendance, turnover,
safety/health
(lost work days
due to
work-related
injury
and
illness),
and
suggestions
received.
These measures show
the
degree
of
personnel engagement
in TQM and
staff
response
to the
initiative.
The
survey also looked
at
operating indicators.
These
are
metrics
of the
quality
and
costs
of
products
and
services.
The
categories
of
measurements included
(1)
reliability,
(2)
timeliness
of
Fig.
72.3
Charts
of
results from
the GAO TQM
study.
delivery,
(3)
order-processing time,
(4)
errors
or
defects,
(5)
product lead time,
(6)
inventory turnover,
(7)
costs
of
quality,
and (8)
cost savings.
These
metrics
are an
expansion
of
"traditional"
quality
measures. They represent
a
measure
of
quality system effectiveness.
Customer satisfaction
is a
very important
indicator
for any
business.
If
customers
are not
satisfied,
the
company's
profitability
will
be
affected
at
some point, usually sooner than later. This survey
looked
at
three measures
of
customer satisfaction:
(1)
overall customer satisfaction,
(2)
customer
complaints,
and (3)
customer retention.
The
survey looked
at the
increased
financial
performance
of the
companies applying TQM.
The
metrics looked
at
were
(1)
market share,
(2)
sales
per
employee,
(3)
return
on
assets,
and (4)
return
on
sales. These measures
put to
rest
the
theory that
TQM
efforts
do not
offer
an
attractive return
on
investment.
How
much
is a 14%
annual increase
in
market share worth
to
your company?
72.4
HOW
WILL
IT
CHANGE
MY
ROLE?
72.4.1
As a
Mechanical Engineer
Traditionally,
engineers become engineers because they have
an
aptitude
for or
prefer
to
deal with
data
and
things.
The
typical mechanical engineer
is
most focused
on
one
key
responsibility,
the
performance
of his or her
design
or
process.
This
is
still
an
important consideration,
but as
your
organization
adopts TQM, whether
due to
customer requirements
or
competitive pressures, some
new
dimensions
will
be
added
to
your
role.
As
shown
in
Fig. 72.4,
TQM has
many aspects that
affect
both
the
organization
and the
individuals. This section will include
a
brief discussion
of
some
of
them.
First
of
all,
a
mechanical engineer working
in a TQM
environment will probably
be
part
of a
multifunctional
team, usually
an
integrated product
and
process development team (more
on
this will
be
found
in a
later section
of
this chapter). This will require what
may be new
skills, such
as
listening
to
other viewpoints
on a
design, reaching consensus
on
decisions,
and
achieving alignment
on
cus-
tomer needs.
To the
mechanical engineer, teams
may
appear
inefficient,
slowing down
"important"
design work,
but the
performance
of a
well-developed team
has
often
proven superior
to
other
or-
ganizational
forms.
Another
change
that
a
mechanical engineer
may
note
in TQM is a
focus
on
processes.
In the
past, engineers usually
felt
that
the
result
was
important,
not
necessarily
the
means.
TQM
focusses
on
the
means (processes)
as
much
as the
results. This
is one way to
achieve minimum variation
in
Fig. 72.4
The
comprehensive model
of
TQM.
results,
to
consistently
use the
best process available.
At first
thought, this
may
appear restrictive,
but
it is
not.
TQM is
serious about continuous improvement. This means that processes will
not
remain static,
but
when
the
current
"best
process"
is
discovered,
all
functions
that
can use it are
expected
to use it.
A final key
change that
a
mechanical engineer might note
in an
organization adopting
TQM
involves
the
engineer's relationship with
the
management structure.
To
free
up the
creative capability
in
the
organization
and to
make
it
more agile, management must move
from
a
directive relationship
to
a
coaching
or
guiding relationship.
Of
course, this will
be a
significant
change
for the
manager
and
engineer
and
sometimes
the
transition
is not
smooth.
72.4.2
As a
Manager
of
Mechanical Engineers
If
you are a
manager
of
mechanical engineers
in an
organization deploying TQM,
you
will
be in for
changes that
may
make
you
feel
insecure
in
your position.
You
will
see a
drive
to
reduce your
apparent authority,
to
place your
staff
on
teams,
and to
turn your position into that
of
"coach."
It's
possible that you'll stop receiving
funding
to
supply personnel
for
projects. Instead
the
funding
will
go
directly
to the
team.
Your
personnel will most likely
be
located with their team, perhaps geo-
graphically removed
from
you.
We
have emphasized this negative picture
to
draw attention
to the
focus
on
management
in
TQM.
A
significant
part
of the
pressure
to
change
and the
pressure
from
change
falls
on
management.
If
you
think that
TQM is
something
to
assign
to
someone
or
something that
staff
can do
without your
involvement,
you are on a
path
to a
failed implementation.
In
addition
to the
personal considerations, there
are
other concerns that
you
must consider
for a
TQM
implementation.
•
Does your organization have
a
plan
for
identifying what teams,
how
many
are
needed,
and
how
you
will task them?
• Do you
have
a way to
assign team leaders
and
team members?
• How are you
going
to
equip teams with
the TQM
tools
and
team skills
to
succeed?
• Do you
have subject matter experts (SMEs) identified
for TQM
tools
and
team skills?
• Do you
currently have data systems
on
your processes?
• Do you
know what your customers expect?
• How
will
you
fund
the
teams?
• If the
funding
goes
to the
teams,
how
will
you
know what
staffing
levels
to
maintain?
• How
will
you
evaluate
and
help your personnel develop
if
they
are on a
team, especially
if
they
are
geographically separate
from
you?
• How
will
you
know when
a
team
is not
performing?
72.5
WHAT
ARE THE
TOOLS
OF
TOTAL QUALITY MANAGEMENT
AND
HOW DO I USE
THEM?
72.5.1 Technical
Tools—Quality
Function Deployment (QFD)
QFD is the first of the
"major"
tools
of TQM we
will discuss.
By
"major"
we
mean that
the
tool
fulfills
a
major
need
in a TQM
application,
it
possesses
a
fairly
extensive research
and
literature base,
and
there
are no
more
efficient
or
effective
alternatives.
If
quality
is
defined
by the
customer,
QFD is the
tool
to
assure that
the
customers' vision
of
quality
is
captured,
defined,
deployed through
the
enterprise,
and
linked
to the
activities
of the
enterprise.
A few of the
benefits
stemming
from
the use of QFD
are:
•
More
satisfied
customers
•
Greater product team linkage
and
alignment
•
More
efficient
use of
resources, since
the
team works
on the
"important things
first"
• The
ability
to
present
and
evaluate data
on
requirements, alternatives, competitive position,
targets,
possible sources
of
interrelations,
and
priorities
QFD was
initially applied
in the
1960s
in
Japan.
It was
developed
by
engineers
and
managers
in
the
Kobe shipyards
of
Mitsubishi Heavy Industries,
and it was
refined
through other Japanese
in-
dustries
in the
1970s.
QFD was first
recognized
as an
important tool
for use in the
United States
by
Dr.
Donald Clausing (formerly
of
Xerox,
now at
MIT).
It was
translated into English
and
introduced
to the
U.S.
in the
early 1980s. Following publication
of the first
book
on the
subject, Better Designs
in
Half
the
Time,
5
it has
been applied
in
many diverse U.S. situations.
At
the
heart
of
applying
QFD are one or
more matrices. These matrices
are the key to
QFD's
ability
to
link customer requirements (referred
to as the
voice
of the
customer
or
customer
WHATs
in
QFD
literature) with
the
organization's plans, product
or
service features, options,
and
analysis
(referred
to as
HOWs).
The first
matrix used
in a
major
application
of QFD
will usually
be a
form
of
the
A-I
matrix (Ref.
5, pp.
2-6). This matrix
often
includes features
not
always applied
in the
other matrices.
As a
result,
it
often
takes
a
characteristic
form
and is
called
the
House
of
Quality
(HOQ)
in QFD
literature. Figure 72.5 presents
the
basic
form
of the
HOQ.
Fig.
72.5
The
House
of
Quality (HOQ)
and its
major
elements.
The
A-I
matrix starts with either
raw
(verbatim)
or
restated customer WHATs
and
their priorities.
The
priorities
are
usually coded
from
10 to
1,
with
10
representing
the
most important item(s)
and
1
representing
the
least.
These
WHATs
and
their
priorities
are
listed
as row
headings down
the
left
side
of the
matrix. Frequently
we find
that customer WHATs
are
qualitative requirements that
are
difficult
to
directly
relate
to
design requirements,
so the
project team will develop
a
list
of
substitute
quality
characteristics
and
place these
as
column headings
on
this matrix.
The
column headings
in
QFD
matrices
are
referred
to as
HOWs
in QFD
literature. Substitute quality characteristics
are
usually
quantifiable
measures that
function
as
high-level product
or
process design targets
and
metrics.
For
example,
a
customer
may
want
good
gas
mileage
(a
WHAT),
but the
design team needs
to set a
specific
miles-per-gallon
target
(a
HOW). Next
the
team develops
a
consensus
on the
correlation
between
the
WHATs
and the
HOWs. Each correlation
is
marked
in the
row-column
intersections
using symbols having
an
associated numeric weight.
The
convention
is 9
points
for a
high correlation
between
a
WHAT
and a
HOW, with
3, 1, and O for
medium, low,
and no
correlations, respectively.
The
assignment
of
points
to the
various correlation levels
and the
prioritization
of
customer
WHATs
are
used
to
develop
a
weighted list
of
HOWs.
The
correlation values
(9, 3, 1, and O) are
multiplied
by
the
WHATs priority values
and
summed over each
HOW
column. These column summations
indicate
the
relative importance
of the
substitute quality characteristics
and
their strength
of
linkage
to
the
customer requirements.
The
other
major
element
of the
A-I
matrix
is the
characteristic triangular
roof
(an
isosceles
triangle) which contains
the
interrelationship assessments
of the
HOWs.
In
many cases, improvement
in
one or
more substitute quality characteristics
may
foster improvement
in or be
detrimental
to
others. These positive
and
negative interrelationships
are
noted
in the
column-column intersections
of
the
roof.
For
example,
if
customer WHATs
for a car
include
"good
acceleration"
and
"economical
fuel
consumption," these
may be
translated into substitute quality characteristics (HOWs) such
as
the
0-60
mph
time, time required
to
pass,
and
highway mileage (mpg). Subsequent design
effort
to
improve
the
0-60
mph
time
will
likely
improve
the
time
to
pass,
but
will also likely reduce
the
highway
mileage.
These would
be
reflected
as
positive
and
negative interrelationships, respectively.
Other features that
may be
added
to the
A-I
matrix include target values, competitive assessments,
risk
assessments,
and
others. These
are
typically entered
as
separate rows
or
columns
on the
bottom
or
right side
of the
A-I
matrix.
The key
output
of the
A-I
matrix
is a
prioritized list
of
substitute quality characteristics. This list
may
be
used
as the
inputs (WHATs)
to
other matrices.
For
example,
in
Fig. 72.6
we
show
the
HOWs
Fig.
72.6
QFD
matrices
may be
used
to
"flowdown"
customer requirements.
Fig.
72.7
PDCA
cycle.
*Since early writings,
Dr.
Deming
has
modified
this
to
PDSA—plan,
do,
study, act.
of
the
project
A-I
matrix
flowing
down
to
become WHATs
for
subsystem teams. Their HOWs
may
then
be flowed
down
as
inputs (WHATs)
for
their suppliers. Following
the car
mileage
example,
target mileage requirements
may be flowed to the
engine team
and
efficiency
requirements
flowed to
the
transmission team. They
may
then break their requirements
out to
fuel
injection, piston, gear,
and any
other suppliers.
This
assures that
the
voice
of the
customer
is
deployed throughout
the
enterprise
and
that
all
activities
are
linked with customer requirements.
72.5.2
Technical
Tools—Seven
Management
and
Planning
(7 MP)
Tools
Dr.
Deming proposed that
TQM
applications should
follow
what
is now
known
as the
PDCA (plan,
do,
check,
act)*
cycle,
as
pictured
in
Fig. 72.7.
The
PDCA cycle
is a
logical approach that parallels
the
scientific
method
of
"observe,
hypothesize, test hypothesis,
modify
hypothesis."
Most early
TQM
tools addressed
the
"do, check, act" portion
of the
cycle.
In
later years,
a
suite
of
tools were developed
to
assist
the
planning
efforts
of
TQM. These have become known
as the 7 MP
tools:
7
1.
Affinity
diagram
2.
Tree diagram
3.
Prioritization
matrix
4.
Interrelationship digraph
5.
Matrix diagram
6.
Activity network diagram
7.
Process decision program chart
The first
tool widely used
in the 7 MP
suite
is the
affinity
diagram, which
is
excellent
for
generating
and
grouping ideas
and
concepts. Teams will
find the
affinity
diagram
useful
for
exploring
issues
in a new
project
or
factors
to
consider during implementation. This tool
often
uses simple
sticky
papers
or
cards
to
generate
and
collect team ideas. These
are
then arranged into "affinity"
groupings
by the
team
and
assigned
a
descriptive header.
The
affinity
header descriptions represent
the key
issues
or
concepts
identified
by the
team.
The
number
of
cards under each header indicates
the
breadth
of
team consensus
on the
issue.
The
tree diagram, pictured
in
Fig. 72.8,
is a
good tool
to
break down
a
complex project into
manageable tasks.
The
team starts with
the
overall project
or
goal description, which
is
broken down
into
the
next logical division
of
effort.
Each
new
element
may be
further
divided
(if it
makes sense)
until
the
team
has a
list
of
self-contained tasks that
may be
assigned
to one or
more
subteams
or
individuals.
A
prioritization
matrix
is
most
useful
to
develop
a
prioritized list
from
a
large
set of
options. This
tool makes
it
easy
for the
team
to
focus
on the
important items
and
avoid
"hidden
agendas"
that
Comm.
I
\\nes
Hardware
installation
>
1
Terminals
New
,
. . .
I
applications
Deploy
new
Software
'
'
computer
develop-
s
y
stem
I
|
ment
[
\__[c^^-—
sions
Training
for
users
Fig.
72.8 Example tree diagram.
may
drive
the
team.
In
this tool,
the
team uses pair-wise comparisons
to
determine
the
overall
relationship
of a
large number
of
elements.
An
interrelationship digraph (ID),
as
presented
in
Fig. 72.9, helps
a
team discover
the
relationships
and
dependencies between project activities. Using simple graphical techniques,
the
team indicates
task
relationships
one by
one. When
all the
pair-wise
comparisons
are
completed,
the
team
has the
information
necessary
to
identify
the
driver tasks (tasks that drive
or
precede
a
large number
of
other
Fig.
72.9 Example
ID
(arrows
represent influence
or
predecessor relations).
tasks)
and the
outcomes tasks (tasks that depend
on a
large number
of
other tasks). Driver tasks
can
be
managed more
closely
to
avoid schedule
risk
and
outcome tasks
can be
monitored
for
project
performance.
The
activity network diagram (AND), portrayed
in
Fig.
72.10,
is a way for a
team
to
schedule
project
tasks.
The
team
can use
simple sticky notes
or
cards
to
list
the
program tasks.
These
can
then
be
arranged
in the
anticipated
flow
order (sequential, parallel,
or a
combination) with
directional
arrows
drawn between related tasks.
The
team
can
then assign times
to
each task placing
the
task
process time
on the
paper
or
card.
The
result
is an
ordered diagram that
can
show
predecessor/
successor relationships, total task time,
and the
critical path.
For
those tasks
not on the
critical
path,
the
team
can
calculate late start times based
on the
available slack time
for
that path.
The
information
contained
in an AND can be
input
to
project-management software
to
develop
the
familiar Gantt
chart.
Matrix
diagrams allow
a
team
to
display relationships
and
responsibilities
in a
concise
and
efficient
manner.
At first
glance this
may
appear similar
to the ID, but
matrix diagrams
are
most used
for
assignments
not
assessments.
For
example,
a
team
may use a
tree diagram
to
divide
a
project into
manageable tasks
and
then apply
a
matrix diagram
to
assign responsibilities
for the
tasks. Matrix
diagrams
are
related
to QFD in
their
application approach.
The
process decision program chart (PDPC),
as
described
in
Figure
72.11,
is a
tool
that helps
to
develop contingency planning
for the
project. From
the use of the
previous
7 MP
tools,
your team
should
be
able
to
develop
a
plan
for
your project.
In the
PDPC
you can
explore likely
problems
for
each step. These
may be
graphically shown
as a
tree under each step. Contingency
countermeasures
can
then
be
planned
for
each potential problem
and the
team then selects their best
choice
from
the
options.
72.5.3 Technical
Tools—Design
of
Experiments (DOE)
A
key
responsibility
of a
mechanical engineer
is to
obtain
the
required performance
from
a
system
or
component
of a
system. This usually requires simulations, trade studies,
or
experimentation with
various
system components
and
input parameters. Engineers
are
typically taught methods that
require
certain assumptions
or
apply approximations
for the
underlying system equations.
For
best perform-
ance, this
may not be
sufficient.
Approximations
may not be
accurate enough
and are
singularly
inadequate
to
guide variability reduction.
Design
of
experiments
of DOE is the
tool
of
choice
for
trade studies
and
system
or
component
experimentation.
A
properly planned
and
conducted
DOE
will yield
the
most
useful
information
possible
from
a
series
of
experimental runs, giving
the
engineer
not
only
the
identity
of key pa-
Step
1
I
I
Step
2
I
I
Step
4
T
=
4
I
O I
4
I
**T
=
5
I
4 I
9
^
T
=
7
I
9 I
16
I^
days
days days
_
_
_
__
__
_
I
StepS
I
*
'
T
=
3 I 4 I
7
^
days
~12
16~
\
Earliest Earliest
Start (ES)
Finish
(EF)
Latest
Latest
Start
(LS)
Finish
(LF)
Fig.
72.10 Example activity network diagram.
Fig.
72.11 Example process decision program chart.
rameters,
but
also
an
estimate
of the
underlying performance equation. This will allow
the
engineer
to
efficiently
set the
system
up for
optimum performance
in
nearly
all
cases.
The
chief competitor
to DOE is
one-factor-at-a-time (OFAAT) experimentation, where
an
engineer
holds
all but one
factor constant. That factor
is
varied
on one or
more experimental runs
to see if it
has an
effect
on the
system response. This
is
repeated
for the
other factors. Unfortunately, OFAAT
leads
to
only linear,
and
usually only
first-order,
information
on
each experimental factor.
If
there
are
significant
system interactions
or
higher-order
effects,
OFAAT will
not
reveal them.
In
Fig.
72.12,
a
system space
is
shown
for a
system with three factors, each
at two
levels. Experimenting through
OFAAT
will only explore
the
four
points
(circled
in
Fig. 72.12) where
first-order
information
is
available.
If
there
is a
significant
two-factor interaction
in the
system,
it
will show
at the
appropriate
corner point where both factors
are
changed.
If
there
is a
three-factor interaction,
it
will require
information
from
the
corner where
all
three factors
are
changed.
Another
competitor
to
OFAAT
is
"random"
experimentation,
as
displayed
in
Fig.
72.13.
In
this
approach,
a
number
of
process factors
are
changed each
time the
experiment
is
done. With this
For
a
process with three factors
at two
levels,
one
factor
at a
time experiments
explore only
a
limited
part
of the
process
domain.
We
will
gain
no
knowledge
of
interactions with this
approach.
Fig.
72.12 One-factor-at-a-time.
For
a
process with three factors,
random change
to all
factors
represents random movement
in the
experimental domain.
Fig.
72.13 Random experimental movement.
approach,
if the
process improves
or
grows worse,
the
team will
not
know which
factor
or
factors
were
the
influence.
In
contrast
to
OFAAT
and
random experimentation,
DOE
systematically measures
the
system
response
as
multiple factors
are
changed.
The
orderly
and
planned change
of
system factors
is the
key
to
DOE.
Prior
to the
experiment,
the
engineer,
often
using
a
multifunctional team, will determine
which
factors (system inputs
or
parameters) might
affect
system response.
The
experimental levels
(factor
settings)
for
each
factor
will also
be
determined. Finally,
the
team should decide
how
much
experimentation
the
project
can
afford.
This
and
other preferences will determine
the
type
of
exper-
iment
to
conduct.
There
are
many types
of
experimental designs. Generally,
an
experiment with more than
one
factor
falls
into
one of the
following
major
classifications:
•
Full
factorial
An
experiment where
all
possible combinations
of
factor
level settings
are run
at
least
once.
If
there
are n
factors,
all at two
levels, this will result
in
2
n
experimental runs
for
one
replication. This type
of
experiment
can
explore
the
effects
of all
factors
and
factor
interaction combinations.
•
Fractional factorial.
An
experiment where only
a
specific
subset
of the
possible factor level
settings
is
run.
If
there
are n
factors,
all at two
levels,
a
half-fractional
experiment will require
2
n
~
l
runs
for one
replication. This experimental design reduces
the
number
of
experimental
runs,
but the
cost
is a
loss
of
information,
as
interactions
may be
confounded with other
interactions
or
main factors. Usually
the
design
is
structured
so
that higher level interactions
(three-factor
or
higher) cannot
be
separated
from
the
effect
of
another factor
or
lower-level
factor
interaction.
In
this type
of
experimental design, experience
and
knowledge
are
essential
to
avoid
an
experiment that mixes interactions unwisely.
There
are
several experimental methodologies that make
use of
these
key
experimental design
types.
Classical DOE, developed
by Sir
Ronald Fisher
in
England
and
promoted
in the
U.S.
by
Box,
Hunter,
and
Hunter, uses both
full
and
fractional factorial
designs.
8
In the
early 1980s,
Dr.
Genichi
Taguchi
began
to
promote
in the
United States
an
experimental methodology that uses special
set of
fractional
factorial
designs.
9
Although
the
experimental designs
of Dr.
Taguchi
are not
unique,
his
approach
generated
a
dramatic increase
in
interest
in
DOE, especially among engineers.
Dr.
Taguchi
made
three
major
contributions
to
DOE. First,
he
developed
a DOE
methodology that
offered
clearer
guidance
to
engineers than earlier approaches. Secondly,
he
promoted
the
concept
of
"robust
design"
and
showed
how DOE
could
be
used
to
obtain
it.
Finally,
he
promoted
the
application
of a
quality
loss
function,
expressed
in
dollars, showing
how the
enterprise,
and
society
in
general,
are
affected
by
variation
from
a
target
value.
10
Usually
experiments
are run
with factors
at two
levels. Occasionally
an
experiment deals with
attribute
factors
(qualitative factors such
as
material types)
at
more than
two
levels. Sometimes
nonlinear
effects
are
expected,
so
even continuous
factors
(factors
with settings
on
some continuous
scale, such
as
temperature)
are run at
three
or
more levels.
72.5.4 Technical
Tools—SPC,
SQC,
and 7 QC
One
technical tool
for TQM
that came
to
early public attention
was SPC
(statistical process control).
After
somewhat rocky
first
application attempts, many companies
are finding SPC to be
useful
for
reducing defects, lowering
defect
rates,
and
making
key
processes much more consistent
and de-
pendable.
The key to
successful
SPC
application
is
understanding what
SPC
does
and
doesn't
do.
SPC is the
application
of
statistical
(often
in
graphical
form)
methods
to
identify
when
a
process
may
have been
influenced
by a
"special"
cause
of
variation.
Dr.
Walter
Shewhart,
who
developed
the
earliest concepts
and
applications
of
SPC, divided process variation into
two
types.
One
type
of
variation
he
described
is
often
called
"common
cause"
or
"normal"
process variation
in the
literature.
Normal variation results
from
the
myriad
of
factors inherent
to the
process interacting with each
other. Examples
of
normal process variation sources
in a
simple drilling operation include drill splay,
variation
in
bits, variation
in
material,
and so on.
These factors interact
and
create
a
resulting pattern
of
variation
in
hole size, location,
and so on. The
second
form
of
variation described
by Dr.
Shewhart
is
often
referred
to as
"special
cause"
variation. Examples
of
special causes
in the
previously men-
tioned drilling operation might include changes
in
personnel, excess
bit
wear, changes
in
material
clamping technique, changes
in
material,
and so on.
We
make
the
distinction between these sources
of
variation
to
separate
the
manageable
from
the
unmanageable. Special causes
of
variation
can
usually
be
identified
and
removed
from
the
process.
Normal causes
of
variation
can
only
be
removed
or
reduced
by
changing
the
process, which
often
requires management involvement
and/or
capital expenditure. Although process changes
may be
necessary, usually removing special causes variation sources
is
more
cost-effective
and
should
be
addressed
first.
How
does
SPC fit
into this?
Dr.
Shewhart, working
in an
AT&T Western Electric plant,
saw
that
their processes
had a lot of
variation
and
that operators were constantly adjusting.
He
suspected that
they
were
often
reacting
to
normal variations
and
that their additional
adjustments
were adding
to
the
process variation.
He
proposed
the use of SPC and SPC
charts
to
signal when
a
process
may
have
been influenced
by a
special cause
of
variation. Then
the
operators, engineers,
or
managers
could pursue adjustments
or
investigations,
as
necessary.
SPC
charts come
in
many forms,
but in
general
all
plot
one or
more statistics
(a
descriptive
measure
from
a
unit
or
sample)
on a
chart that contains control limits, such
as the
chart
in
Fig. 72.14.
The
control limits
are
derived
from
past stable process data
and
usually
represent
X ± 3s for
each
statistic (note that some statistics
do not
have
a
lower limit) where
X is the
long-run average
for the
statistic
and 35 is
three times
the
standard deviation
of the
statistic.
If the
statistic follows
the
normal
distribution
(and nearly
all
will,
due to the
central
limit
theorem),
a
point outside
the
control
limit
would
only occur 0.27%
of the
time. Thus,
a
point outside either limit most likely
reflects
the
influence
of a
special cause
of
variation.
In
addition
to
watching
for
points beyond
the
control limit,
SPC
practitioners also apply tests
for
patterns
in
consecutive points. Such patterns, such
as
trends
of
seven
points
in a row
increasing
or
decreasing, also
reflect
events that would
not
likely happen
in a
process operating only with normal causes
of
variation.
In
Fig. 72.14,
we see an X and R
chart.
In
this chart,
we
plot sample averages
(X) and the
range
(R) for
each subgroup.
A
subgroup usually
consists
of 2 to 10
samples
for
this type
of
chart. This type
of
chart detects both
a
shift
in the
process
average
and a
change
in
process variation. Following
are
some rules
for
abnormal patterns
in SPC
charts:
11
• One
point beyond
a
control limit
• A run of
seven
or
more points either
up or
down
or
consecutive above
or
below
the
centerline
• Two of
three consecutive points outside
2
sigma,
but
still inside
the
3-sigma line
•
Four
of five
consecutive points beyond
1
sigma
While
SPC
deals with in-process measures,
often
our
only
significant
way to
measure
the
process
result
is by
measuring
the
performance
of the finished
product.
For
example, when
we
assemble
an
electronic circuit, there
are
in-process measures
to be
monitored,
but the final
performance
can
only
be
measured
by final
test.
As
with in-process measures,
final
performance variation
is a
function
of
the
variation resulting
from
normal
and
special causes.
SPC can be
used
in
this case
to
identify
when
to
investigate
for a
special cause
and
apply corrective action.
Often
this approach
is
called statistical
quality
control (SQC).
The
same charts
and
approaches
are
often
used.
We
should note that
SQC
should
not be
used
as a
substitute
for
SPC.
Since
SPC is
directed
at
process inputs,
not
later
in the
cycle,
it
offers
faster detection
and
correction
of
problems.
SPC and SQC are
powerful
tools,
but
they essentially
do
only
one
thing: they
identify
when
a
process
was
probably influenced
by a
special
cause
of
variation. When that occurs,
the
team must
Fig.
72.14 Example
X bar
(X)
and R
chart (with
one
point
out of
control).
determine what happened
and
remove
the
cause
to
return
the
process
to the
normal state. Many
of
the
tools
for
this
job are
grouped with
SPC/SQC
in
what
are
called
the
seven
quality-control
(7 QC)
tools:
11
'
12
1.
SPC/SQC
2.
Histograms
3.
Scatter plots
4.
Pareto charts
5.
Fishbone diagrams
6.
Check sheets
7.
Defect maps
Application
of
these tools with
SPC
will enable
the
team
to
maintain
a
stable process.
72.5.5 Technical
Tools—Process
Capability
or
Validation Studies
One of the
more
useful
methodologies coming
from
TQM
applications
is the
joining
of
manufacturing
process
capability assessment
and the
processes
of
developing design requirements.
As was
previously
discussed,
there have
often
been barriers between design
and
manufacturing. There
was
distrust,
finger-pointing,
and
a
general lack
of
teamwork.
For
most companies, engineering design
has
been slow
to
recognize that they
had a
responsibility
to
work with manufacturing
to
develop
a
design package meeting customers' needs that
was
manu-
facturable.
For
their part, manufacturing
has not
been proactive
in
work
to
develop consistent pro-
cesses with minimum variation. There
is
plenty
of
blame
to go
around,
so how
does
an
organization
change?
A key way to
change without arguing
is to
look
at
facts
and
data. Characterize your processes
according
to
what
you
expect
of
them (engineering requirements). Based
on the
results,
you may
decide that
it is
more cost-effective
to
change
the
design
for
some parameters
if
they appear
to be
controlled
too
tightly.
If the
design requires certain performance,
but the
current process
can't
reliably
meet requirements,
you
must improve
the
process!
Following
are the
steps
for
doing
so.
They
are
easy
to
follow.
1.
Prioritize your processes
and
start working
on the
highest one(s), i.e.,
the
vital few.
2. If the
process doesn't have SPC, apply
it!
3. Get the
process
under
statistical
control, i.e.,
predictable.
4.
From
the SPC
chart, obtain estimates
of the
process average
and
standard deviation.
5.
Assess
the
process
C
pk
.
6.
Based
on the
C
pk
and
economic considerations, change
the
product specifications
or
improve
the
process
to
obtain
C
pk
goals.
7.
Move
on to the
next
process.
First
of
all,
you
should develop
a
strategy
of
work. Since
you
probably don't have resources
to
do
everything, make sure
you do the
important things
first. The
next
two
steps
are
key.
If you
don't
have
SPC on the
process,
you
can't determine
if
it's stable.
If the
process
is not
stable,
all
subsequent
assessments will
be
worthless.
In
steps
4 and 5, you
obtain estimates
of the
process average
and
standard deviation
and
then
apply
them
to an
assessment
of
performance called
the
process performance index
(C
pk
).
This measure
(calculations
and
performance values
are
given
in
Fig.
72.15)
shows
how
well three standard devi-
ations
fit
between
the
process average
and the
closest specification limit. What value
is
appropriate?
Many
organizations
use a
C
pk
of
1.33
as a
minimum value. This means that
four
standard deviations
fit
in
the
distance between
the
process average
and the
closest specification.
A few
companies
are
using
C
pk
values
of
1.50
as
their target. Such higher values
of
C
pk
allow more margin
if the
process
shifts.
You can see
this
in the
values
listed
in
Fig. 72.15 that show
the
effect
of 1 and 1.5
standard
deviation
shifts.
The
last
two
steps must
not be
ignored.
If you find
that
the
process capability
is not
acceptable,
you
must change
the
design requirements, improve
the
process,
or
live
with poor process
performance
for as
long
as you
make
the
product.
The
decision
of
which
to
address—design,
process,
or
both—is
an
economic one. When
you
have completed this project, move
on to the
next one.
One
element
of
process assessment that should
not be
neglected
is
gage repeatability
or
reproducibility assessment.
If
the
major
source
of
process variation
is in the
measurement,
it is
usually
the
cheapest
way to
improve
the
process.
72.5.6 Technical
Tools—Other
TQM
Tools
By
some counts there
are
more than
100 TQM
tools that
may be
applied
for
different
aspects
of
TQM
applications.
12
These range
from
simple graphical procedures
for
data exploration
to
complex
tools like DOE.
A
partial list follows:
•
Activity-based costing
•
Gap
analysis
•
Bar
chart
•
Imagineering
•
Benchmarking
•
Just-in-time
•
Brainstorming
•
Nominal group technique
•
Business process re-engineering
•
Policy deployment
•
Continuous improvement
•
Problem solving
•
Cost
of
quality
•
Ranking
•
Critical path method (CPM)
•
Sampling
•
Cycle
time
management
•
Scatter analysis
•
Data-collection
strategy
•
Spider chart
•
Defect
map
•
Stratification
•
Delphi method
•
Survey analysis
•
Deployment chart
•
Synchronous workshop
•
Design
for
manufacture/assembly
•
Systems analysis
•
Events
log •
Thematic content analysis
•
Failure mode
and
effects
analysis
•
Time
study
sheet
•
Fault tree analysis
•
Value
engineering
•
Five
whys
72.5.7
Cultural/Social
Tools—Concurrent
Engineering
In
the
past,
a new
product-development
effort
followed
a
predictable path. Design engineers worked
with
marketing
and
customers
on
initial feasibility studies.
If
these studies looked favorable,
one or
more prototypes were then built, usually
in a
special prototype facility.
An
initial design
was
then
formulated
and a
pilot production scheduled. During this time, manufacturing engineers were drawn
Fig.
72.16
In
traditional design, involvement
is
often
partitioned.
Fig.
72.15
C
pk
formula
and
selected values.
into
the
project.
At the
same time, marketing's involvement
was
reduced, since
the
design group
had
their
input
and the
project
became
a
production
problem.
At
this
point,
engineering
changes
increased
as
producibility problems
and
cost issues emerged.
As
full-scale production begins, after-market support's involvement
increases.
Additionally, mar-
keting
often
gets involved again with
new
input
from
early customers
and
competitive comparisons.
Since
the
whole process
may
take some time, this
new
marketing input
can
represent
a
significant
customer change
in
tastes
and
reaction
to
competing products. This adds
to the
engineering change
rate.
In
many projects,
the
change rate
may
continue
at a
high level well into full-scale production.
This phenomenon, described
as the
engineering version
of
rework,
can be
very
significant
in
cost.
13
Besides
the
cost involved, this approach
is
very time-consuming. More agile competitors
can
beat
the
enterprise
to
market. Since
a
significant
portion
of
profit
from
a new
product
or
service comes
early
in the
production cycle,
it is
important
to the
enterprise that
it not be
ceded
to
competitors.
14
To
combat
the
problem
of
long development cycles
and to
reduce
the
degree
of
late engineering
change, concurrent engineering
was
proposed
for
especially complex design
efforts.
Concurrent
en-
gineering promised
to
remove
the
problems
in a
design cycle
by
concurrently developing
the
product
design
as
well
as the
processes necessary
for
production, test,
and
after-market support.
The
concept
was
quite simple
and
theoretically dealt with
the
problem. Unfortunately, except
for
a few
isolated cases, concurrent engineering
did not
fulfill
its
promise.
It
fell
short
for two
rather
simple reasons. First
of
all,
by its
nature
it
still involved only engineering. There
was
still
no
drive
to
include marketing,
finance,
production operators, testers,
and so on.
These people bring
significant
insight
into issues that
affect
cost
and
reliability.
The
second reason
for
concurrent engineering's lack
of
success comes
from
the
nature
of
organizations.
As
they currently exist
for
most companies,
functional
organizations
do not
communicate well. Since concurrent engineering
did
nothing
to im-
prove this problem, those outside product design still
often
had to
design their processes
in a
vacuum,
isolated
from
each other.
Obviously, concurrent engineering,
by
itself,
was not the
answer.
It
would take more
to
improve
the
design process.
72.5.8
Cultural/Social
Tools—Teams
In
the
1980s
and
before, some leaders started
to
picture
a
vision
of a
radically
different
organizational
structure.
One
1990 annual report pictured
"a
boundary
less
company
. . .
where
we
knock down
the
walls
that separate
us
from
each other
on the
inside
and our key
constituencies
on the
outside"
(Ref.
15,
p.
63). Increasingly, business leaders
saw
teams
as a way to
solve
the
design cycle problem
and
make
the
enterprise more
flexible and
agile.
To
see how
this works, consider
the
traditional hierarchical organization. Individual elements
of
this
organization
are
connected through their management chain.
How
does
any
department request
support
of
another? Since
the
powers
of
budget
and
personnel evaluation
flow
from
the
manager,
department
staff
respond
to
their manager. Requests
for
support must
be
made through
the
manage-
ment
chain
and
must
often
be
accompanied with necessary
funding.
Such
funding
must
be
authorized
by
the
giving department's manager
and
usually involves
the two
supporting
finance
organizations,
one to
prepare
the
document authorizing
funding
and one to
receive
the
funding
and set up
charge-
collection systems.
A
relatively simple request
for
support
can
easily involve
six
people
and
signif-
icant documentation. This
is not
conducive
to a
rapid response!
Now
let's
picture another approach.
In
this organization,
a
project team
is
formed with
the re-
sponsibility
to
complete
the
project. This team
may
have total responsibility
for the new
product
or
service,
or it may
have responsibility
for a
subset
of the
project.
The
team
is
given
the
budget
for
the
project.
The
team
is
staffed
with representatives
of all
pertinent
functional
areas
(a
multifunctional
team). Such
a
team
has the
capability
to
overcome
the
barriers
of
traditional organizations.
Teams
have been successfully applied
on
many projects,
but the
most recent evolution
of
team
applications
finally
fulfills
the
promises
of
concurrent engineering. Referred
to as an
integrated
prod-
uct
and
process development (IPPD
or
IPD) team, this approach uses multifunctional teams
to
develop
concurrently
the
processes
and the
design
of new
products
and
services.
72.5.9
Cultural/Social
Tools—The
Variability Reduction Process (VRP)
One
clear message
has
emerged
from
research
and
observation
of
various companies' attempts
at
TQM. Implemented correctly,
TQM can be an
important strategic weapon
for the
enterprise. Imple-
mented
poorly,
it can not
only
fail
to
yield promised results,
it can be a
drag
on the
enterprise
as
time
and
resources
are
diverted
to
poorly planned exercises.
The way to
avoid
an
ineffective
TQM
initiative
is to
insure that
it
drives toward goals that
can
really help
the
business.
A way to
achieve such
an
impact
is to use the VRP to
focus
your
TQM
efforts.
As can be
seen
in
Fig. 72.17,
any
business
has
certain
key
core
functions.
No
matter what
the
enterprise does,
it
must
1.
Identify
customer needs
2.
Develop
or
deploy needed business functions
The
Variability
Reduction
Process
IPPD
and
OFD
.
Customer
^
Concurrent
yjjjp
^DOE
^SPC
*>
Product
Engineering
]~^
II\
Knowledge
Feedback
§D
15
s
Ig-1
Is
7
I
1^1
^
Fig.
72.17
The
variability reduction process will guide
TQM
application.
3.
Identify
key
processes
4. Set key
process factors
to
deliver required performance
5.
Manage
the
processes
in a
stable manner
6.
Meet customer needs
The VRP
organizes
key TQM
tools around
the
core business functions. These tools
may be
applied
to
improve each step.
The
effect
is to
engage
the
whole enterprise
in
continuous improvement
of all
processes with
a
focus
on
customer needs. Such
an
approach
can
significantly transform
the
enterprise.
72.6 SUMMARY
TQM is a
strategic
tool
for
many world-class companies today.
It
will
be a
part
of the
work life
for
most mechanical engineers
and
managers. Greater knowledge
of the
tools
and
methodologies will
be
beneficial
to
your
career
and to
your employees.
REFERENCES
1. J. B.
ReVeIIe,
Becoming
the
Total
Quality Manager
(TQM),
A
Workshop
for the
Institute
of
Industrial Engineers
(HE),
Atlanta, 1995.
2. J. M.
Juran (ed.),
Juran's
Quality Control Handbook.
4th
ed., McGraw-Hill,
New
York, 1988.
3. J. M.
Juran
and F. M.
Gryna,
Quality Planning
and
Analysis, McGraw-Hill,
New
York, 1980.
4. R. C.
Swanson, Quality Improvement Handbook,
Team
Guide
to
Tools
and
Techniques,
St.
Lucie
Press, Delray Beach,
FL,
1995.
5. B.
King, Better Designs
in
Half
the
Time:
Implementing
QFD in
America,
GOAL/QPC,
Methuen,
MA,
1987.
6.
General Accounting
Office
(GAO), Management Practices, U.S. Companies Improve
Perform-
ance
Through Quality
Efforts,
GAO/NSIAD-91-190,
Washington,
DC, May
1991.
7. M.
Brassard
and D.
Ritter,
The
Memory
Jogger,
GOAL/QPC, Methuen,
MA,
1985.
8. G. E. P.
Box,
W.
Hunter,
and J. S.
Hunter, Statistics
for
Experimenters, Wiley,
New
York, 1978.
9. G.
Taguchi, System
of
Experimental Design,
UNIPUB/Kraus
International Publications,
New
York,
1987.
10. G. S.
Peace,
Taguchi
Methods:
A
Hands-On Approach,
Addison-Wesley,
Reading,
MA,
1993.
11. D. C.
Montgomery, Introduction
to
Statistical Quality Control,
2nd
ed.,
Wiley,
New
York, 1991.
12. J. B.
ReVeIIe,
R. A.
Kemerling,
and H. K.
Jackson Jr.,
TQM
ToolSchoot™,
Quality America
(software),
Tucson,
AZ,
1995.
13. J. P.
Womack,
D. T.
Jones,
and D.
Roos,
The
Machine
That
Changed
the
World,
Rawson
As-
sociates,
New
York, 1990.
14. J. B.
ReVeIIe,
N. L.
Frigon
Sr.,
and A. K.
Jackson Jr., From Concept
to
Customer:
The
Practical
Guide
to
Integrated Product
and
Process Development
and
Business Process Reengineering,
Van
Nostrand
Reinhold,
New
York, 1995.
15. J. H.
Boyett
and J. T.
Boyett,
Beyond
Workplace
2000: Essential Strategies
for the New
American
Corporation,
Dutton,
New
York, 1995.
BIBLIOGRAPHY
Brassard,
M.,
and D.
Ritter,
The
Memory Jogger
II: A
Pocket Guide
of
Tools
for
Continuous
Im-
provement
&
Effective
Planning, GOAL/QPC, Methuen,
MA,
1994.
Management
Practice: U.S. Companies Improve
Performance
Through Quality
Efforts,
GAO/
NSIAD-91-190.
Montgomery,
D.
C.,
Design
and
Analysis
of
Experiments, Wiley,
New
York,
1991.
Peterson,
D.
E.,
and J.
Hillkirk,
A
Better Idea:
Redefining
the
Way
Americans
Work,
Houghton
Mifflin,
Boston,
1991.
ReVeIIe,
J.
B.,
The
Two-Day
Statistician, Hughes Aircraft Company,
Los
Angeles, 1985.