Environmental Technologies Part 14 pot
Bạn đang xem bản rút gọn của tài liệu. Xem và tải ngay bản đầy đủ của tài liệu tại đây (365.62 KB, 16 trang )
Environmental, Medical, Technogenic and Computer Technology: Modeling,
Risk Assessment and Cost/Benefit Analysis of the Accidents 253
Where coefficient A includes the integral expert parameters assessments of type – state of
support beams B1 and B2, state of the western zone, state of the southern shields between
axes B-C, state of block B;
- coefficient B is estimated on the base of the following parameters – activity of
radioactive waste in fuel-containing masses, activity of radioactive waste in the air,
activity of the water samples in wells;
- coefficient C is estimated on the base of the following parameters – efficiency of
the protective systems of the Shelter, condition of the dams and systems of
flood control, condition of the system of the radioactive monitoring, condition
of fire-prevention devices, a level of the technologies, a level of the capital
investments;
- coefficient D is estimated on the base of the following parameters –a level of
staff qualification, state of work condition and labor payment. We use a point
estimation based on expert conclusion at the estimating values of the
parameters.
Let the system, presenting a condition of the Shelter, be at norm (state 1). There are
trajectories of change of its parameters, which pass the system at first in state 2 (local
extreme situations, not causing pollution growth outside of the Alienation zone), an
then in state 3 (extreme situations that result in pollution growth outside of the
Alienation zone). Also there are trajectories immediately passing the system from state
1 to state 3. If the initial state of the system corresponds to state 2 or 3, the trajectories
that return the system to state 1 (normalization of ecological radiation situation) can be
determined. Thus, the task of risk assessment of the extreme situations occurrence can
also be formulated to define a concrete stationary state in the model (2). For that can be
used:
1) The values of the parameters corresponding to the current state of the system are
determined.
2) The array of their bifurcation values corresponding to changes of number of
stationary states is determined.
3) The 4th dimensional vector of distance
,1, ,4
i
Ri=
from an initial state of the system
up to surfaces, which divide parameter areas corresponding to different number of
stationary states is determined.
4) The risk value , 1, ,4
i
Risk i = is determined as the ratio of this vector to a vector
describing appropriate distance in norm
()
, 1, ,4
N
i
Ri=
, as follow:
()
, 1, ,4
i
N
i
i
R
Risk i
R
==. (3)
5) The reserve values ,1 4
i
res i = is determined as distances from the initial state
of the system up to surfaces, which divide the parameter areas corresponding to
different number of stationary states.
The index of the state is calculated for every subsystem.
254 ENVIRONMENTAL TECHNOLOGIES: New Developments
The state index of the subsystem “A” is calculated by:
4
2
1
1
()
4
Aiii
i
IaXX
=
=−
∑
C
,
where
A
I is an index of the subsystem “A”,
1
X
- estimation of the condition of beams
support B1 and B2,
2
X
- estimation of condition of the western zone,
3
X
- estimation of
condition of the southern screens between axes B-C,
4
X
- estimation of the condition of
the block B,
i
X
C
- values of the appropriate parameters in a norm,
( 1 4)
i
ai=
- norm
coefficients.
The state index of the subsystem “B” is calculated by:
3
2
1
1
()
3
Biii
i
IbXX
=
=−
∑
C
,
where
B
I is an index of the subsystem “B”,
1
X
- estimation of activity of the radioactive
waste in the fuel-containing masses,
2
X
- estimation of activity of the radioactive waste in
the air,
3
X
- estimation of activity of the water samples in wells,
i
X
C
- value of the
appropriate parameters in a norm,
( 1 3)
i
bi= - norm coefficients.
The state index of the subsystem “C” is calculated by:
4
2
1
1
()
4
Ciii
i
IcXX
=
=−
∑
C
,
where
C
I - is an index of the subsystem “C”,
1
X
- estimation of the condition of efficiency
of the protective systems of the Shelter,
2
X
- estimation of the condition of dams and
systems of flood control,
3
X
- estimation of the condition of the radiological monitoring
systems,
4
X
- estimation of the condition of fire protection devices,
i
X
C
- value of the
appropriate parameters in a norm, ( 1 4)
i
ci= - norm coefficients.
The state index of the subsystem “D” is calculated by:
4
2
1
1
()
4
Diii
i
IdXX
=
=−
∑
C
,
where
D
I - is an index of the subsystem “D”,
1
X
- estimation of the technology level,
2
X
-
estimation of the investments,
3
X
- estimation of the staff qualification,
4
X
- estimation of
the payments and condition of work,
i
X
C
- value of the appropriate parameters in a norm,
( 1 4)
i
di= - weight coefficients.
Environmental, Medical, Technogenic and Computer Technology: Modeling,
Risk Assessment and Cost/Benefit Analysis of the Accidents 255
3.2. Modeling and risk assessment of extreme situations occurrence on the Shelter. Let us
consider the results of the modeling and risk assessment of extreme situations occurrence
with help of the method and software – the subsystem “Risk assessment of extreme
situations occurrence on the Shelter. These results have been obtained at the solution of
control examples for mathematics modeling and risk assessment of extreme situations
occurrence in the Alienation zone. The results have a general type and can be used for the
same type of potentially dangerous object. Let us use the input data from the Table 2 for
solution of two examples.
The results of the modeling are presented in the Table 3, where state is a current stat of the
system, risk is a summary risk of conversion in the state 3,
, 1, ,4
i
Ii= , I are indexes of the
states of the subsystems,
,1, ,4
i
Ri=
are risks of conversion for subsystems to the state 3,
,1, ,4
i
rez i =
– reserve values for the subsystems.
Subsystem Parameter
Task
No.1
Ta
sk
N
o.
2
Condition of beams support B1 and B2, points 8 7
Condition of the western zone of the Shelter, points 8 6
Condition of the southern screens between axes B-C, points 8 6
A
Condition of the block B, points 8 6
Activity of the radioactive waste in the fuel-containing
masses, points
4 3
Activity of the radioactive waste in the air, points 4 3
B
Activity of the radioactive waste in the water samples in
wells, points
4 3
Efficiency of the protective systems of the Shelter, points 7 7
Condition of the dams and systems of flood control, points 5 5
Condition of the radioecological monitoring systems, points 6 6
Condition of the fire protection devices, points 6 6
Technology level, points 7 6
C
Level of the investments, points 8 6
Level of staff qualification, points 8 8
D
Condition of payments and condition of work, points 7 6
Table 2. Input parameters for examples No.1-2
The values of reserves
, , ,
i
res i A D= are determined as a distances from the current
state up to the surface that divide the area of the parameters corresponding to change of the
number of stationary states
*
, , ,
iii
res R R i A D=− = .
256 ENVIRONMENTAL TECHNOLOGIES: New Developments
Systems of the parameters
Subsystem A Subsystem B Subsystem C Subsystem D
C
ur
re
nt
st
at
e
Risk
IA RA rezA IB RB rezB IC RC rezC ID RD rezD
1
0.00
4
0.1 0.0 - 0.2 0.0 - 0.2 0.0 - 0.2
0.00
4
0.00
5
2
0.00
8
0.2 0.0 - 0.1 0.0 - 0.2 0.0 - 0.2
0.00
8
0.00
3
Table 3. The results of the control examples o risk assessment for conversion to the state 3
As we see from the examples No.1 and 2, the main factor at the given set of input data,
having influence to the extreme situations occurrence, a is state of the subsystem D
(technology level, level of the investments, level of staff qualification, condition of payments
and condition of work). The decreasing the protection level of the Shelter that at the same
time corresponds to decreasing the technology investment levels, level of staff qualification,
condition of payments and condition of work leads to double increasing risk of extreme
situations occurrence from 0.004 to 0.008.
4. Research of Risk Ranking of the Various Technogenic Accidents on the Potentially
Dangerous Objects and its Medical and Ecological Consequences
The models of faultness of the technological systems on the potentially dangerous objects
depend on its destination and conditions of use. There are known more than ten models of
faultness at the handling with the radioactive waste. The base of them is the first
exponential model of distribution of duration of Mean Time Between Failures that leads to
the extreme situations occurrence. That model is correct to Poisson flow of failures.
With help of developed software it was performed a risk ranking of the various technogenic
operations at the disposal and conservation of the radioactive waste.
The results of risk ranking research of the various technogenic operations are presented in Table 4.
Elements of scheme of processin
g
radioactive waste - hard
radioactive waste
Rank Elements of scheme of processin
g
radioactive waste – liquid radioactive
waste
Rank
Mechanisms of
g
ivin
g
of hard
radioactive waste
1.0 Mechanisms of receivin
g
of liquid
radioactive waste
1.0
Bunkers for substances 0.98 Mechanisms of mechanical depuration 0.98
Batchers 0.7 Filter-press 0.9
Devices for mixing 0.85 Devices of cementation 0.9
Devices of steam heating 0.84 Evaporator 0.8
Temperature press 0.79 Condenser of steam 0.7
Mechanisms of packing 0.6 Pressing mechanisms 0.82
Loaders 0.5 Mechanisms of packing in plastic 0.95
Mechanisms of packing in plastic 0.5
Table 4. The results of risk ranking research
Environmental, Medical, Technogenic and Computer Technology: Modeling,
Risk Assessment and Cost/Benefit Analysis of the Accidents 257
4.1. Research and risk assessment of personnel illness on the potentially dangerous object.
We will perform the research and assessment on example of risk assessment of illness
occurrence of personnel of the Chernobyl Alienation zone at the possible safety violation at
the handling with the radioactive waste.
At the same time, we have to calculate of the additional irradiation that the personnel
get at the handling, shuttling and transportation of the radioactive waste at the extreme
situations.
The situations connected with handling and shuttling of the radioactive waste can be
divided to three groups: D1 - accident-free handling and shuttling, D2 - accident leaded to
partial damage of the part of containers without ground pollution; D3 - accident leaded to
atmosphere and ground pollution.
General additional dose of radiation that the personnel gets at the transportation, shuttling
and storage of the radioactive waste - D, is calculated by:
D = D1 + D2 + D3, (4)
where D1, D2, D3 are calculated from (5), (6) and (8).
Consideration of the additional factors that define the level of the catastrophe weight from
that depends the quantity of the radioactive waste from the containers at the transport
catastrophe, allows us calculate the parameters k3 and k2 . Those are practically possibilities
of appropriate catastrophes. To the number of such factors can be taken the followings:
speed of collision, fire, angle of blow, meteorological condition, relief etc.
The calculation of risk of illness occurrence after received the additional radiation dose is
obtained by (Yanenko V.M., 2003) and by additional coefficients:
R il = Kr*D, (5)
where Kr is an additional coefficient of risk (see Table 5); D is received dose (Gr) (see
formula (4)).
Tissues Additional coefficient of risk (1e-2
1/Zv)
Weight factor
Gonads 0.40 0.25
Mammary gland 0.25 0.15
Red bone marrow 0.20 0.12
Lungs 0.20 0.12
Thyroid gland 0.05 0.03
Bone surface 0.05 0.03
Other 0.50 0.30
Table 5. Additional coefficients of risk calculation Kr of tumor with death or with inherited
effects of person of any sex and age
Additional coefficients of risk Kr for some illnesses: - leukemia - 1 e
-8
1/Zv; death from
cancer - 4 e
-5
1/mZv; - cancer - 0.8 e
-5
1/mZv; death from cardiovascular diseases - 4 e
-5
1/Zv; worsening of inheritance - 8 e
-6
1/mZv.
258 ENVIRONMENTAL TECHNOLOGIES: New Developments
4.2. Modeling of distribution of the radioactive waste release in result of the accident
without fire and explosion. Let us consider the task solution of mathematical modeling of
distribution of the radioactive waste at the following set of input data (example No.1): type
of explosion – gas substance, radionuclide Cs137, duration of the accident – 40 hours, speed
of the wind – 0.5 m/s; activity of the explosion – 100 Bk/z; modeling is performed on the
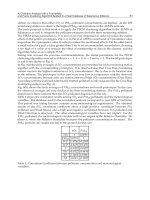
section of the area 3000×400 m. The screen form with results of the modeling is presented on
the Figure 1. In the point of observation density of pollution is 1.2*104 Bk/sq.m, individual
dose is 1.0*10-3 Zv. The risks of diseases occurrence: Leukemia - 1.0*10-8, Cancer - 8.1*10-6,
Death from cancer - 4.0*10-5, Worsening of inheritance - 8.1*10-6. The risks of tumor
occurrence with death results and inherited effects: Honads - 4.0*10-6, Mammary gland -
2.5*10-6, Red bone marrow - 2.0*10-6, Lungs - 2.0*10-6, Thyroid gland - 5.1*10-7, Bone
surface - 5.1*10-7, other - 5.1*10-6.
Fig. 1. Screen form with results of the modeling for task No.1
5. Medical and Cybernetics Systems
5.1. Software and information technologies allowed one to research the condition, reserves
and risks of illness of the liquidators of the catastrophe under the influence of the negative
factors of the Chernobyl catastrophe.
The traditional register of changes only conservative values of the parameters of
cardiovascular system and system of regulation of protective functions of organism to the
object doesn’t give all-round estimation of possible self-healing of the subject, their reserve
possibilities and risk assessment of the pathological changes of different systems of
regulation of the organism.
To make the process of decision making more effectively it should be noticed the dynamic
characteristics of the subject including the estimation of the irreversible changes and the
estimation of reserve possibilities of the investigated object.
Environmental, Medical, Technogenic and Computer Technology: Modeling,
Risk Assessment and Cost/Benefit Analysis of the Accidents 259
According to the traditional approach it’s required to reduce the dynamic models of
cardiovascular system and system of regulation of protective functions of organism to the
feature of smooth reflection “swallow’s tail” of the universal deformation in the theory of
casp catastrophes. Then there are investigated the types of steady functioning of the systems
and initial conditions of the system up to surface divided area of the parameters that
correspond to changes of the number of stationary conditions.
Lets’ base on that condition of the initial models after the reduction to the model “swallow’s
tail” is given by (3), where the parameters of the 4th subsystems correspond to: A –
energetic subsystem, B - immune, C – myeloid and D – cardiovascular.
The task of reserve possibilities assessment and risk of the pathological changes in
cardiovascular and regulation immune systems lead to estimation of characteristics of the
stationary conditions (3) and others.
The results of the risk modeling are presented in the Table 6, where S is the current
condition of the system, P is the summary risk of conversion to the condition of
pathology, I is an index of subsystem condition, R is a risk of conversion for
appropriate subsystem in the condition of pathology, Res is a value of reserve for the
appropriate subsystem.
Subsystems
Subsystem A Subsystem B Subsystem C Subsystem D
No S
RIS
K
IA
R
A
Rez
A
IB
R
B
Re
zB
IC RC
Re
zC
ID RD
Re
zD
1
Nor
m
0.22
0.
0
0.
0
0.12 0.0
0.
0
- 0.03 0.22 0.1 0.09 0.0 -
2
Nor
m
0.50
0.
44
0.
0
- 0.0
0.
0
- 0.03 0.0 - 0.14 0.50
0.1
38
Table 6. Results of the indexes of conditions, reserves of the subsystems and risk the
cardiovascular diseases
As it’s shown in the control examples the main factor that defines the risk of the cardiovascular
disease is the condition of the subsystem C (condition of the blood system). In that case the risk of
pathology equals to 0.22. In case of another set of data the main factor is the subsystem D
(cardiovascular system) with insignificant worsening of the parameters of the energetic system.
The risk of the cardiovascular disease increases more then two times and equals to 0.50.
5.2. The research of the neuro-immune and endocrine regulation and system of regulation of
protective functions of organism let us develop the software to restore damaged data for
risk assessment of illness and for forecasting some processes (Yanenko V.M. et al., 2006).
Mathematical modeling of the neuro-immune and endocrine regulation. To provide the
mathematical modeling of the condition of the system of neuro-immune and endocrine
regulation the data of five patients have been chosen. The condition of immune system of
the patients is characterized by indexes in the Table 7. The indexes of peripheral blood are
presented in the Table 8. The results of hormone research are presented in the Table 9.
260 ENVIRONMENTAL TECHNOLOGIES: New Developments
Number of the patient Parameter
1 2 3 4 5
Lymphocytes, % 30 60 42 40 48
T-lymphocytes, % 50 80 60 80 70
T-active
lymphcytes, %
30 50 30 50 50
T-helpers, % 35.3 50 28 50 55
T-suppressors 20 35 12 30 30
Coefficient
helper/suppressor
1.8 1.7 2.3 1.7 1.9
B-lymphocytes, % 20 85 35 45 45
Ig, g/l 2 4 2.5 4 4
Ig, g/l 2 2.5 1 2.5 2.5
Ig, g/l 10 17.5 15 15 10
Ig, g/l 0.05 1.75 0.05 1.0 0.8
Table 7. The indexes characterizing the condition of immune system of the patients
Number of the patient
Parameter
1 2 3 4 5
WBC – leucocytes, 109/l 6 9.4 8.2 7 7
RBC – erythrocytes, 1012/l 4 6 5 6 5
HGB – hemoglobin, g/l 120 175 140 110 115
PLT – platelet, 109/l 247 550 350 500 450
LYM – lymphocytes, % 35 70 42 60 50
MO – monocytes, % 5 5 5 4 4
Eosinophils, % 2 4 4 3 4
Stab, % 3.6 5 5 5 4
Segmentonuclears, % 51 60 60 55 55
SOE, mm/hour 10 12 12 12 14
Table 8. The indexes of peripheral blood of the patients
Number of the patient
Parameter
1 2 3 4 5
TTG, med/l 2 20 1 1.25 1.5
T-4, nmol/l 90 35 242 85 245
T-3, nmol/l 1.8 0.8 5.7 6 2
FT – 4, pmol/l 15 12 21 15 21
FT - 3, pmol/l 4 6 7 7 5
r – 3, pmol/l 0.65 0.5 0.5 0.4 0.6
KT, pg/mol 240 300 350 300 300
TSG, mkg/mol 18 20 22 20 22
AKTG, pg/mol 50 65 40 40 35
Cortisol, nmol/l 290 300 340 320 330
Table 9. The indexes of the endocrine system condition of the patients
Environmental, Medical, Technogenic and Computer Technology: Modeling,
Risk Assessment and Cost/Benefit Analysis of the Accidents 261
The numerical experiments were performed. The screen form with predicted dynamics and
with appropriate dynamics obtained in the result of the task of optimal control is presented
for the patient No.2 on the Figure 2 . The screen form with graphics of control influences
(activators of oxidative phosphorylation (U1), activators of calcium transportation (U2),
level of iodine (U3)) obtained in result of the optimal control is presented for the patient
No.2 on the Figure 3. The screen form with risk assessment of pathological changes is
presented for the patient No.2on the Figure 4.
The results of risk assessment are presented for the patient No.2 in the Table 10.
Pathology Risk predicted
Risk obtained in result of task of
optimal control
Hypothyroidism 1.0 0.41
Hyperthyroidism 0.02 0.09
T3- thyrotoxicosis 0.03 0.11
T4- thyrotoxicosis 0.04 0.14
Table 10. The results of risk assessment of pathological changes for the patient No.2
Fig. 2. The form “Research Data”, subsection “Hormonal research (research of dynamics)”,
page “Graphic”. .for the patient No.2
262 ENVIRONMENTAL TECHNOLOGIES: New Developments
Fig. 3. Screen form with graphics of the control influences obtained in result of task of
optimal control ofr the patient No.2
Thus, the condition of the patient No.2 is characterized as hypothyroidism. The risk of
hypothyroidism equals to 1.0. In result of task of optimal control the risk of hypothyroidism
decreased to 0.41.
5.3. Information software. There is developed a software product C/BR-RAW-ChAZ-2.0
(volume 40.4. Mb) - “System for database administration” described the 10th km of the
Chernobyl Alienation zone, subsystems “Risk assessment and rating», «Modeling and
forecasting dynamics of cost/benefit ratio from consequences of possible accidents and
impact of radiation at the hand ling with radioactive waste of the Alienation zone»,
scientific and technical documentation (volume 17.3 Mb).
5.4. Information and program-technical providing with “Medical decision making for
endocrinologist” (volume 7.0 Mb), “Medical decision making for cardiologist”
(volume 7.0 Mb) support: administrating database of the patients, forecasting the
influence of post-Chernobyl thyroid and cardiovascular pathologies to evolution of
appropriate human organism systems, assessments of pathological changes in thyroid
gland and in cardiovascular systems caused by the Chernobyl catastrophe’s factors.
These software products also provide the work with database using technology File-
Server.
6. Gratitude. This work was started in 1979. We express our gratitude for all colleagues for
creative and assiduous work.
Environmental, Medical, Technogenic and Computer Technology: Modeling,
Risk Assessment and Cost/Benefit Analysis of the Accidents 263
Fig. 4. Screen form with risk assessment of the pathological changes for the patient No.2
6. Literature
Lyashenko I., Yanenko N. (1999). The Usage of cost-benefit ratio in risk assessment of region
contaminated by Chernobyl accident, Proceedings of the 9th Annual Conferece: „Risk
Analysis: Facing the New Millennium, pp. 745-747, ISBN 90-407-1954-3, Rotterdam –
The Netherlands, October, 10-13, 1999.
Yanenko V.M., Rykhtovsky V.O., Yanenko N.V. (2006). The ecological, medical and
cybernetics technologies: modeling, catastrophes risk assessment, cost/benefit
analysis at the prevention of the possible ecological and medical accidents.
Proceedings of the International Conference: Twenty Years after Chornobyl Accident.
Future Outlook, pp. 116-121, ISBN 966-96638-2-2, Kiev - Ukraine, April 24-26, 2006.
Baloga V., Kholoscha V. et al., (2006). National report of Ukraine. In: Twenty Years after
Chornobyl Accident. Future Outlook, 224 p., Atike (Ed.), ISBN 966-326-166-8, Kiev -
Ukraine.
Sergienko I.V. et al. (2000). Computer technology for waste management for Chernobyl
remediation, Environmental Management and Health - An International Journal,
Volume 11, Number 5, 2000, pp.410-421, ISSN 0956-6163.
Yanenko V.M. (2003). Risk ranging of ecological and medical violations caused by influence
of the Chernobyl catastrophe factors, Proceedings of the International conference:
„Anthropogenically changed environment of Ukraine: risks for the population’s health and
264 ENVIRONMENTAL TECHNOLOGIES: New Developments
ecological systems”, pp. 77 – 98 (in ukr), Kiev – Ukraine, March 25 – 29, 2003. Special
issue of the journal «Ecological bulletin» - Kiev, Chernobylinterinform, 2003
Yanenko V. et al. (2003). The Dynamics of Special Natural Investigations of the Chernobyl
Alienation Zone during 1998-2002, Proccedings of «XXVI International workshop
“Modeling of developing systems: analysis and control of ecological technogenic and
telecommunication risks. Problems of rehabilitation and recreation of the Chernobul
Alienation zone (MRS-XXVI - 2003). To the memory of Viktor Glushkov – LXXX”, pp.
44-53, ISBN 966-02-2985-2, Kiev - Ukraine, September 11 - 17 2003.
Guastello S.J. (1981). The organizational security subsystem: some potentially catastrophic
events. Behavioral Science, Vol. 26, 1981, pp. 48-58.
Poston T., Stewart I. (1980). Theory of catastrophe and its applications, 607 p., Mir (Ed.),
Moscow –Russia (in rus).
16
Habitation and Noise
Vesna Zlatanovic-Tomasevic M. Sc. Arch.
College of Structural Engineering and Geodesy,
Serbia
1. Introduction
Noise is a physical phenomenon, which spreads along all traffic arteries, seizing more
settlements every day, and especially expressive in large cities where it endangers the
population, not only with its influence on hearing aparatus, but on the whole human
organism.
The largest effects in preventing this phenomenon are accomplished by proper planning of
the cities and by respecting all normatives and standards in order to prevent the noise.
While planning the new settlements, all sources of the noise must be taken into
consideration; the intensity, the frequency and lasting of the noise must be estimated and
appropriate measures must be proposed.
When urban tissue reconstruction is done, controlling the noise is much complex problem
and challenge, because it is often necessary to preserve the existing urban grid and the
buildings of the special cultural and historical significance. Considering that one of the
solutions-widening the streets, is often impossible or very expensive, problem is solved
by technical intervention in or outside the buildings, by traffic restriction, by
transforming some parts of the city into pedestrian zones or by constructing the
underground objects.
The principles and the elements of environment management are:
protection of the environment politics
planning
introduction (introduction and carrying out)
measuring and evaluation (checking and correcting measures)
reexamination and improving
permanent improvement
2. Noise as Environmental Problem
The noise in the settlements, mainly from the traffic, is one of the important environmental
polluters. Depending on lasting and intensity, it leads to permanent organism damage,
primarily effects the hearing apparatus, neurological-vegetative system, decreases the
power of concentration and working ability.
It is interesting that even the ancient Romans had some regulations for noise protection, by
which the blacksmiths and coppersmiths were banned to work in some periods of the day
(in the afternoon and during the night).
266 ENVIRONMENTAL TECHNOLOGIES: New Developments
In Yugoslavia, the first studies of communal noise from medicinal aspect were began in
1939. (S. Ramzin) and those measurements were conducted by subjective method, while the
first measurements by objective method were taken during 1953. (Dr. R. Felix). The first
medicinal technical research of harmful affects of communal noise were organized by
Federal Institute of Public Health, Clinic of Medical School in Belgrade, Military-Medicinal
academy and School of Electrical Engineering
Beside the problem of communal noise, the problem of noise inside the buildings appeared, which
is primarily connected to the change of construction methods, from traditional to industrial.
The noise is every undesirable sound. To be called the noise, it has to be strong enough to be
heard. There is the difference between the noise from the natural sources (like thunder,
wind, water, etc.), which is not relevant for urban environment, and the noise from man
made sources, in working environment and in the rest of environment.
The noise is made at the place where the source is: on the street, in the apartments, in the
backyard, etc. The noise can be various in types: continual-constant intensity (easier to
bear); discontinued (more difficult to bear); isolated sounds, murmurs. It depends for
example on traffic frequency and street width.
To alleviate the influence of noise on people’s health, the noise protection measures are
taken: the preventive and sanitation measures.
preventive measures are those which are in the plan and project of the building,
and where suggested means do not anticipate the possibility of noise creation
sanitation measures are partial and restricted to sanitation of individual buildings
The measures which are taken in noise prevention are technical - on the way of the sounds;
physiological - on organism protection and legal - regulations for allowed level of noise,
and the measures which are taken in the buildings are constructively-technical which
assume the wall construction, thickness, window and door solutions, etc.
3. Traffic Noise in Banjica Housing Project
The city of Belgrade covers the area of about 3221 km
2
(metropolitan area), where the urban
aglomeration is about 765 km
2
. Residential area covers the surface of 137 km
2
and traffic
about 32 km
2
. Belgrade has approximately 167 000 buildings. Banjica borough spreads on
the surface of 85ha and has a population of 3500.
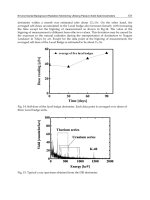
The urban noise is measured in Belgrade on 18 spots and the results show the high level of
noise. The measurements in Banjica housing project are taken in 1999. on 9 measuring spots.
The highest level of noise for this location as residential area are: during the day 55dB (A),
and during the night 45dB (A). The measurements were done at the traffic arteries on the
edge and in the heart of the settlement during the day with statistic analyzer (built in
memory, type 4426 BRUEL):
2m away from the road at the height of 1,5m
in the range of 36-100 dB (A)
frequency range of 20-20 000Hz
with 2 000 samples taken in the intervals of 0,2 sec
all results are the statistic processing of the noise which lasted 6.6 min
The results showed the exceed of the maximum level of noise of 24,0 dB (A).
Habitation and Noise 267
Measuri
ng spot
MEASURED EQUIVALENT
LEVEL OF NOISE
ALLOWED EQUIVALENT
LEVEL OF NOISE
DIVERGENCE
/ 24.12.82. 01.03.99. 24.12.82. 01.03.99. 24.12.82. 01.03.99.
dBA dBA dBA
1 70,2 73,1 55 55 + 15,2 + 18,1
2 71,1 79,0 55 55 + 16,1 + 24,0
3 66,0 76,5 55 55 + 11,0 +21,5
4 61,3 69,0 55 55 + 6,3 + 14,0
5 48,2 64,9 55 55 - 6,8 + 9,9
6 61,3 59,8 55 55 + 6,3 + 4,8
7 68,9 76,3 55 55 + 13,9 + 21,3
8 63,3 60,7 55 55 + 8,3 + 5,7
9 53,6 53,9 55 55 -1,4 -1,1
Table 1. Overstepping of average values, or + 6,3 dBA of 16,1dBA, or +5,7 dBA of 24,0 dBA
Cumulative curve of noise measuring in 1982
20
30
40
50
60
70
80
90
100
0 20406080100
Time t (%)
Buka dB (A)
Measuring spot 1 Measuring spot 2 Measuring spot3
Measuring spot 4 Measuring spot 5 Measuring spot 6
Measuring spot 7 Measuring spot 8 Measuring spot 9
Fig. 1. Cumulative curve of noise measuring in 1982
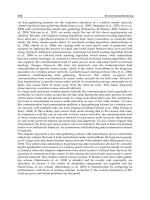
On the base of the presented measurements, it is necessary to take some measures, primarily
through the change in means of transportation (from individual to public transportation) and to
minimize the need for traveling. Aiming that, it is essential to take the following measures:
preventive:
long term strategy in organization of public transportation
protection of the locations for future public transport
setting the strategic frame for public approaches
to define the environment criterion for new traffic installations
constructing the housing projects beside already existing lines of transportation
to build housing projects where infrastructure exists
to revise the locations for construction which are accessible only by vehicle
to prevent the construction on the locations with difficult approach
268 ENVIRONMENTAL TECHNOLOGIES: New Developments
to build the business centers near the housing projects
sanitation:
traffic regulations (regulating traffic regime in the noisiest streets, modifying cargo
transport to lighter vehicles, limiting transport hours, etc.)
protection through sound barriers
protection through vegetation
sanitation of the most endangered buildings
Cumulative curve of noise measuring in
1999
20
30
40
50
60
70
80
90
100
0 20 40 60 80 100
Time t (%)
Nois dB (A)
Measuring spot 1 Measuring spot 2 Measuring spot 3
Measuring spot 4 Measuring spot 5 Measuring spot 6
Measuring spot 7 Measuring spot 8 Measuring spot 9
Fig. 2. Cumulative curve of noise measuring in 1999
4. Conclusion
Having insight into planned, technical documentation and by insight into the existing situation
on terrain, it is established that Banjica housing project is a quiet city residential district.
The measurements, which were carried out inside the housing project, show some deviation
on certain measuring places from noise level allowed by regulations. That calls for taking
some measures of protection from the urban noise.
If the average level of noise in Banjica housing project is taken into consideration, and if the
calculations are done on that base, it could be said that the results are satisfying.
5. Literature
V.Zlatanovic-Tomasevic, Habitation and noise, Belgrade 1977.
V.Zlatanovic-Tomasevic, Analysis of Banjica housing project from the aspect of noise
protection, Masters Thesis, Belgrade 1982.
V.Zlatanovic-Tomasevic, Managing the noise as an ecological risk on the example of Banjica housing
project, Sustainability and city, Faculty of Architecture, University of Belgrade, 1999.
V.Zlatanovic-Tomasevic, Environment and noise, Summer school of urbanism, Sipovo 1999.
V.Zlatanovic-Tomasevic, Managing the noise as an environmental problem, International
Symposium on planning and urbanism, Vrnjacka Banja 2001.