Environmental Technologies Part 11 doc
Bạn đang xem bản rút gọn của tài liệu. Xem và tải ngay bản đầy đủ của tài liệu tại đây (310.86 KB, 20 trang )
13
The Application of Membrane Separation
Processes as Environmental Friendly Methods
in the Beet Sugar Production
Zita Šereš
1
, Julianna Gyura
1
, Mirjana Djurić
1
, Gyula Vatai
2
, Matild Eszterle
3
1
University of Novi Sad, Faculty of Technology
Serbia
2
Corvinus University, Department of Food Engineering
Hungary
3
Research Institute of Hungarian Sugar Industry
Hungary
1. Introduction
The sugar industry is one of the key segments of the food industry. This industry is also
well known as one of the most energy-intensive in the field of food and chemical industry.
In 1999, the total quantity of produced sugar was summarized. It was reported that the
production reached 16 700 000 tones, while the total value of the produced sugar was 8924
million EUR. A significant quantity of thermal energy was consumed for the evaporation
and beet pulp drying, as well as electrical energy needed for the pumps and for driving the
centrifuges. According to CEFS, specific energy consumption was 31.49 kWh/100 kg beet in
1998 (IPPC, 2003). In a Greek study, a figure of 280 kWh/t is given for the electrical part of
the energy consumption in sugar manufacturing (IPPC, 2003). While the overall water used
is about 15 m
3
/t sugar beet processed, the consumption of fresh water is 0.25 – 0.4 m
3
/t
sugar beet processed, or even less in modern sugar factories. Water consumption depends
on the activities of each installation, e.g. more water is consumed in an installation that
extracts and refines sugar beet compared to the one that does only one of these activities
(IPPC, 2003). For example, the consumption of water in Austria was reported at a level of 1.5
m³/t of sugar beet processed, which is equivalent to 9 m³/t of produced sugar (IPPC, 2003).
The transport water has high organic contamination due to the soil and sugar from
damaged beets. Its COD is 5000 – 20000 mg/L. Waste water with high BOD levels is
produced in large volumes (IPPC, 2003).
Despite the fact that the sugar industry is one of the causes of the environmental pollution,
not enough has been done on its improvement. The technology applied in almost all
European sugar factories is based on the traditional principles and methods. The major
steps in the traditional sugar beet processing are (Poel Van der et al., 1998):
i) Pre treatment
– Washing and slicing of the sugar-beets into cosettes are the initial
operations;
194 ENVIRONMENTAL TECHNOLOGIES: New Developments
ii) Extraction – The sugar is counter-currently extracted from beet cosettes to obtain raw
juice and beet pulp. The raw juice is thermally unstable at temperatures above 85
o
C. The
beet pulp can be used as cattle feed or can be modified to obtain fibers for human feed;
iii) Beet juice purification
– Milk of lime and karbonation gas CO
2
, both produced in a
separate facility, are applied. Coke and limestone are used for the production of CaO and
CO
2
. The lime usage of the conventional process is about 2%/beet. Classical juice
purification consists of liming, carbonation, sludge separation and sulphitation. However,
this process removes only a part of non sugars from the sugar juice (proteins, pectins,
inorganic salts and colouring substances);
iv) Beet juice concentration
- By multi-effect evaporation the thin juice with a dry substance
content of 14-16% is concentrated to thick juice with 60 – 75% of dry matter;
v) Crystallization
– Further evaporation of water leads to crystallization and growth of
crystals. Sugar crystals are separated by centrifuge from the syrup. The separation occurs in
three stages. The molasses is the by-product from which the crystallization is not possible.
Governments of the developed countries have tried to increase the pressure on the largest
waste producers in order to reduce the undesired environmental pollution. For example, the
Commission of the European Communities introduced the Integral Pollution and
Prevention Control Directive (Council Directive, 1996). The purpose of the directive is to
achieve integrated prevention and the control of pollution arising from the particular
activities listed in its Annex I. Among others, the directive defines the Best Available
Techniques (BAT) as the most effective and advanced stage in the development of activities
and their operation methods which indicate the practical suitability of particular techniques
for providing in principle the basis for emission limit values designed to prevent and, where
that is not practicable, generally to reduce emissions and the impact on the environment.
The European IPPC Bureau published a relevant document (BREF) where the BAT for the
Food, Drink and Milk Industry are presented (IPPC, 2003). To a larger extent, the general
techniques commonly used in this industry are described. However, no BAT is described
relating specially to sugar beet production. Detailed information can be found in chapter 4,
under the title Techniques to Consider in the Determination of BAT. The chapter contains a
list of various pollution prevention, waste minimization and energy efficiency techniques
applied in industry that are described everywhere, e.g. in books, journals, leaflets, the
internet, etc. Recent research in the sugar industry has been focused on the development
and implementation of new technologies and/or the particular unit operations, which
would replace the traditional ones. The separation operation deserves special attention
because of its significant consumption of water end energy.
Up to now, very few large-scale membrane separation processes have been applied in the
sugar industry worldwide despite the encouraging results of numerous investigations
published in the literature (Kwok, 1996; Willet, 1997; Chou, 2002; Lipnizki et al., 2006). In
principle, all the separations in sugar production from beet or cane juices could be
performed with appropriate membrane separation processes. In practice, however,
regarding the high capacities of the sugar factories and relatively low price of sugar, the
investment in an imaginary factory, operating exclusively with membranes or with other
new environmentally friendly separation methods, would still be to high. The other
approach is to find those membrane separation processes which could be advantageously
embedded into or combined with the traditional technology to increase the effectiveness of
the sugar production as a whole. This latter concept is closer to the actual state of the
industry.
The Application of Membrane Separation Processes as Environmental Friendly
Methods in the Beet Sugar Production 195
2. Membrane Separation Processes
2.1 Introductory Comments
Membrane separation is a pressure driven filtration technique in which a solution is forced
through a porous membrane. Some of the dissolved solids are held back because their
molecular size is too large to allow them to pass through. The size range depends upon the
type of membranes used. Fractionation of the feed stream occurs, with some molecules
being concentrated on the upstream side of the membrane, which is known as the
concentrate or retentate. The smaller molecules pass through the membrane into the
permeate stream. The variety of membrane separation techniques can be characterized by
their membrane pore size.
Cross-flow microfiltration (MF) membranes can be used to remove non-sucrose compounds,
or to fractionate the retentate rich in colourants. Ultrafiltration (UF) membranes can be
applied to concentrate the relevant juices in sugar industry and to remove non-sucrose
compounds. This membrane pore size ranges from about 10 to 100 nm. Applications of UF
can be extended to the removal of oil from waste water and the removal of turbidity and
colour colloids from juices. Nanofiltration (NF) membranes have selective permeability for
minerals and some small organic and inorganic molecules and NF is used predominantly
for concentration and pre-demineralization (removal of salts) of juices and waste water in
sugar industry; the pore size of the NF membrane ranges from about 1 to 10 nm. Reverse
osmosis filtration (RO) membranes are permeable to water but not minerals and are
therefore used for dewatering and for removing heavy metals and pesticides. They are also
used for refinement of NF permeates or evaporator condensate as well as in water
treatment, such as softening and salt removal; this membrane pore size ranges from about
0.1 to 1 nm (Cheryan, 1986). Membranes can also be classified according to the material used
for their production. So, polymeric, inorganic – ceramic and metallic- membranes are well
known.
Along with the membrane characteristics, operating conditions are also significant. Among
possible regimes, cross flow filtration has proven the best. Also important are following
independent variables: transmembrane pressure, flow rate of the liquid phase, its
temperature and process duration. Their optimization is a difficult task which can be
performed either empirically or by solving adequate mathematical models. Certain number
of papers is dealing with the mathematical modelling of the process, based on theoretical
background as well as on statistical processing the measured data. As for the required goal,
the quality of permeate, expressed through its colour, purity, turbidity, etc., is given the
priority.
Sugar has to satisfy rigorous quality demands; particularly important are demands related
to the colour of its crystals. Ensuring colour quality parameters of white sugar (EU-1 and
EU-2) used to be difficult especially when the quality of the processed beet is poor (Šereš et
al., 2004; Gyura et al., 2004). The limits of the traditional purification operations are well
known; by using purification with lime, only 35% of non-sucrose compounds can be
removed. Also, assurance of colour quality is expensive due to the high energy consumption
of the sugar house: heat and electricity, or even if enough energy could be provided, limited
capacities of equipment in the sugar house might cause stresses in the operation of the
factory. In such a situation it seems reasonable to look for an additional non-sucrose
compound elimination method by which the required colour, to obtain EU-2 white sugar
from the standard liquor (feed of the 1st evaporating crystallizer) can be provided.
196 ENVIRONMENTAL TECHNOLOGIES: New Developments
In the membrane separation technique water is used periodically to clean the separation
equipment. The frequency of cleaning and the volume of water used vary depending on the
product and equipment. Waste water from washing as well as from the process itself (in the
form of separated waste products) contains dissolved non-sucrose compounds. Membrane
separation as a pressure driven process requires electrical energy. The achieved
environmental benefits are as follows: reduction of levels of the suspended, colloidal and
dissolved solids in water, reduction of phosphorus levels and collection of waste water
streams, thus reducing their volume prior to further possible treatment (IPPC, 2003). Also, it
is possible to recover the expensive ingredients for re-use as well as to recover water for re-
use. Problems may arise from the fouling of membranes and gel polarization. Since the flux
rates through membranes are relatively low, an extensive membrane area is required.
2.2 Short History of Investigations
Investigations of membrane separation processes have started through their combinations
with the traditional processes. It was already mentioned, the traditional raw juice
purification involves non-sugars precipitation with lime. Surplus Ca(OH)
2
is eliminated by
the CO
2
gas. Sludge produced is then filtrated through filters and pressed in the filter
presses. Not only waste is produced in this process but an additional lime production plant
would be needed, where solid waste (stones, sand, etc.), wastewater and waste gasses are
produced. Urbaniec (Urbaniec et al., 2000) proposed an alternative process instead. Raw
juice purification by the lime is replaced by screening and micro-filtration followed by low
temperature evaporation. It is also well known that the conventional concentration of thin
juice by evaporation requires about 50% of the total energy. In order to decrease this
amount, nanofiltration and reverse osmosis has been considered as pre-concentration step
before evaporation (Cartier et al, 1997; Gosh et al., 2000; Gosh & Balakrishnan, 2003). An
overall concept for treatment or raw juice with polymeric hollow fiber microfiltration is the
A.B.C. process which combines a continuous screening with ultrafiltration followed by
softening and alkaline adjustment before evaporation and adsorption (Wilett, 1997).
Madsen, Nielsen and Attridge studied the raw beet juice purification by ultrafiltration and
microfiltration (Madsen, 1973; Nielsen et al., 1982; Attridge et al., 2001) using polymeric
membranes. Apart from using polymeric membranes, the use of inorganic – ceramic and
metallic- membranes to achieve commercially interesting fluxes and permeate purities has
been investigated. Hinkova et al. (Hinkova et al., 2002) observed that the filtration of diluted
raw juice concentrate with ceramic membrane led, at a pilot scale, to a significant decrease
in colloids and colour matters resulting in juice suitable for direct crystallization. Schrevel
(Schrevel, 2002) compared the results obtained on different membranes in different module
configurations. He concluded that supplementary treatments of the beet juice, such as pre-
filtration and pre-liming with carbonation, aid the ultrafiltration and guarantee the required
sugar quality. Tebble et al. (Tebble et al., 2002) have proposed the integration of membranes,
in a side stream approach, to reduce the need for lime and to boost the overall capacity of
the raw juice purification. Kochering et al. (Kochering et al., 2003) have combined
microfiltration and ultrafiltration for lime free raw juice purification using an ion exclusion
process. Here membrane filtration is used after a clarifier and followed by softening,
evaporation and chromatography for the elimination of non-sucrose and colour. The result
is high quality of white sugar. Koekoek et al. (Koekoek et al., 1998) tested nanofiltration
spiral wound and tubular modules for the concentration of thin juice. In spite of the
The Application of Membrane Separation Processes as Environmental Friendly
Methods in the Beet Sugar Production 197
acceptable fluxes at the beginning of the process, the long term performance of the
membranes was disappointing due to fouling. Cleaning could not restore the initial fluxes.
Similar results were obtained by Hinkova et al. (Hinkova et al., 2002). Beside application of
membrane separation processes in sugar juice purification, there where attempts to use
reverse osmosis to recycle pulp press water (Bogliolo et al., 1996) or to recover pectin from
sugar beet pulp (Hatziantoniou & Howell, 2002).
Our early investigations on membrane separation of sugar-beet juices has started with the
experiments on polymeric membranes (Eszterle et al., 2000; Gyura et al., 2001; Gyura et al.,
2002a; Gyura et al., 2002b; Eszterle et al., 2003) at temperatures whose limit was 60
o
C,
according to the physical characteristics of the applied polymer materials (polyethersulfone
and polyamide). Further investigations were performed on ceramic membranes which allow
ultrafiltration of sugar juices at 80
o
C. In this way, a simulation of real process was possible.
At the same time, a turbulence promoter was introduced and the efficiencies of processes,
without and with the application of static mixer, were compared (Šereš et al., 2005, Šereš et
al., 2006a; Šereš et al., 2006b). Analysis of working conditions as significantly important
factors in ultrafiltration and nanofiltration processes were investigated at a laboratory level
and the obtained results were used for suggesting optimal conditions (Gyura et al., 2004;
Djurić et al., 2004; Gyura et al., 2005). The suggestions mostly rely on the analysis of
experimental values, but some of them suggested optimal solutions by using adequate
mathematical models. Djurić et al. (Djurić et al., 2004) proposed the flux models as functions
of concentration factor, flow rate, temperature and transmembrane pressure as independent
variables. The suggested mathematical model enables prediction of separation time if the
permeate fluxes as well as the initial and final concentrations of undesired nonsucrose
compounds are known.
Similar to the research related to the purification of raw beet juice, the use of microfiltration
and ultrafiltration for the purification of cane juices was investigated (Hamachi et al., 2003,
Martoyo et al., 2000). Experiences acquired through these investigations might be of broader
importance and will be presented shortly. In 1994, the first New Applexion Process was
installed in a cane sugar factory (Kwok, 1996). The ultrafiltration stage was designed to treat
380 L/min of pre-filtered limed clear juice after the clarifier. A modification of the above
mentioned process was developed by Chou (Chou, 2002). Also the A.B.C. process has been
adopted for cane juice purification (Willet, 1997). Martoyo (Martoyo et al., 2000) described
the successful application of spiral wound ultrafiltration elements for the pre-
filtered/screened raw juice with fluxes in economically interesting range (up to 120 L/m
2
h).
The applicability of spiral wound modules was approved by pilot tests but with lower
fluxes (Gosh et al., 2000; Gosh & Balakrishnan, 2003). More recently, membrane distillation
became one of the latest technologies introduced to cane industry. By this process two
streams with different temperatures are separated through a non-wetted microporous
membrane. The driving force of the mass transfer is the vapour pressure difference resulting
from the temperature gradient across the membrane (Nene et al., 2002). Despite purification
steps before the concentration, cane sugar juice still contains high-molecular mass
components. Microfiltration and ultrafiltration have been proposed as decolourization and
purification methods. Dornier et al. (Dornier et al., 1995) focused their investigations on the
performance of tubular ceramic microfiltration membranes. Cartier (Cartier et al., 1996a and
1996b) studied the influence of flocculation which preceded the microfiltration and
ultrafiltration with tubular membrane. The most promising was the 300 kDa membrane
allowing fluxes of 65 L/m
2
h. The decolourization rate was 50% while the removal of
198 ENVIRONMENTAL TECHNOLOGIES: New Developments
turbidity was 90%. Decloux et al. (Decloux et al., 2000) concluded that ceramic membrane
with 15 kDa has the best decolourization rate at 60
o
C. In 2003, Hamachi and co-authors
highlighted the limitations of using ultrafiltration for decolourization (Hamachi et al., 2003).
It was found that even with membranes of 1 kDa colour removal would not exceed 60%
while the flux decreased below 30 L/m
2
h. Key success factors for an efficient application are
both pre-treatment and operating conditions (Lipnizki et al., 2006).
2.3 New Trends
The commercial application of ultrafiltration, for the separation of non-sucrose compounds,
is limited because of the concentration polarization and progressive fouling of the
membrane. It can be expected that the molar mass of colourants increases while the density
of sugar juice increases due to the polycondensation reactions favored at low water
contents. According to the gel chromatography measurements (Anyos, 1984; Godshall et al.,
2002), approximately 35% of all colourants, present in the initial sugar juice, have the molar
mass higher than 4000 g/mol, while 51% and 81% of colourants, with the mentioned molar
mass, are present in solution of the 2nd and the 3rd sugar. It can be concluded that
elimination of colourants by ultrafiltration would be more efficient in the case of the raw
sugar solutions of the 2nd or 3rd crystallization then in the case of the thick juice. The
second important reason for applying ultrafiltration on thin juices might be the smaller
quantity of these juices compared to the thick juice. Namely, the required membrane surface
is proportional to the quantity of treated solution. In the industrial application permeate is
to be sent to the 1st stage of crystallization and the darker coloured retentate into the 3rd
stage of crystallization.
The described phenomena cause decline in permeate flux during the ultrafiltration of sugar
juice. To make membrane separation process practically applicable, permeate flux should be
increased. Among all the hydrodynamic methods used for improving mass transfer in cross
flow membrane filtration, an increase in cross flow velocity represents the simplest way to
create turbulence and reduce membrane fouling. Such an increase in cross flow velocity and
thus enhanced permeate fluxes has been obtained by applying static turbulence promoters
with or without superimposing pulsations for creating unsteady flow (Krstić et al., 2006).
Kenics static mixers are the most common static mixers applied in the industry. Some
studies on the use of Kenics static mixers, as turbulence promoters in cross flow membrane
process, have been reported in the literature (Šereš et al., 2006a). A significant decrease of a
gel layer concentration at the membrane surface has been observed (Vatai & Tekić, 1995).
On the other hand, increased power consumption for fluid flow was required because of the
increase of pressure drop along the membrane module with inserted static mixer. Most of
these techniques are applied to ceramic membranes.
Only a few investigations were reported on the problem of ultrafiltration of sugar juice in
the presence of static mixer as turbulence promoter (Šereš et al., 2005; Šereš et al., 2006a;
Šereš et al., 2006b). We will present some results (at laboratory level) related to the
removing undesired molecules from the sugar juice by the use of ceramic membranes,
with and without presence of static mixer, under various working conditions. The process
efficiency is quantified through the achieved values of permeate flux and its colour, while
the working factors were: fluid flow rate, temperature, trans-membrane pressure and
process duration. As treated raw sugar syrup (ca. 60% dry substance) belongs to viscous
fluids, static mixer was expected to improve the permeate flux as well as the separation
process as a whole.
The Application of Membrane Separation Processes as Environmental Friendly
Methods in the Beet Sugar Production 199
3. Material and Methods
Non-affinated sugar from the 2nd stage of crystallization, diluted to 60
o
Bx of dry matter,
was used as material for the investigation of coloured matter separation by UF and for
examining the influence of static mixer on the separation process. Its basic characteristics
corresponded to regular technological quality (Reinefeld & Schneider, 1978); its colour was
1957 and its purity was 98.51%.
The laboratory UF equipment was set up at the Faculty of Food Industry, “Corvinus”
University in Budapest. The flow diagram of the setup is shown in Fig. 1.
Fig. 1. Laboratory setup for ultrafiltration: 1 – feed tank, 2 – thermostat, 3 – pump (0.25 kW),
4 – module with membrane, 5 – vessel for permeate, 6 – vessel for retentate, 7, 8, 9 –
valves, 10 – thermometer, 11, 12 – manometer, 13 – rotameter
The cross-flow filtration was realized on the membrane of 20 nm pore diameter (Membralox
ceramic tubular membrane, SCT, Bazet, France), made of a zirconium oxide layer on an
aluminum oxide support. The membrane was a single channel type 250 mm long, with 6.8
mm inner diameter. The useful membrane surface was 4.62 x 10
–3
m
2
. The effect of
turbulence promotion on filtration performances was investigated by using Kenics static
mixer (FMX8124-AC, Omega), consisting of 30 elements and having aspect ratio (length to
diameter) of 1.
Experiments were performed in accordance with the plan presented in Table 1, where the
lower and the upper boundaries of the independent variables are given. Experiments were
performed without and with the application of static mixer, i.e. in non-static mixer mode
(NSM- mode) and in static mixer mode (SM- mode).
200 ENVIRONMENTAL TECHNOLOGIES: New Developments
NSM- mode SM- mode Independent
variables
Lower
level
Upper
level
Lower
level
Upper
level
Q, L h
-1
150 400 50 400
t,
o
C 70 80 70 80
P, bar 6 10 3 10
τ, h 0 2 0 2
Table 1. Plan of experiments – boundaries of independent variables
A full factorial design was applied and flow rate (Q), temperature (t) and trans-membrane
pressure (P) were kept at two levels, while time (τ) was continually measured together with
the measurements of two dependent variables: permeate flux and colour change. The
permeate colour change is expressed as a difference between the colours of the permeate
and juice, divided by the colour of the initial juice. The colour is quantified by the
absorbance, measured on a spectrophotometer at 420 nm. As for the reproducibility of the
results only those measurements were repeated (more than two times) which gave
significantly different values when twice repeated.
4. Results and Discussion
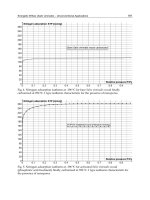
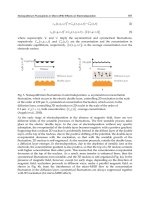
The results of the investigations are presented in Figs. 2-8. The experimental values of the
presented variables were taken at the beginning and at the end of ultrafiltration process,
after 0.5 h and after 2 h. In this way, the process could be analyzed in real time and more
accurate conclusions could be drawn. From the Fig. 2, it can be seen that the greatest flux,
through the ceramic membrane without static mixer, could be reached at temperature of
80
o
C, flow rate 400 L h
-1
and pressure of 10 bar, after 0.5 h of ultrafiltration. It can also be
seen that the best flux through the membrane supplied by static mixer could be reached
under the same conditions. Also, when the pressure was held at 6 – 10 bar and when the
flow rate was lower than 100 L h
-1
, permeate flux (in SM-mode of operation) got high value.
Comparison of fluxes typical of NSM- and SM- mode of operation, at the beginning of
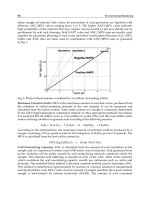
process, did not show significant difference. In Fig. 3, fluxes at the end of ultrafiltration
process were presented. Trends similar to those at the beginning were noticed, but after 2 h
lower absolute values of fluxes were achieved in both modes. However, it could be
concluded that about 30% higher flux was reached in the presence of static mixer, at lower
transmembrane pressure, which is important for energy saving. Flux values measured at
70
o
C, which were not graphically presented due to limited space, were higher in SM-mode
of operation as follows: i) 50% after 0.5 h, ii) 60% after 1 h and iii) 65% after 2 h. As expected,
static mixer has great effect on ultrafiltration of juice with higher viscosity.
The Application of Membrane Separation Processes as Environmental Friendly
Methods in the Beet Sugar Production 201
11
13
14
15
17
18
19
19
20
50 100 150 200 250 300 350 400
3
4
5
6
7
8
9
10
FL U X
SM-mode
t=80
o
C
τ
=0.5 h
P, b ar
Q, L h
-1
13
14
16
17
18
20
21
250 275 300 325 350 375 400
6
7
8
9
10
FL U X
NSM-mo de
t=80
o
C
τ
=0.5 h
P, b ar
Q, L h
-1
Fig. 2. Permeate flux as a function of flow rate and transmembrane pressure at 0.5 h of
ultrafiltration
8.8
10
12
13
13
14
16
17
50 100 150 200 250 300 350 400
3
4
5
6
7
8
9
10
FLUX
SM-mode
t-80
o
C
τ
=2 h
P, b ar
Q, L h
-1
8.7
8.7
9.4
10
11
11
12
13
14
25 0 27 5 300 32 5 35 0 37 5 400
6
7
8
9
10
FLUX
NSM-mode
t=80
o
C
τ
=2 h
P, b ar
Q, L h
-1
Fig. 3. Permeate flux as a function of flow rate and transmembrane pressure at 2 h of
ultrafiltration
By ultrafiltration, in the presence of ceramic membrane with pore size of 20 nm without
static mixer, permeate colour decreased approximately 35% - 40% (see Figs. 4 and 5). These
values could be reached at NSM- mode, while pressure was held at 6 bar and flow rate has
value lower than 250 L h
-1
. However, in the presence of static mixer, following reduction of
colour matter could be achieved: i) 45% after 0.5 h of ultrafiltration and ii) 60% after 2 h of
ultrafiltration. Optimal working conditions are: flow rate between 100 – 200 L h
-1
and
pressure above 6 bar (see Figs. 4 and 5). Obviously, when a static mixer was used the
decolourization of permeate was highly efficient. Comparison between NSM-mode and SM-
mode of operation leads to a conclusion that SM-mode gives greater effects, 30% after 0.5 h
and 55% after 2 h.
202 ENVIRONMENTAL TECHNOLOGIES: New Developments
-3 5
-3 4
-3 3
-3 3
-3 1
-3 1
-3 0
-3 0
-2 9
-2 8
25 0 27 5 300 32 5 35 0 37 5 40 0
6
7
8
9
10
COLOUR
NSM-m ode
t=80
o
C
τ=0. 5 h
P, b ar
Q, L h
-1
-4 5
-4 0
-3 5
-3 0
-2 5
-2 0
-1 5
-1 0
50 100 150 200 250
3
4
5
6
7
8
9
10
COLOUR
SM-mode
t=80
o
C
τ=0. 5 h
P, b ar
Q, L h
-1
Fig. 4. Permeate colour as a function of flow rate and transmembrane pressure at 0.5 h of
ultrafiltration
-3 7
-36
-35
-3 5
-33
-3 1
-3 0
-2 9
25 0 27 5 30 0 32 5 35 0 37 5 40 0
6
7
8
9
10
COLOUR
NSM-m ode
t=80
o
C
τ
=2 h
P, b ar
Q, L h
-1
-5 9
-5 6
-5 3
-50
-4 7
-4 4
-4 0
-40
-3 7
-3 7
50 100 150 200 250
3
4
5
6
7
8
9
10
COLOUR
SM-m ode
t=80
o
C
τ
=2 h
P, b ar
Q, L h
-1
Fig. 5. Permeate colour as a function of flow rate and transmembrane pressure at 2 h of
ultrafiltration
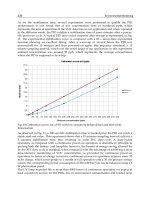
Analysis of the diagram in Fig. 6. showed that the juice colour decreased from 1080 IU to
750 IU. On the other hand, the retentate colour increased up to 1200 IU. At the same time,
the permeate purity (defined as a ratio obtained by dividing the measured values of sucrose
and quantity of dry matter content) increased from 98.9% to 99.7%, while the retentate
purity decreased from 98.9 to 97%. Such a change of purity shows that membrane with 20
nm pore sizes does not reject sucrose molecules and there is no change in permeate dry
matter content (because the main part of dry matter is sucrose).
The Application of Membrane Separation Processes as Environmental Friendly
Methods in the Beet Sugar Production 203
0 20 40 60 80 100 120 140 160
600
700
800
900
1000
1100
1200
95
96
97
98
99
100
Color [IU]
τ [min]
Permeate color [IU]
Retentate color [IU]
Permeate purity [%]
Retentate purity [%]
Purity
[%]
Fig. 6. Colour and purity of permeate and retentate in NSM- mode at flow rate 400 L/h,
pressure at 6 bar and temperature at 80
o
C
-20 0 20 40 60 80 100 120 140 160
600
700
800
900
1000
1100
1200
1300
1400
1500
1600
88
90
92
94
96
98
100
τ [min]
Permeate color [IU]
Retentate color [IU]
Color
[IU]
Permeate purity [%]
Retentate purity [%]
Purity
[%]
Fig. 7. Colour and purity of permeate and retentate in SM- mode at flow rate 400 L/h,
pressure at 6 bar and temperature at 80
o
C
When static mixer was used, the decolourization of permeate was more efficient (see Fig. 7.).
The permeate colour decreased for about 50% while its purity increased for 2%.
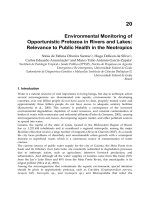
The difference between pressures at opposite sides of the UF- module, as a function of
average working pressure, is shown in the case of SM- mode of operation at 80
o
C in Fig. 8. It
is interesting to observe that an increase of flow rate from 25 to 400 L h
-1
causes an increase
204 ENVIRONMENTAL TECHNOLOGIES: New Developments
of the pressure difference from 0.1 to 3.7 bar. It could be concluded that flow rate has
significant influence on the ultrafiltration when static mixer is used. High pressure drop
along the length of the membrane (Fig. 8.) and therefore the increase in energy consumption
per unit volume of permeate (E) is usually the main disadvantage of configurations with
static turbulent promoters.
Fig. 8. Pressure drop along the length of the membrane (measured before and after UF
module) as a function of the applied pressure in SM- mode at 80
o
C
The loss of hydraulic pressure (HP), due to the pressure drop along the length of the
membrane in the SM-mode and NSM-mode of operation, is presented in Table 2. It is
obtained by multiplying the pressure drop along the length of the membrane to the liquid
velocity. As it is obvious, the loss of hydraulic pressure is much greater in the ultrafiltration
process performed without static mixer compared to the process with the mixer at the same
flux values. Namely, when static mixer is used higher fluxes can be achieved at lower
velocities. At lower velocity, the pressure drop has also lower value. When the permeate
flux increases the loss of hydraulic pressure in NSM- mode and SM- mode become similar.
The results of an analysis of energy consumption per unit volume of permeate (E), in both
modes of operation, are presented in Table 2 as well. Finally, the energy reduction (ER) for
the sake of using static mixer is given. As it is obvious from Table 2, energy reduction is
proportional to the permeate flux values (the greater the flux the higher the energy
reduction). Under the investigated conditions, the energy reduction in SM- mode of
operation reached approximately 85% comparing to NSM- mode.
HP [W] E [kWh/m
3
] J [L/m
2
h]
SM NSM SM NSM
ER [%]
8 0,21 0,56 5,68 15,15 62,51
16 0,28 1,25 3,79 16,91 77,58
20 0,42 2,70 4,55 29,22 84,43
Table 2. Loss of hydraulic pressure due to the pressure drop along the length of the
membrane (HP), energy consumption per unit volume of permeate (E) and energy
reduction due to the presence of static mixer (ER)
0
0.5
1
1.5
2
2.5
3
3.5
4
0 24681012
P (bar)
DP (bar)
Q= 400 L/h
Q= 250 L/h
Q= 150 L/h
Q= 50 L/h
Q= 25 L/h
The Application of Membrane Separation Processes as Environmental Friendly
Methods in the Beet Sugar Production 205
5. Conclusion
The data collected on the impact of the traditional sugar beet processing on the environment
pollution have shown that the greatest disadvantage is related to very high amount of
required energy (mostly for the evaporation). The second important disadvantage is
associated with the high level of water consumption (mostly for the extraction). The third
disadvantage is connected to the purification of sugar juice and removal of non-sucrose
compounds, undesired from the point of view of sugar quality. This chapter is related to the
third disadvantage, which can be avoided or at least decreased by introducing
environmentally friendly operation- membrane separation, instead of traditional operation-
purification by chemically induced precipitation of undesired macromolecules.
Membrane separation is applied in food and chemical industry for several decades but its
application in purification of sugar juices is still under investigations. Aware of the fact that
membrane separations have great potential, many scientists are dealing with their
adjustment to the requirements of sugar-industry. This chapter offers a review of results on
the purification of sugar- beet juices and sugar- cane juices by membrane separations,
mostly at a laboratory level. Despite the encouraging character of these results, very few
large-scale membrane separation processes have been applied in the sugar industry
worldwide. The reason lies in the fact that some weaknesses of the membrane separation
processes have to be reduced before the separation can be applied on a large-scale. One of
the greatest weaknesses is a gradual decrease of permeate flux through membrane caused
by the precipitation of rejected macromolecules on the membrane surface. Among all the
hydrodynamic methods used for improving mass transfer in membrane filtration, an
increase in flow velocity represents the simplest way to create turbulence and reduce
membrane fouling. Such an increase can be obtained by applying static turbulence
promoters- static mixers. Some of our results on static mixer application together with the
results on the same system without mixer application are presented comparatively. It is
concluded that this kind of improvement makes membrane separation process closer to its
industrial application which is highly desired from the point of view of environment
protection.
6. Acknowledgment
These investigations are part of the project No. 142045, supported by the Ministry of Science,
Serbia.
7. References
Anyos, E. (1984). Clarification of sugar-house products by liming and carbonatation, Thesis,
Budapest
Attrige, L.; Erings, A. & Jaferey, I. (2001). Ultrafiltration of beet diffusion juice using spiral
and tubular polymeric membranes, ASSBT 2001, Proceedings of 3rd General meeting,
pp. Vancouver, 2001
Bogliolo, M.; Bottino, A.; Capanelli, G.; De Petro, M.; Servida, A.; Peyyi, G. & Vallini, G.
(1996). Clean water recicle in sugar extraction process: performance analysis of
reverse osmosis in treatment of press water. Desalination, Vol. 108, 261-271, 0011-
9164
206 ENVIRONMENTAL TECHNOLOGIES: New Developments
Cartier, S.; Theoleyre, M.A. & Decloux, M. (1996a). Combination of flocculation and
crossflow filtration for removing colored impurities in raw cane sugar solutions.
Proceedings of the 1996 S:P:R:I. workshop on separation processes in the sugar industry,
New Orleans, USA, April 14-17, Sugar Processing Research Institute inc. (spri),
www.spriinc.org
Cartier, S.; Theoleyre, M.A.; Lancrenon, X. & Decloux, M. (1996b). Membranes Technology
in the Sugar Industry. Proceedings of the 1996 S:P:R:I. workshop on separation processes
in the sugar industry, New Orleans, USA, April 14-17, Sugar Processing Research
Institute inc., (spri), pp. 55, www.spriinc.org
Cartier, S.; Tatoud, L.; Theoleyre, M.A. & Decloux, M. (1997). Sugar refining process by
coupling flocculation and crossflow filtration. Journal of Food Engineering, Vol. 32,
155-166, 0260-8774
Cheryan, M. (1986). Ultrafiltration Handbook, Technomic Publishing Co. Inc., 87762-456-9,
Lancaster, Basel
Chou, C.C. (2002). White and refind sugar production from cane sugar factories. Proceedings
of First Biennial World Conference on Recent Developments in Sugar Technologies, pp. 5,
Delray Beach, Florida USA, May 2002, Dr. Chou Technologies, Inc. New York, USA
and South China University of Technology, Guangzhou, China,
www.esugartech.com
Council Directive 96/61/EC. (1996). Concerning Integrated Pollution Prevention and
Control, Official Journal of the European Communities, No. L 257/26, 10.10.1996.
Decloux, M. & Tatoud, L. (2000). Importance of the control mode in ultrafiltration: case of
raw sugar remelt. Journal of Food Engineering, Vol. 44, 119-126, 0260-8774
Djurić, M.; Gyura, J.; Zavargo, Z.; Šereš, Z. & Tekić, M. (2004). Modelling of ultrafiltration
of non-sucrose compounds in sugar beet processing. Journal of Food Engineering,
Vol. 65, 73-82, 0260-8774
Dornier, M.; Petermann, R. & Decloux M. (1995). Influence of start-up procedure on
crossflow microfiltration of raw cane sugar. Journal of Food Engineering, Vol. 24, 213-
224, 0260-8774
Eszterle, M., Šereš, Z. & Vatai, Gy. (2003). Elimination of colouring substances from sugar
factory syrups by ultra- and nano-filtration. Proceedings of International Conference of
Visegrad Countries, Permea, pp. 69, Tatranska Matliare, Slovakia, September 2003,
Slovak Society of Chemical Engineering, Slovak University of Technology, CD-
ROM
Eszterle, M.; Šereš, Z.; Vatai, Gy. & Gyura, J. (2000). Elimination of colouring substances
from sugar industrial solution by ultrafiltration. Proceedings of the XI International
Conference of Membrane Techniques, pp. 16-17, ISBN 963 8203 97 8, Tata, Hungary,
October 2001, Műszaki és Természettudományi Egyesületek Szövetsége,
Tatabánya
Godshall, M.A.; Vercelotti, J. & Triche, R. (2002). Effect of Macromolecules on Sugar
processing: Comparition of Cane and Beet Macromolecules. Proceedings of 9th
Symposium AVH Association, pp. 23-30 , Reims, France
Gosh, A.M.; Balakrishnan, M.; Dua, M. & Bhagat, J.J. (2000). Ultrafiltration of sugarcane juice
with spiral wound modules: on-site pilot trials. Journal of Membrane Science, Vol. 74,
205-216, 0376-7388
The Application of Membrane Separation Processes as Environmental Friendly
Methods in the Beet Sugar Production 207
Gosh, A. M. & Balakrishnan M. (2003). Pilot demonstration of sugarcane juice ultrafiltration
in an Indian sugar factory. Journal of Food Engineering. Vol. 58, 143-150, 0260-8774
Gyura, J.; Šereš, Z. & Eszterle, M. (2001). Effects of ultra- and nano-filtration on separation of
non-sucrose compounds in sugar industry syrup. Proceeding of 17th International
Congress of Nutrition, pp. 370, ISBN 3-8055 7294-8, Vienna, Austria, August 2001,
Karger Medical and Scientific Publishers, Basel
Gyura, J.; Šereš, Z.; Vatai, Gy. & Békási-Molnár, E. (2002a). Separation of non-sucrose
compounds from the syrup of sugar beet processing by ultra- and nanofiltration
using polymer membranes, Desalination, Vol. 148, 49-56, 0011-9164
Gyura, J.; Šereš, Z. & Békási-Molnár, E. (2002b). Separation of nonsucrose compounds from
the syrup of sugar-beet by ultrafiltration and nanofiltration. Proceeding of
International Congress on Membranes and Membrane Processes, pp. 432, Toulouse,
France, July 2002, Europian Comission, Paris
Gyura, J.; Šereš, Z. & Eszterle, M. (2004). Influence of operating parameters on the
separation of colorants from sugar house juices by ultra- and nanofiltration.
Zuckerindustrie , Vol. 129, 174-180, 0344-8657
Gyura, J.; Šereš, Z. & Eszterle, M. (2005). Influence of operating parameters on separation of
green syrup colored matter from sugar beet by ultra- and nanofiltration. Journal of
Food Engineering, Vol. 66, 89-96, 0260-8774
Hamachi, M.; Gupta, B.B. & Ben Aim, R. (2003). Ultrafiltration: a means for decolorization of
cane sugar solution. Separation and Purification Technology, Vol. 30, 229-239, 1383-
5866
Hatziantoniou, D. & Howell, J.A. (2002). Influence of the properties and characteristics of
sugar-beet pulp extract on its fouling and rejection behaviour during membrane
filtration. Desalination, Vol. 148, 67-72, 0011-9164
Hinkova, A.; Bubnik, Z.; Kadlec, P. & Pridal, J. (2002). Potentials of separation membranes in
the sugar industry. Separation and Purification Technology, Vol. 26, 101-110, 1383-
5866
Integrated Pollution Prevention And Control (2003). Draft Reference on Best Available
Techniques in the Food, Drink and Milk Industry, European Commission, Directorate-
General JRC, Institute for Prospective Technological Studies, European IPPC
Bureau, Seville,
Kochering, V.; Kearney, M.; Jacob, W. & Pryor, T. (2003). Chromatografic purification of raw
beet juice: A lime free technology. Zuckerindustrie, Vol. 128, 667-672, 0344-8657
Koekoek, P.J.W.; Vannispen, J. & Vermuelen, D.P. (1998). Nanofiltration of thin juice for
improvement of juice purification. Zuckerindustrie, Vol. 123, 122-126, 0344-8657
Krstić, D.; Koris, A. & Tekić, M. (2006). Do static turbulence promoters have potential in
cross-flow membrane filtration applications?. Desalination, Vol. 191, No. 1-3, 371-
375, 0011-9164
Kwok, R.J. (1996). Production of super VLC raw sugar in Hawaii. Experience with the new
NAP ultrafiltration /softening process. International Sugar Journal, Vol. 98, 490-496,
0020-8841
Lipnizki, F.; Carter, M. & Tragardh, G. (2006). Applications processes in the beet and cane
sugar production. Zuckerindustrie , Vol. 131, No. 1, 29-38, 0344-8657
Madsen, R. F. (1973). Application of UF and RO to cane juice. International Sugar Journal,
Vol. 75, 163-167, 0020-8841
208 ENVIRONMENTAL TECHNOLOGIES: New Developments
Martoyo, T.; Hino, M.; Nagase, H. & Bachtiar, A. (2000). Pilot test on ultrafiltration of cane
raw juice at the Indonesian plantation white Kedawoeng sugar factory.
Zuckerindustrie, Vol. 125, 787-792, 0344-8657
Nene, S.; Kaur, S.; Sumod, K.; Joshi, B. & Ragharavarao, K.S.M.S. (2002). Membrane
distillation for the concentration of raw cane sugar syrup and membrane clarified
sugarcane juice. Desalination, Vol. 147, 157-160, 0011-9164
Nielsen, W.K.; Kristensen, S. & Madsen, R.F. (1982). Prospects and possibilities in
application of membrane filtration systems within beet and cane sugar industry.
Sugar Technology Reviews, Vol. 9, 59-117, 0081-9204
Reinefeld, E. & Schneider, F. (1978). Analitische Betriebskontrolle der Zuckerindustrie (Teil B),
Verlag Dr. Albert Bartens, Berlin,
978-3-87040-019-4
Schrevel, G. (2002). Separation of macromolecules in beet sugar processing. Zuckerindustrie ,
Vol. 127, 768-769, 0344-8657
Šereš, Z.; Gyura, J.; Eszterle, M. & Vatai, Gy. (2004). Coloured matters removal from sugar
beet industry syrup by ultra- and nano-filtration. Acta alimentaria, Vol. 33, No. 2,
119-127, 0139-3006
Šereš, Z.; Gyura, J.; Eszterle, M. & Vatai, Gy. (2005). Separation of non-sucrose compounds
from syrup as a part of the sugar-beet production process by ultrafiltration with
ceramic membrane. Membrane Science and Technology Conference of Visegrad
Group - Permea 2005, Polanica Zdroj, Poland, CD
Šereš, Z.; Gyura, J.; Eszterle, M. & Djuric, M. (2006a). Separation of non-sucrose compounds
from syrup as a part of the sugar-beet production process by ultrafiltration with
ceramic membranes. European Journal of Food Engineering, Vol. 223, 829-636, 0260-
8774
Šereš, Z.; Gyura, J.; Tekić, M. & Jokić, A. (2006b). The influence of the kenics static mixer on
raw sugar solution ultrafiltration, Book of Abstracts of International Workshop on
Quality of Food and Beverages in the Frame of EU Standards, p. 36, Bucharest,
Romania, February 2006, Balkan Environmental Association (B.EN.A.) and
Romanian Academy of Agricultural and Forestry Sciences (AAFS), Bucharest
Tebble, I.; Nelson, R. & Sargent D. (2002). The use of membrane filtration to reduce lime
usage in purification. Zuckerindustrie, Vol. 127, No. 8, 600-603, 0344-8657
Urbaniec, K.; Zalewski, P. & Zhu X. X. (2000). A Decomposition Approach for Retrofit
Design of Energy Systems in the Sugar Industry. Applied Thermal Engineering, Vol.
20, No. 15-16, 1431-1442, 1359-4311
Poel, Van der, P.; Schiweck, H. & Schwartz, T. (1998). Sugar Technology – Beet and Cane Sugar
Manufacture, Verlag Dr. Albert Bartens,
978-3-87040-065-1, KG – Berlin
Vatai, Gy. & Tekic, M. (1995). Convection promotion and gel formation in an ultrafiltration
process. Chem. Eng. Comm., Vol. 132, 141-149
Willet, C.C. (1997). The A.B.C. process for the production of refined sugar from beets.
International Sugar Journal, Vol. 99, 48-50, 0020-8841
14
Assessment of Air Quality in an
Urban Area of Belgrade, Serbia
Mirjana Tasić
a
, Slavica Rajšić
a
, Milica Tomašević
a
, Zoran Mijić
a
, Mira
Aničić
a
, Velibor Novaković
a
, Dragan M. Marković
a
, Dragan A. Marković
b
,
Lazar Lazić
c
, Mirjana Radenković
d
and Jasminka Joksić
d
a
Institute of Physics, Belgrade, Serbia
b
Faculty of Applied Ecology, Singidunum University, Belgrade, Serbia
c
Institute of Meteorology, Faculty of Physics, Belgrade, Serbia
d
Institute of Nuclear Science Vinča, Belgrade, Serbia
1. Introduction
Clean air is considered to be a basic requirement for human health and well being. Various
chemicals are emitted into the air from both, natural and anthropogenic sources. In spite of the
introduction of cleaner technologies in industry, energy production and transport, air pollution
remains a major health risk and tighter emission controls are being enforced by many
governments. In humans, the pulmonary deposition and adsorption of inhaled chemicals from
the air can have direct consequences on health. Public health can also be indirectly affected by
deposition of air pollutants in environmental media and uptake by plants and animals,
resulting in chemicals entering the food chain or being present in drinking water, and thereby
constituting additional sources of human exposure. Furthermore, the direct effects of air
pollutants on plants, animals and soil can influence the structure and function of ecosystems,
including their self-regulation abilities, thereby and thus affecting the quality of life.
According to the most recent update of the WHO (World Health Organization) air quality
guidelines, many studies were published that had investigated the effects of air pollution on
human health. Particulate matter pollution is nowadays one of the problems of the most
concern in great cities, not only because of the adverse health effects, but also for the
reducing atmospheric visibility and affect to the state of conservation of various cultural
heritages (Van Grieken & Delalieux, 2004). On a global scale, particulate matter (PM) also
influences directly and/or indirectly the Earth’s radiation energy balance, and can
subsequently impact on global climate change (IPCC, 2001).
The measurement of the levels of atmospheric particulate matter is a key parameter in air
quality monitoring throughout the world regarding the cause/effect relationship between
exposure PM levels and health impacts (WHO, 2002; WHO, 2003). A number of
epidemiological studies (Dockery & Pope, 1994, 2006; Schwartz et al., 1996, 2001) have
demonstrated that acute and chronic health effects are related to the inhalable PM
10
(aerodynamic diameter less than 10 μm) exposure in the urban environment, and some data
also seem to indicate possible seasonal effects of the particulate matter on human health.
This is especially important for urban aerosols, whose variety of size and composition make
complete characterization a difficult task.
210 ENVIRONMENTAL TECHNOLOGIES: New Developments
As a result of health and environmental impacts of PM, more rigorous regulations are in
force in the USA and European countries. PM standards, issued by European Commission
(EC), have included PM
10
monitoring and limit values in the Air Quality Directive in 1999
(EC, 1999). Directive established in the first stage, annual limit value of 40 μg m
-3
and 24 h
limit value of 50 μg m
-3
(not to be exceeded more than 35 times in a calendar year) to be met
by 2005, and in the second stage annual limit value of 20 μg m
-3
and 24h limit value of 50 μg
m
-3
( not to be exceded more than 7 times a calendar year) to be met by 2010.
Although the current focus on health-related sampling of particulate matter is on PM
10
,
recent research pointed out more serious health effect of fine particles, PM
2.5
(aerodynamic
diameter less than 2.5 μm), and even PM
1.0
(aerodynamic diameter less than 1.0 μm) (Vallius
et al., 2005; Ariola et al., 2006) and signed that the health effects associated with PM are
related mostly to anthropogenic emission sources. EC has also established average PM
2.5
annual limit of 20 μg m
-3
(EN 14907, 2005) and current WHO Air Quality Guidelines set 10
μg m
-3
as annual average and 25 μg m
-3
as 24 h average (WHO, 2006).
Within the European Program for Monitoring and Evaluation of the Long-Range
Transmission of Air Pollutants (EMEP), measurements of PM
10
and trace metals, as highly
toxic species, have been introduced. Spatial and temporal variation of atmospheric aerosol
particles also gained in significance and resulted in an increased interest in the use of
analytical techniques capable of measuring the size, morphology, and chemical composition
of individual aerosol particles. Such data are essential for an understanding of particle
formation, transport, transformation and deposition mechanisms, as well as, the impact of
particles inhaled by a respiratory system.
The studies of the transport and mobilization of trace metals up to now have attracted
attention of many researchers (Nriagy & Pacyna, 1988; Pacyna et al., 1989; Alcamo et al.,
1992). Trace metals are persistent and widely dispersed in the environment and interacting
with different natural components results in toxic effects on the biosphere.
Trace elements are released into the atmosphere by human activities, such as combustion of
fossil fuels and wood, high temperature industrial activities and waste incinerations. The
combustion of fossil fuels constitutes the principal anthropogenic source for Be, V, Co, Ni,
Se, Mo, Sn, Sb, and Hg. It also contributes to anthropogenic release of Cr, Mn, Cu, Zn, and
As. High percentages of Ni, Cu, Zn, As, and Cd are emitted from industrial metallurgical
processes. Exhaust emissions from gasoline may contain variable quantities of Ni, Cu, Zn,
Cd, and Pb (Samara et al., 2003). Several trace metals are emitted through the abrasion of
tires (Cu, Zn, Cd) and brake pads (Sb, Cu), corrosion (V, Fe, Ni, Cu, Zn, Cd) lubricating oils
(V, Cu, Zn, Mo, Cd) or fuel additives (V, Zn, Cd, Pb) (Pacyna & Pacyna, 2001; Ward, 1990;
Sutherlan & Tolosa, 2000). The platinum group of elements, Rh, Pd and Pt, represent a
relatively new category of traffic related trace metals in the environment, specially urban
one, due to their application in automobile catalytic converters since the beginning of the
1980s (Haus et al., 2007).
Most of the trace metals are emitted in particulate form (Molodovan et al., 2002) and are
present in almost all aerosol size fractions, but mainly accumulated in the smaller particles
(Espinosa et al., 2001). This has a great effect on the toxicity of metals since the degree of
respiratory penetration depends on particle size (Dockery and Pope, 1994, 2006; Espinosa et
al., 2001). Urban anthropogenic particles are mainly in the PM
2.5
range and their sampling
diminishes the interference of natural sources and reduces the loss of potentially volatile
components such as ammonia and chloride. They could remain in the air with relatively
Assessment of Air Quality in an Urban Area of Belgrade, Serbia 211
long residence time and could efficiently penetrate human lungs, and cause greater
response in epithelial cells of human respiratory tract (Li et al., 2002, 2003). In addition to
the PM mass limit values, also based on health impact criteria, recent European Union (EU)
standards set target (Ni, As, Cd) and limit (Pb) values for metals and polycyclic aromatic
hydrocarbons (PAHs) (EC, 1999; Directive 2004/107). Environmental technologies may have
to be adopted in specific industrial spots to reach the target values. For aimed reduction of
PM
10
or PM
2.5
levels detailed knowledge of sources and their respective contribution to the
PM levels, is required.
Most trace elements in terrestrial ecosystems originate from atmospheric wet and dry
deposition. From a biogeochemical perspective, the characterization of total atmospheric
deposition is relevant in order to identify the variability and sources of the atmospheric
pollutants (Azimi et al., 2005). Direct collection of atmospheric deposition using bulk
sampling devices offers a practical approach to monitor atmospheric heavy metal
deposition providing valuable information on the influences of atmospheric inputs of heavy
metals on the surface environment (Morselli et al., 2003; Azimi et al., 2003). Bulk sampling
has been extensively used, since the samplers are easier to operate than wet-and-dry ones.
The limitation of this sampling method is mainly possible under-estimation of fluxes;
advantages are integration of samples over 1 month and the possibility of large-scale
application with low-cost equipment.
Studies on atmospheric contamination have frequently been limited by high cost of
instrumental monitoring methods and difficulties in carrying out extensive sampling in
time and space. For these reasons, there is an increasing interest in using indirect
monitoring methods such as the use of organisms that may act as bioaccumulators.
Biomonitoring of trace elements from atmospheric deposition can be currently evaluated by
environmental biomonitors such as mosses, lichens and higher plants (Rühling & Tyler,
1971; Steinnes et al., 1992; Markert, 1993; Bargagli, 1998; Bargagli et al., 2002; Adamo et al.,
2003). Native mosses and lichens have often been used in passive biomonitoring, and have
several advantages as compared to higher plants. They lack a developed root system, so
they rely on atmospheric wet and dry deposition for their mineral nutrition; they have a
high surface/volume ratio and cation exchange capacity; unlike many other plants, they
lack variability of morphology through the growing season and they have no cuticle (Tyler,
1990; Bargagli, 1998).
The heavy metals in mosses survey, first introduced in Scandinavia (Rühling & Tyler, 1968),
has been repeated since 1980, at five-years intervals, with an increasing number of
participating countries ( UNECE ICP Vegetation,
2003). The survey has provided data on heavy metals concentration in naturally growing
mosses throughout Europe, and there is substantial database for assessment of pollution
level and identification of pollution sources. The standardized procedures for obtaining
moss samples included collecting the preferred moss species: Hylocomium splendens,
Pleurozium schreberi, Hypnum cupressiforme. As previously recommended species are not
widespread in arid areas of southern European countries, it is necessary to find
corresponding alternate moss species for monitoring studies.
In highly polluted areas of industrial or urban environment, terrestrial plants can act as
appropriate bioindicators and biomonitors. Although biomonitoring of air quality using
plants has been practiced for many years, in many European countries, it has still not been
applied at a satisfactory level, due to different, and even opposite results, depending, first of
all, on plant species. Therefore, efforts towards setting up the large European projects to
212 ENVIRONMENTAL TECHNOLOGIES: New Developments
biomonitor air quality have been made recently (Klumpp et al., 2002). Trees are very
efficient at trapping atmospheric particles, and they have a special role in reducing the level
of fine, “high risk” PM
2.5
, with the potential to cause serious human health problems. Thus,
the use of plant leaves, primarily, as accumulative biomonitors of trace metal pollution has
attained great ecological importance (Markert, 1993; Bargagli, 1998; WHO, 2000; Mignorance
& Rossini, 2006).
Leaves of various tree species, both evergreen and deciduous, have been tested for this
purpose in urban areas (Alfani et al., 1996; Monaci et al., 2000), including a search for
sensitive tree species and approval of the validity of using such leaves as biomonitors. It is
well known that metal pollution leads to physiological disturbances in plants and affects the
biogeochemical balance and stability of their habitats. Metal uptake in higher vascular
plants takes place through their root system, additionally through the leaves and, therefore,
it is difficult to distinguish whether the accumulated elements originate from the soil or
from the air (Harrison & Johnston, 1987; Verma & Singh, 2006). The research of heavy
metals contamination of vegetation requires the use of standard methodological procedures
(Markert, 1993; Bargagli, 1998). One of the most important is the representative sampling of
plant material.
Ground level ozone (O
3
) and other photochemical oxidants have become pollutants of
concern because elevated concentrations are known to cause detrimental effects and
threaten human health (WHO, 2003; Mulholland et al., 1998), vegetation and objects.
Moreover, in recent years there have been numerous reports of an association between
increases in particle air pollution (PM
10
) and ozone concentration (Meng et al., 1997;
Mulholland et al., 1998; Ying & Kleeman, 2003). In order to protect human health and
ecosystem, EU has set limits for ozone concentrations (Directive 2002/03/EC). The
information threshold is the same as in the previous Directive being 180 μg m
-3
(the hourly
average concentration of 240 μg m
-3
, measured over three consecutive hours is set as an alert
threshold). High ozone levels are mainly observed during periods with warm and sunny
weather in combination with stagnant air masses and the build-up of precursor substances,
such as nitrogen oxides (NO
x
), carbon monoxide (CO) and volatile organic compounds
(VOCs).
Although PM, above all PM
10
or PM
2.5
, is of great concern for public health, no systematic
studies have been performed in Belgrade until recently. The studies on the quality of air in
urban atmosphere related to suspended particles PM
10
and PM
2.5
, and the first
measurements of their mass concentrations have been initiated in Serbia in 2002, and are
still in progress. The results of preliminary investigations revealed the need for the
continuous and long-term systematical sampling, measurements and analysis of interaction
of the specific pollutants – PM
10
, PM
2.5
and trace metals in the ground level (Tasić et al.,
2001; Rajšić et al., 2004a, b).
In 2002, the national project “Air Quality Studies in Belgrade Urban Area: Suspended
Particles, Heavy Metals and Radionuclides”, financed by The Ministry for Science and
Environmental Protection of the Republic of Serbia, has started. At present, the project
“Emission and Transmission of Pollutants in an Urban Atmosphere”, is running, and
includes measurements of trace and other elements (Al, V, Cr, Mn, Fe, Ni, Cu, Zn, As, Cd,
Pb, etc.) concentration in particulate matter, PM
10
and PM
2.5
, bulk atmospheric deposition,
soil, plant leaves, mosses, and natural and man made radionuclides (Be-7, Cs-137, Pb-210),
and ground level ozone. The objective of the project is to assess air quality and to identify