Environmental Monitoring Part 8 doc
Bạn đang xem bản rút gọn của tài liệu. Xem và tải ngay bản đầy đủ của tài liệu tại đây (4.78 MB, 35 trang )
Environmental Monitoring
236
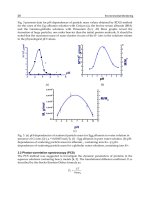
As for the stabilisation time, several experiments were performed to qualify the PID
performance; it was found that at low concentration (tens or hundreds ppb), which
represents the area of operation of the VOC detectors in our application and when operated
in the diffusion mode, the PID exhibits a stabilisation time of some minutes after a power-
off/power-on cycle. A typical PID duty cycled response after storage is represented in Fig.
11. The experimental stabilisation curve is compared with a 80 s decay-time exponential
function showing an excellent fitting. After a warm-up of several hours the PID was
powered-off for 15 minutes and then powered-on again; thie sequence simulated a 15
minute sampling interval, which was the initial target of our application; in this experiment
ambient concentration was around 50 ppb, which represents the average concentration
where the PID is supposed to be set up.
Fig. 10.Calibration curves for a PID with low sensitivity before (blue) and after (red)
linearisation
As observed in Fig. 11, a 300 seconds stabilisation time is needed prior the PID can reach a
stable read-out value. This experiment shows that a 15 minutes sampling interval calls for a
5 minutes stabilisation time, thus resulting in some 30% duty-cycle. A duty-cycled
operation, as compared with a continuous power-on operation, is desirable in principle to
prolong both the battery- and lamp-life; however, the benefit of energy saving allowed for
by the 30% duty cycle is marginal, when compared with the advantage of achieving a more
time-intensive monitoring of VOC concentration, as provided by continuous power-on
operation. In terms of energy resources, continuous power-on operation requires some 35
mAh charge, which corresponds to 1 month of full operation with a 30 Ah primary energy
source; the corresponding power consumption of 360 mW@12 Vdc can be balanced using a 5
W photovoltaic panel.
The UV lamp expected life is more than 6000 hours of continuous operation; we expect at
least a quarterly service for the PIDs, due to environment contamination and related lamp
Real-Time Monitoring of Volatile Organic Compounds in Hazardous Sites
237
efficiency degradation. For those reasons it was decided to operate the PID in continuous
operation mode.
Fig. 11. PID stabilisation curve on duty-cycled power-on
10. Experimental results
Data from the field are forwarded to a central database for data storage and data rendering.
A rich and proactive user interface was implemented, in order to provide detailed graphical
data analysis and presentation of the relevant parameters, both in graphical and bi-
dimensional format. Data from the individual sensors deployed on the field can be directly
accessed and presented in various formats by addressing the appropriate sensor(s)
displayed on the plant map, see Fig 12 left.
The position of each SN and EN unit is displayed on the map; by positioning the mouse
pointer over the corresponding icon, a window opens showing a summary of current
parameter values.
A summary of the sensor status for each deployed unit can be obtained by opening the
summary panel, Fig. 12, right. The summary panel reports current air temperature/humidity
values, along with min/max values of the day (left lower, in Fig. 12), wind speed and direction
(left upper, in Fig. 12), and VOC concentration (right, in Fig. 12), in the last six hours. A
graphic representation of data gathered by each sensor on-the field can be obtained by
opening the graphic panel window, see Fig. 13.
The graphic panel allows anyone to display the stored data in any arbitrary time interval in
graphic format; up to six different and arbitrarily selected sensors can be represented in the
same graphic window for purpose of analysis and comparison.
Environmental Monitoring
238
Fig. 12. Plant lay-out and details of the sensors
In Fig. 13 left, the VOC concentration traces of three different detectors are represented in a
period of one day; in Fig. 13 right, the same data are displayed in a period of 30 days. By
using the pointer, it is possible to select a time sub-interval and to obtain the corresponding
graphic representation at high resolution.
Fig. 13. Representation of sensor data in graphic format
In Fig. 13 left, the VOC concentration background is around 50 ppb; thanks to the very
intensive sample-interval, 1 minute, the evolution of the concentration in time, along with
other relevant meteo-climatic parameters can be very accurately displayed; it should be
noted that the spikes which can be observed in the blue trace, Fig. 13 left, have a duration of
some 3 minutes. The multi-trace graphic feature is very useful to perform correlation
between different parameters. In Fig. 14 two examples of correlation between WSD and
VOC concentration are shown. In Fig. 14 left, the VOC concentration, green line, exhibits a
night/day variation; this is compared with the wind speed, rosé line, which increases
during the day hours and decreases during the night hours, very likely due to the thermal
activity. As it can be observed, in fact, wind speed and VOC concentration are in phase
opposition, i.e. the greater the wind speed, the lower the average VOC concentration in the
plant, that is in good agreement with what one can expect.
Real-Time Monitoring of Volatile Organic Compounds in Hazardous Sites
239
Fig. 14. Correlation between wind speed and VOC concentration
The effect of a sudden wind speed increase, light green line, is shown on the right graph of
Fig. 14 right. It can be observed a wind speed increases to some 5m/s and more, green line,
around 10 pm; accordingly, the VOC concentration detected by the three PIDs deployed in
the plant is suddenly decreased. It should be noted that the three PIDs are located several
hundred meters far apart each other.
Fig. 15. Multi-trace read-outs of the six VOC sensors deployed around the ST40 plant
In Fig. 15, the read-outs of the 6 VOC sensors deployed around the ST40 plant are
represented; it should be noted the very good uniformity among the background
concentration levels demonstrating the effectiveness of the calibration procedure.
The user interface can perform various statistics on the data items; in the graphic panel, the
user can enter the inspection mode, see the button on the lower right in Fig. 16, and set an
user defined inspection window (in white); the window can be set over an arbitrary time
interval; parameters like max/min, arithmetic mean and maximum variation can be then
obtained for each of the sensor represented in the graphic window, lower right.
The sensitivity of the PID sensor is demonstrated in Fig. 17, where the traces of two different
PIDs are shown. The PIDs are located some 500 meters far apart. At the time of data
recording, there were some maintenance works going on in the plant’s area.
The VOC components due to maintenance works were detected by the PIDs and recorded as
small variation of the concentration around the mean value during the working hours (from
8 am to 6 pm, roughly), to be compared with the more smoothed traces recorded during the
night. A diagnostic panel is available to evaluate the system Quality of service (QoS) and the
gathered data reliability, see Fig. 18; connectivity statistics are displayed along with the
Environmental Monitoring
240
current status of connectivity for each of the SN and EN units. The status of the GPRS
connectivity and the related statistics are represented in column 3 and 6 from left,
respectively.
Fig. 16. Statistical parameters analysis
Fig. 17. Day/night VOC read-outs
As it can be observed, GPRS connectivity in excess of 99% is obtained, because of the periodic
restart of the SN unites which do not get connected for a short time interval, and thus reducing
Real-Time Monitoring of Volatile Organic Compounds in Hazardous Sites
241
the overall GPRS efficiency figure. EN unit status and connectivity are displayed in the
columns 4 and 9 from left, while power supply status is showed in column 5 from left.
The diagnostic panel identifies any lack of connectivity and/or reliability of each single SN
or EN unit for immediate service action.
Fig. 18. The diagnostic panel
In addition to the graphic format, data items can be represented in a bi-dimensional format. It
is quite difficult to correlate the data in graphic format from different sensors deployed over
the plant; a helpful bi-dimensional picture of the area based on an interpolation of algorithms
has been implemented, resulting in a very synthetic representation of the parameters of
interest over the plant in pseudo-colours. The sensors are basically punctual and, thus, are
only representative of the area in their proximity. For that reason the interpolation would be
only effective if an adequate number of sensors is deployed on the field, so that the area is
subdivided into elementary cells, quasi- homogeneous in terms of the parameter values.
This requirement would result in an unnecessarily high number of units to be deployed. A
more effective approach is to take into account the morphology and functionality of the
different areas of the plant and deploy the sensors accordingly.
As for the VOC, by instance, the potential sources of VOC emissions in the plant are located
in well identified areas like, the chemical plant and the benzene tanks; accordingly, the
deployment strategy includes a number (6) of VOC sensors surrounding the chemical plant
infrastructure, thus resulting in a virtual fence, capable of effectively evaluating VOC
emissions on the basis of the concentration pattern around the plant itself.
As for wind speed and direction, which are relevant for correlation with VOC concentration,
on the basis of an evaluation of the plant infrastructures, the areas of potential turbulence
were identified and the wind sensors were deployed accordingly. Both SN and EN units
were equipped with RHT sensors, whose cost is marginal. In Fig. 19 two bidimensional
pictures of the temperature (left) and RH (right) in the area of the plant are represented.
Not surprisingly, both temperature and RH are not uniformly distributed; according to the
colour scale of air temperature blue means lower temperature and red means higher
temperature; in this case the temperature ranges from 28°C (blue) to 31°C (red). Two areas
of higher temperature are clearly identified, one on the left around the chemical plant ST40
Environmental Monitoring
242
and the other on the right around the arrival of the pipeline; this is obviously related to the
mechanical activity in those areas. The thermal distribution also influences the air RH as
demonstrated in Fig. 19, left. In this case the grey colour means lower RH and the blue
colour means higher RH.
The RH values range from 26% to 33%, in this case. The temperature gradient among the
different areas in the plant, which in some cases grew to up 5°C, is responsible of some
thermal activity possibly affecting the VOC concentration distribution.
Fig. 19. Bi-dimensional map of air temperature (left) and air RH (right) distribution in the
area of the plant
Fig. 20. Bi-dimensional map representing VOC concentration in the plant
VOC concentration is mapped in Fig. 20 in pseudo-colours. In this case blue denotes lower
concentration, while red denotes higher concentration; it should be emphasized that the red
colour has no reference with any risky or critical condition at all, beings only a chromatic
option.
Real-Time Monitoring of Volatile Organic Compounds in Hazardous Sites
243
As it can be noted, wind direction represented by blue arrows is far by being uniform over
the plant, thus denoting turbulences due to the plant infrastructures and surrounding
vegetation.
11. Conclusions
An end-to-end distributed monitoring system integrating VOC detectors, capable of
performing real-time analysis of gas concentration in hazardous sites at unprecedented
time/space scale, has been implemented and successfully tested in an industrial site
The aim was to provide the industrial site with a flexible and cost-effective monitoring tool,
in order to achieve a better management of emergency situations, identify emission sources
in real time, and collect continuous VOC concentration data using easily re-deployable and
rationally distributed monitoring stations.
The choice of collecting data at minute time interval reflects the need to identify short term
critical events, quantify the emission impacts as a function of weather conditions and
operational process, and identify critical areas of the plant.
The choice of a WSN communication platform gave excellent results, above all the
possibility to re-deploy and re-scale the network configuration according to specific needs,
while greatly reducing installation cost. Furthermore, to manage real-time data through a
web based interface allowed both adequate level of control and quick data interpretation in
order to manage critical situations.
Among the various alternatives available on the market, the choice of PID technology
proved to meet all the major requirements. PIDs are effective in terms of energy
consumption, measuring range, cost and maintenance, once installed in the field. The
installation of weather sensors at the nodes of the main network stations allowed for a better
understanding of on-field phenomena and their evolution along with clearer identifcation of
potential emission sources.
Future activity will include a number of further developments, primarily the development
of a standard application to allow the deployment of WSN in other network industries (e.g.
refineries) and an assessment of potential applications for WSN infrastructure monitoring of
other environmental indicators.
12. Acknowledgement
This work was supported by eni SpA under contract N.o 3500007596. The authors wish to
thank W O Ho and A Burnley, Alphasense Ltd., for many helpful comments and
clarifications concerning the PID operation, S Zampoli and G Cardinali, IMM CNR Bologna,
for many discussions on PID characterisation and E Benvenuti, Netsens Srl, for his valuable
technical support.
Assistance and support by the Management and technical Staff of Polimeri Europa Mantova
is also gratefully acknowledged.
13. References
Adler R.; Buonadonna, P. Chhabra, J. Flanigan, M. Krishnamurthy, L. Kushalnagar, N.
Nachman, L. & Yarvis M. (2005). Design and Deployment of Industrial Sensor
Networks: Experiences from the North Sea and a Semiconductor Plant in ACM SenSys,
November 2-4, 2005, San Diego, CA.
Environmental Monitoring
244
Alphasense Ltd.; Application Note AAN 301-02
Dargie W.; & Poellabauer, C. (2010). Fundamentals of wireless sensor networks: theory and
practice. John Wiley and Sons, ISBN 978-0-470-99765-9, 168–183, 191–192
EC Working Group on Guidance for the Demonstration of Equivalence, Guide to the
Demonstration of Equivalence of Ambient Air Monitoring Methods, January 2010
European Commission, Integrated Pollution Prevention and Control (IPPC): Reference Document
on Best Available Techniques for Mineral Oil and Gas Refineries , February 2003
European Commission, Integrated Pollution Prevention and Control (IPPC): Reference Document
on Best Available Techniques in the Large Volume Organic Chemical Industry, February
2003
European Commission, Integrated Pollution Prevention and Control (IPPC): Reference Document
on the General Principles of Monitoring, July 2003
European Parliament and Council, DIRECTIVE 2008/50/EC on ambient air quality and cleaner
air for Europe, 21 May 2008
European Parliament and Council, DIRECTIVE 2010/75/EU on industrial emissions (integrated
pollution prevention and control), 24 November 2010
ISPRA, Database of historical emissions of main pollutants in Italy by sectors
J. Jeong J.; Culler. D.E & Oh. J. H. (2007). Empirical analysis of transmission power control
algorithms for wireless sensor networks in Proc. 4th Intl. Conf. on Networked Sensing
Systems (INSS '07), Piscataway, NJ: IEEE Press, 2007, pp. 27-34.
Karl, H.; & Willig, A. “Protocols and Architectures for Wireless Sensor Networks”, Wiley,
1st Edition.
Locke D.C.; & Meloan, C. E. (1965). Study of the Photoionisation Detector for Gas
Chromatography, in Vol. 37, No. 3, March 1965 pp. 389-397.
Lorincz K.; Malan, D. Fulford-Jones. T.R.F. Nawoj. A. Clavel A. Shnayder, V. Mainland, G.
Moulton. S. & Welsh M (2004). Sensor Network for Emergency Response: Challenges and
Opportunities” In IEEE Pervasive Computing, Special Issue on Pervasive
Computing for First Response, Oct-Dec 2004.
Pakzad S. M.; Fenves, G. L. Kim, S. & Culler. D. E. (2008). Design and Implementation of
Scalable Wireless sensor Network for Structural Monitoring. In ASCE Journal of
Infrastructure Engineering, March 2008, Volume 14, Issue 1, pp. 89-101.
Price J. G. W.; Fenimore. D.C. Simmonds, P.G. & Zlatkis A. (1968). Design and Operation of a
Photoionization Detector for Gas Chromatography, in Analytical Chemistry, Vol. 40,
No. 3, March 1968, pp. 541, 547.
R. Szewczyk R.; Mainwaring, A. Polastre, J. & Culler, D. E. (2004). An Analysis of a Large Scale
Habitat Monitoring Application. ACM Conference on Embedded Networked Sensor
Systems (SenSys), November 2004.
Sohraby, K.; Minol, D. & Znati, T. (2007). Wireless sensor networks: technology, protocols, and
applications. John Wiley and Sons, 2007 ISBN 978-0-471-74300-2, pp. 203–209
Stoianov I.; Nachman, L. & Madden, S. (2007). PIPENET: A Wireless Sensor Network for
Pipeline Monitoring IPSN’07, April 25-27, 2007, pp. 264-273 Cambridge,
Massachusetts, U.S.A.
15
Land Degradation of the Mau Forest
Complex in Eastern Africa: A Review for
Management and Restoration Planning
Luke Omondi Olang
1
and Peter Musula Kundu
2
1
Department of Water and Environmental Engineering,
School of Engineering and Technology, Kenyatta University, Nairobi,
2
Department of Hydrology and Water Resources,
University of Venda, Thohoyandou,
1
Kenya
2
South Africa
1. Introduction
The Mau Forest Complex is the largest closed-canopy montane ecosystem in Eastern Africa.
It encompasses seven forest blocks within the Mau Narok, Maasai Mau, Eastern Mau,
Western Mau, Southern Mau, South West Mau and Transmara regions. The area is thus the
largest water tower in the region, being the main catchment area for 12 rivers draining into
Lake Baringo, Lake Nakuru, Lake Turkana, Lake Natron and the Trans-boundary Lake
Victoria (Kundu et al., 2008; Olang & Fürst, 2011). However, in the past three decades or so,
the Mau Forest Complex (MFC) has undergone significant land use changes due to
increased human population demanding land for settlement and subsistence agriculture.
The encroachment has led to drastic and considerable land fragmentation, deforestation of
the headwater catchments and destruction of wetlands previously existing within the fertile
upstream parts. Today, the effects of the anthropogenic activities are slowly taking toll as is
evident from the diminishing river discharges during periods of low flows, and
deterioration of river water qualities through pollution from point and non-point sources
(Kenya Forests Working Group [KFWG], 2001; Baldyga et al., 2007). Augmented by the
adverse effects of climate change and variability, the dwindling land and water resources
has given rise to insecurity and conflicts associated with competition for the limited
resources. It is hence becoming urgently important that renewed efforts are focused on this
region to avail better information for appropriate planning and decision support.
Such a process will nonetheless, require an integrated characterization of the changing land
and water flow regimes, and their concerned socio-economic effects on resource allocation
and distribution (Krhoda, 1988; King, et al., 1999). Assessing the impacts of the
environmental changes on water flow regimes generally require provision of time series
meteorological, hydrological and land use datasets. However, like in a majority the
developing countries, the MFC does not have good data infrastructure for monitoring
purposes (Corey et al., 2007; Kundu et al., 2008). A majority of research studies in the area
Environmental Monitoring
246
have relied on low resolution land cover datasets, including approximate physically-based
procedures to understand the space and time surface alterations. Renewed efforts are thus
underway in the MFC at present in order to avail high resolution information to be used for
updating the existing databases with a view of improving future forecasts for restoration
management as shown in Figure 1. Datasets from relevant research organization such as the
World Agro-forestry Centre (ICRAF), Regional Centre for Mapping of Resources for
Development (RCMRD), Regional Disaster Management Center of Excellence (RDMCOE)
and IGAD – Climate Prediction and Application Centre (ICPAC) are hence being
harmonized for use in evaluating the environmental effects of spatial changes, especially
within hotspot regions of the complex. Cost effective computer-based techniques, which can
efficiently analyze diverse physically-based variables are also under consideration to
enhance the application of appropriate distributed-based management interventions
(Kundu, 2007; Olang, 2009).
Fig. 1. Location of the five water towers of Kenya, including the MFC region
(Mosaiced images of Landsat 2000).
Furthermore, with continued advancements in global remote Sensing (RS) and GIS
monitoring techniques, it is increasingly becoming possible to evaluate detailed land cover
change trajectories for improved resource management. Relevant contemporary alternatives
such as automated extraction of geomorphologic and hydrologic properties from satellite
derived Digital Terrain Models (DEM) can thus be undertaken as viable tools for model based
simulation of relevant catchment-based properties. Already, there is a general consensus that
for such spatial models to be used for successive impact analyses and decision support, the
Land Degradation of the Mau Forest Complex: A Review for Management and Restoration
247
results should provide detailed information with a good degree of confidence, and where
possible, validated through a participatory approach involving ground measurements and
indigenous knowledge (Liu et al., 2004; Refsgaard & Henriksen, 2004; Rambaldi et al., 2007).
Generally, most of the existing studies in the MFC were carried-out at catchment-scales with a
view to determine the hydrological impacts of the environmental changes. Studies that catalog
the land cover alterations to provide time-series trajectories for continued update of the
existing water resources master plans are very few. In fact, the existing efforts are often
isolated, unpublished and difficult to access to enhance synergistic research geared towards
dependable restoration management. In this contribution therefore, the general ecology and
deforestation patterns of the MFC are reviewed with the aim of consolidating and
documenting the scattered information important for hinging the development of improved
tools for sustainable land and water resource management. Emphasis is placed on the
findings of previous works employed to monitor surface alterations as a fundamental
component of land degradation in the susceptible MFC.
2. Environmental changes and land cover degradation
Environmental changes arise from the fact that most natural and artificial earth surface
features are in a state of flux. The rate of these changes is quite often not uniformly
distributed, but depends rather on the interactions of the biophysical and human
components (Coppin et al., 2004; Jensen, 2005). The need for resource sustainability through
proper management has today prompted timely and accurate monitoring of environmental
changes to understand their relationships and interactions within a given ecosystem.
However, monitoring environmental changes requires a deep understanding of the relevant
environmental attributes over time and space to avoid simplistic representations. Common
examples of environmental changes largely witnessed today in the developing countries
include changes in forest characteristics due to human induced deforestation processes,
ecological changes due to the need for agricultural expansion and land use/land cover
changes due to factors related to human influences from increased population (Pellikka et
al., 2004; Corey et al., 2007). In the last couple of years, significant attention has been given
to land use and land cover changes, since they form a major component of global changes
with greater impact than that of climate change (Foody, 2001; Olang et al., 2011). Such
changes in land cover can be generally differentiated into land cover modification and land
cover conversion. Land cover modification generally refers to the full substitution of one
cover type by another, as is the case with urbanization.
In a majority of developing countries, land cover conversion which refers to gradual
changes affecting the nature of the land cover but not their overall classifications are
common. Such conversions may arise from the natural resilience of an ecosystem due to
climatic variability and/or from complex land cover changes due to direct or indirect
anthropogenic factors. Specifically in the MFC, both land cover modifications and
conversions are predominant, and are largely attributed to the increasing human population
pressure demanding more land for settlement, pasture and agriculture. This is further
aggravated by the dire need for economic sustainance from the within vicinity natural
resources without taking into account proper land use management practices. Forest
degradation through charcoal burning followed by conversion of the deforested areas into
subsistence agriculture is widespread in the headwaters catchments. In addition to this are
the uncontrolled cattle grazing, slash and burn farming methods in the midland areas. With
Environmental Monitoring
248
continued diminishing economic alternatives for the rural population, more farms are being
put under small scale subsistence agriculture to provide a means of a living for the riparian
communities living in the forest complex.
3. The Mau forest complex
3.1 Physiography and geology
The major geomorphological features of the forest complex comprise of the escarpments,
hills, rolling land and plains (Figure 2). The topography is predominantly rolling land with
slopes ranging from 2% in the plains to more than 30% in the foothills. Geological studies
have shown that the area is mainly composed of quaternary and tertiary volcanic deposits
(Sombroek et al., 1980). The quaternary deposits include pyroclastics and sediments, and
largely cover the Northern part of the complex. Tertiary deposits predominate in the
southern parts, and include black ashes and welded tuffs. From field-measurements, the top
soils in the plains are of clay loam (CL) to loam (L) in texture, with friable consistence and
weak to moderate sub-angular blocky structure. The subsoil texture ranges from silty clay
loam (SCL) to clay loam (CL) and clay (C), with pH values ranging from 5.6 to 6.4, making
them slightly to moderately acidic in nature (China, 1993). In the upland areas however, the
soils are largely of high content of silt and clay consequent of Ferrasols, Nitisols, Cambisols
and Acricsols according to the Food and Agricultural Organisation of the United Nations
(FAO-UN) soil classification procedure (World Soil Information [ISRIC]/FAO-UN, 1995). In
the lowland, Luvisol, Vertisol, Planosol, Cambisol and Solonetz soils from the Holocene
sedimentary deposits are primarily prevalent and occur in saline and sodic phases.
Fig. 2. Physical features, including the drainage network of the Mau Forest Complex
(World Resources Institute, 2007).
Similar trends in the soil and geological characteristics of the area were also achieved with
processed soils data obtained from the Global Environment Facility Soil Organic Carbon
The Mau Complex
Land Degradation of the Mau Forest Complex: A Review for Management and Restoration
249
(GEFSOC) project (FAO-UNESCO, 1998; Batjes & Gicheru, 2004). This dataset is available at a
scale of 1:1M for Kenya, and is a modification of the original SOTER soils data of the
International Society of Soil Science (ISSS). Other hydrological studies of the headwaters of the
MFC have employed remotely sensed datasets to derive the geomorphological characteristics
of the region (Kundu, 2007; Baldyga et al., 2007). A 3-Arc second grid based digital elevation
model (DEM) acquired from the Shuttle Radar Topographic Mission was used in this context.
Through computer aided procedures in a GIS, a raster analysis was performed to generate
stream directions and networks, which matched very closely with the actual drainage patterns.
3.2 Climate
3.2.1 Rainfall
The climate of the Mau complex is largely influenced by the North – South movement of the
Inter-tropical Convergence Zone (ITCZ) modified by local orographic effects. In terms of
seasonality, the complex can be classified as trimodal, with the long rainy season
predominant between the months of May and June and the short rainy season prevalent
between the months of September and November. Generally, the complex receives an
average annual rainfall of about 1300 mm on normal years devoid of climatic extremes such
as the El Niño Southern Oscillation (ENSO). Mean monthly rainfall events in the range of 30
mm to over 120 mm are common (Figure 3).
0
20
40
60
80
100
120
140
160
180
200
JAN FEB MAR APR MAY JUN JUL AUG SEPT OCT NOV DEC
TIME (MONTHS)
RAINFALL (MM)
NESSUEIT
OGILGEI
TECHNOLOGY FA RM
PL A NT B REEDING STA TION
TERET
EG ERTO N
Fig. 3. Monthly rainfall distribution from six selected weather stations within the Mau
Complex (Kundu, 2007).
There are a few pluviometric stations in the complex where quality rainfall data can be
obtained from. However, due to the diverse topography of the area, the existing gauge
Environmental Monitoring
250
density can be considered not sufficient for distributed representation of rainfall induced
process. This coupled with uncertanities related to measurement errors and missing data,
recent developments by the Kenya Meteorological Department have considered the use of
satellite based rainfall estimates (RFE) such as the Tropical Rainfall Measuring Mission
(TRMM) for concerned impact studies especially in large areas. In small areas however, RFE
require regionalisation through calibration with observed point data to derive region-based
adjustment coefficients (Borga, 2000; Krajewski et al., 2002).
3.2.2 Temperature and evapo-transpiration
The Mau Forest Complex generally falls in agro-climatic zones I, II and III when classified
according to moisture-indices obtained from average evapo-transpiration rates and annual
rainfall amounts. Because of its varied topography, estimation of the actual mean air
temperatures for the whole area is often quite complicated. However, based on altitude
zones, the monthly air temperature estimates for the basin are as provided in Table 1.
Altitude Zone
(m)
Mean monthly air temperatures (°C)
Abs. minimum
temp. (°C)
Maximum Minimum Mean
1 100 – 1 300 27 – 30 15 – 17 21 – 23 10 – 13
1 300 – 1 500 27 – 29 13 – 15 20 – 22 9 – 11
1 500 – 2 000 22 – 28 10 – 13 17 – 20 6 – 9
Table 1. Mean Annual air temperature ranges for different altitude zones
For estimation of localised evapo-transpiration rates, a majority of studies have employed
empirical models that incorporate both physical and aerodynamic parameters. The most
predominant due to its ability to closely approximate the crop reference evapo-transpiration
(ET
o
) rates is the FAO Penman-Monteith method (FAO, 1998, 2009). In many cases, the
average evapotranspiration of the complex are estimated in relation to the existing land use
types. In the entire complex, annual average estimates between 1.3mm/day to 4.2 mm/day,
with an average of about 3.85 mm/day, have been recorded. The ETo has also been noted to
increase with mean annual rainfall amounts, confirming that the complex is water stressed.
The results are also consistent with the reduced infiltration rates owing to the loss of much
of the vegetative cover in the area (Owido et al., 2003).
3.3 Hydrology
3.3.1 Drainage and stream network
The Mau Complex is drained mainly by 12 rivers including Rivers Njoro, Molo, Nderit,
Makalia, Naishi, Kerio, Mara, Ewaso Nyiro, Sondu, Nyando, Yala and Nzoia. Space and
time variations of the stream flows are normally influenced by the morphometry, lithology,
land use/cover and rainfall patterns. Normally, the stream flow characteristics are potential
indicators of the hydrological status of a region (Calder, 1998). In the last three decades,
physical evidence has revealed that the rivers in the MFC have had significant decline in
discharges, coupled by dwindling water quality. Other studies have also highlighted the
changing hydrological response of the area consequent of the land use/land cover changes
(Kundu et al., 2000; Owido et al., 2003). However, the effects associated with climate change
cannot be fully ignored in this context as well.
So far, a majority of studies carried out in the MFC have focused more at catchment scales. It
will be thus imperative to develop procedures that can be used to asses the hydrological
Land Degradation of the Mau Forest Complex: A Review for Management and Restoration
251
water quality and quantity in the entire forest complex. Considering the weak
infrastructural capacities, and hence the poor data quality, the application of remotely
sensed datasets provides a great potential in monitoring and management of the area.
Conventional Radio Detecting and Ranging (RADAR) based techniques for rainfall and
moisture content estimation can be explored in this respect. A reliable and integrated
database built in a GIS, can also be used to address various issues related to data
management, especially for dependable land and water resource planning. Today, global
datasets about surface elevation and land cover characteristics can be freely acquired to
enhance simulation studies. Typical synthetic drainage network can equally be derived from
Digital Elevation Models (DEM) of the area. Figure 4 illustrates the integration of RS and
GIS that could be used for managing the MFC by using freely acquired images. The results
generally compared well to the reality despite the medium resolution of the images. With
further processing, supported by secondary datasets from high resolution satellite images, it
is possible to improve the quality of the derived stream-networks.
Fig. 4. Drainage network within the Mau Forest Complex.
3.3.2 Velocity and discharge
Normally, to elucidate the mechanisms driving discharge variability, a study period of not
less than 30 years is usually recommended. This period is considered long enough to discern
effects consequent of either land use changes or climate change and variability. Land use
change effects are commonly investigated by understanding the discharge regimes during
rainy seasons especially. Depending on the magnitude of the spatial changes however,
Environmental Monitoring
252
utmost care must be taken since studies in Kenya have also shown that the effects of land
cover change on runoff events tend to diminish with increased magnitude of storm events
(Olang & Fürst, 2011). Chemelil (1995) and Kundu et al. (2008) assessed the mean rainfall
and discharge characteristics of the Njoro River located in Eastern Mau to understand the
influence of environmental changes in the area. The authors used a similar procedure
provided by Marcos et al. (2003). The results obtained are illustrated in Figure 5.
0
10
20
30
40
50
60
1944 1954 1964 1974 1984 1994
Time (years)
Discharge (m3/s)
0
500
1000
1500
2000
2500
Rainfall (mm)
Discharge (m3/s) Rainfall (mm)
Fig. 5. Long-term annual rainfall and discharge relationship between 1944 and 2001.
From the figure, discharges in the area showed a decreasing trend against a rather consistent
rainfall pattern. The frequency of low flow was noted to have increased, especially in the
interval between 1980 and 2000. This trend was largely attributed to the changing land use
patterns, considering that this period witnessed the highest human encroachment within the
MFC. It was hence more likely that the unplanned conversion of forest and woodlands into
agriculture and built up area within the headwaters could have influenced the discharge
generation processes and hydrological regimes of the area. Other reasons associated with
this were increased water abstraction for irrigation and domestic purposes consequent of the
rising population.
3.4 Land cover and land use
The Mau complex has the largest indigenous montane forest covering an area of about 2700
km
2
at present. Vegetation in the area varies largely from grasslands with scattered trees in
the plains, to shrubland and forests in the hilly uplands. In the higher mountain ranges,
bamboo forests are largely predominant. The vegetation around the rivers and lakes mainly
comprises of acacia trees and dense bush and shrubs. The escarpments are mainly wooded
and bushy with a wide ecological diversity. The higher areas comprise of forests with acacia
xanthophloea, Olea hochstetteri, Croton dichogamus, euphorbia candelabrum forest and bush land.
Previously, the area was largely covered by rich evergreen forests, extending from the
Land Degradation of the Mau Forest Complex: A Review for Management and Restoration
253
highlands of Mau hills, and woodland dominated by acacia trees in the plains. A Landsat
image (P169R60) in bands 4-3-2 for February 2000 showing the predominant vegetation and
land cover of the Mau complex are provided in Figure 6. The continuous deep red
represents highland vegetation on the escarpments and hill ranges. The green-blue patches
largely represent open pasture and grassland, bare soil, roads, built-up areas and farms after
harvesting.
Fig. 6. Landsat image for February 2000 showing Land cover and Rift Valley lakes.
Within the blocks of the MFC, the eastern Mau has witnessed most of the land use changes
consequent of the up-surging human population and their associated activities. The former
large scale farms have been subdivided and allocated to small scale farmers. For instance,
the former Sebiens (Ngondu) and Wright (Njokerio) large scale farms, which produced
flowers, wheat and dairy products on commercial basis, have been converted into small
arable and grazing plots through the land fragmentation process. In Baruti area near Lake
Nakuru, a lunar landscape with the potential for landslide disasters during storm events has
been created by the haphazard and unplanned sand mining and quarrying activities carried
out in the area (Figures 7 (a) and (b)).
Environmental Monitoring
254
(a) (b)
Fig. 7. (a): Cleared forested presently used for grazing in Nessueit area (Photo taken in
2005 by Kundu) (b): Sand Harvesting at Baruti area near Lake Nakuru (Photo taken in
2009 by Kundu).
In eastern Mau, more than one-half of the cropland is set aside for subsistence farming.
Measures such as contour ploughing and conservation tillage that proved effective in soil
and water management have been receiving less and less attention. Consequently, a
majority of the land has become susceptible to soil erosion processes with the continued
degradation. Coupled with this is deteriorating water quality epitomized by the rising level
of dissolved nutrients (NO
3
and PO
4
), and eutrophication based processes, especially within
Lake Nakuru (Karanja et al., 1986; WWF, 1991; Chemelil, 1995; Shivoga, 2001; Owino et al.,
2005).
4. Land cover conversion patterns
Previous studies at the Regional Centre for Mapping of Resources for Development
(RCMRD) involving time series analysis of satellite based remote sensing data have
revealed significant land cover changes in the MFC (www.rcmrd.org) as shown in Figures
8 and 9. Before 1986, the dominant pre-change land cover types were about 75% of forests,
12% of woodlands and 13% of farms. By 1989, the landscape had changed tremendously
giving rise to about 60 % of forest and woodland, and 40 % of agriculture and built-up
area. Figure 8 illustrates deforestation patterns between 1986 and 2000. It should be noted
that the change statistics were obtained from classification of medium resolution spatial
datasets. Depending on the degree of spatial aggregation used during processing
therefore, it is likely that the dominant land cover types could have been overestimated at
the expense of non-dominant types. However, a ground survey carried out in retrospect
revealed that the classification trends generally compared well with the reality on the
ground. The dominant land cover types during the period were largely agriculture and
built-up area as per the classifications. The indigenous knowledge furthermore divulged
that the loss of forests were largely through clear-cut and progressive thinning by the
local residents.
Land Degradation of the Mau Forest Complex: A Review for Management and Restoration
255
Approx. area of
Forest cover: 435,072 Ha.
1986 2000
Approx. area of
Forest cover: 352,604 Ha.
Approx. area of
Forest cover: 435,072 Ha.
1986 2000
Approx. area of
Forest cover: 352,604 Ha.
Fig. 8. Deforestation patterns in the Mau complex between 1986 and 2000.
Fig. 9. Deforestation patterns of the MFC located south of Londiani (E. Khamala: 2009)
Environmental Monitoring
256
Further analysis using Landsat satellite images for the period between 1973 and 2009 have
revealed that the section of the forest falling south of Kipkelion and Londiani (Figure 9)
stood at about 254,100 hectares in 1973, 249,400 hectares in 1986, 226,100 hectares in 2000
and 179,000 hectares in 2009 (). Relative to 1973, these
figures represent percentage deforestation rates of about 2% between 1973and 1986, 11%
between 1973 and 2000, and 30% between 1973 and 2009. From the statistics, it could also be
deduced that deforestation rates were highest between 2000 and 2009, when about 47,100
hectares of forest were lost. These results generally conform to ground reality since this
period witnessed the highest excisions of the forest owing to the human encroachments and
settlements followed by irregular and ill planned forest resource exploitation.
5. The environmental impact of land use/cover change
The conversion of forest into agriculture and built-up land in the MFC has led to
noteworthy environmental impacts. Generally, increased impervious and hardened surface
areas such as roads, parking lots, sidewalks and rooftops diminishes infiltration based
processes and, consequently, recharge to the groundwater systems. These processes not only
impair the ability of the system to cleanse runoff and protect wetlands, but also amplify the
potential for soil erosion and floods, thereby contributing to the degradation of streams and
other water bodies. The replacement of forest and woodland by depletive subsistence
agriculture has also caused massive inflow of sediments into the nearby Lakes (Ramesh,
1998). The rising nutrient levels from the sediment have affected the growth of blue-green
algae (spirulina platensis), which forms the main food for flamingo birds, known to be a
major touristic attraction for Lake Nakuru. Apart from reduced revenues associated with
ecotourism in the area, the ecological effect of this has been the loss of biodiversity through
migration of the birds to other water bodies within the rift valley where complimentary
food is available. Conversion from forest to agriculture and grazing land has also disrupted
the hydrological cycle of the river drainage basins through increased evaporation and runoff
process, especially during rainy seasons.
Generally, low-productivity grass types from natural grassland pastures have lesser leaf
area and produce a smaller amount of biomass compared to the forested vegetation. With
reduced leaf area and biomass consequent of the land degradation, rainfall interception and
surface detention capacity are bound to significantly decrease. This reduces the soil
moisture retention capacities, further contributing to the decline in the general
evapotranspiration rates (ET
o
) of the area. Changes in land use may also affect the
groundwater recharge of a system. This however, depends on the groundwater recharge
area, which may be different from the surface water catchments. However, studies have also
shown that logging or conversion of forest to grassland for grazing can result into rising
water table as a result of decreased evapotranspiration. In some cases, the water table may
fall as a result of decreased soil infiltration from soil compaction and non-conservation
farming techniques. If the infiltration capacity is substantially reduced, the long term effect
can be severe cases of drought and desertification (Maidment, 1993; Chemelil, 1995).
Removal of forest from a catchment can also cause significant hydrologic consequences such
as decreased rainfall interception leading to variations in the stream water quality and
quantity (Mutua and Klik, 2007; Olang et al., 2011). Research has shown that tree canopies
can intercept 10-40% of incoming precipitation depending on the age, location and density
of stand, tree species, rainfall intensity and evaporation rates. Land degradation due to
Land Degradation of the Mau Forest Complex: A Review for Management and Restoration
257
forest logging, forest fires and wind damage can therefore have major and long lasting
effects upon the canopy characteristics and consequently, overall hydrological response of
an area. Clearing of forests can also cause habitat fragmentation, loss of biodiversity and
water related pollution problems.
From a macro-scale perspective however, deforestation as a problem to society is still
complex in nature. However, there is no question as to whether deforestation affects the
climate system dynamics, atmospheric composition and other ecosystem processes. In the
tropical regions, observational studies on the effects of land cover conversions on the
climate and hydrology of very large basins greater than 100,000 km
2
are still scarce. The few
large-scale catchment-based studies available have found no consistent relation between
land cover degradation and climate changes. The studies further suggests that if appropriate
land cover, precipitation, and discharge data were available in time and space, then perhaps
it would be possible to determine whether the impact of land cover change across very large
catchments is similar to that observed in smaller catchments. Figure 10 illustrates the impact
of land cover changes of the Mau on the ecology of river Njoro (a) and Lake Nakuru (b).
(a) (b)
Fig. 10 (a): Drying river bed at Baruti area (b): Retreating water levels in Lake Nakuru
(photos taken by Kundu in 2009).
6. Environmental conservation strategies
More recently, the Mau Forest Complex has received considerable attention from local and
international organizations due to its ecological significance, which is posing a threat to the
whole region. In Kenya, most forest areas are now under the management of the Kenya
Forest Service (KFS), which has made substantial steps towards addressing the degradation
and deforestation threat to all the major water towers. Among the steps is the new forest
policy and law, which were promulgated in 2005. The new law lays emphasis on a
participative approach to management of forest resources by all stake holders including
local communities and the private sector. A further step is the creation of the Task Force for
the Mau Forest Complex (TF-MFC) under the office of the Prime Minister of Kenya, with the
mandate to recommend strategies for restoring the forest complex in line with Vision 2030.
A very important and urgent scheme is the reforestation and restoration through tree
planting as shown in Figure 11. Such activities are organized by the concerned
Environmental Monitoring
258
governmental chief officers, in collaboration with environmental non-governmental
organizations and international organizations.
(a) (b)
Fig. 11. (a): Restoration of the Enderit Block of the Eastern Mau Forest Reserve
(b): Tree planting to restore the forest covers (Photo taken by Kundu in 2010).
A number of international and sub-regional organizations are involved in the conservation
and rehabilitation planning. The major international programme is under the
UNEP/DEWA, which is also involved in the assessment of the threats to critical montane
forests in East Africa including Mt. Kenya, Aberdare range and Mt. Kilimanjaro. Other
organizations which have shown interest, directly or indirectly, include the Africa
Convention for the Conservation of Nature and Natural Resources (2003), East Africa
Community Treaty (1999), Convention on Wetlands of International Importance Especially
as Waterfowl Habitat (Ramsar Convention, 1971), Convention on Biological Diversity (1992),
International Tropical Timber Agreement (1983, revised 1994) United Nations Forum on
Forests, Intergovernmental Authority on Development (IGAD), Johannesburg Plan of
Implementation of the World Summit on Sustainable Development (WSSD), Lake Victoria
Protocol (2003), Protocol for Environment and Natural Resources, The United Nations
Framework Convention on Climate Change (1992), the World Heritage Convention (1972),
the United Nations Convention to Combat Desertification (UNCCD) (1994); the Convention
on International Trade in Endangered Species (CITES, 1973), The United Nations
Convention to Combat Desertification (UNCCD) (1994), The Nile Basin Initiative (NBI)
amongst others. So far under the TF-MFC mandated with co-coordinating the rehabilitation
planning of the Mau ecosystem, a number of strategic options have been proposed and
realized, in part. The major key interventions were categorized into three phases. Phase 1
involves short term options achievable within the first three years. Phases 2 and 3 involve
medium and long term interventions aimed at consolidating the management efforts for
sustainability reasons. Among the key interventions, the first and second phases include:
Development of effective institutional framework and strategic Management Plan
Under this framework, a Mau Forests Complex Authority (MFCA) was to be established to
coordinate and oversee the management of the complex. The authority was to be guided by
board of directors comprising representatives of the main stakeholders, including the
economic sectors directly dependent on the goods and services of the Mau Forests Complex
such as water, energy, tourism and wildlife, agriculture and forestry. Ecological
Land Degradation of the Mau Forest Complex: A Review for Management and Restoration
259
requirements, in conformity with the needs of existing strategic plans, including for Vision
2030 were to be integrated in the development plan. The current status of the Mau
ecosystem, including the existing data status for management purposes were to be
considered in achieving this. Additionally is the need for assessment studies on the critical
catchment areas and biodiversity hotspots, which require immediate and appropriate
conservation strategies.
Boundary surveys, issuance of title deeds and monitoring and enforcement
This was to involve the demarcation of the legal boundaries and assessment of the critical
water catchment areas, assessment of vegetation cover status and biological diversity
hotspots in the MFC. Furthermore was the need for routine monitoring to prevent new
encroachment, charcoal burning and tree felling that could further attenuate degradation
process. Demarcation and fencing of hydrological and biological hotspots or where
significant human-wildlife conflicts could occur was hence imperative in this context.
Relocation, resettlement and livelihood support and development
This activity involved the relocation of all people living in the demarcated protected forests.
In the event of resettlement thus, the government was to provide alternative land and funds
for the development of the new lands, and livelihoods, while taking into consideration
vulnerability of the people within the locations. Immediate livelihood support including
water, food, shelter and energy were hence required for the families relocated from the
complex to lessen the resentment felt by those aggrieved by their relocation.
Public awareness and community sensitization
The activity was mainly to address the needs of the local communities living around the
forest. The restoration process was to be done in consultation with local communities, who
were to benefit both through directly employment opportunities and/or indirectly through
ecosystem services including water provision through a restored ecosystem. Sustainable
livelihood options in the forest, with particular emphasis on employment opportunities and
natural resource based income generating activities were to be explored. This was to
include, but not limited to, raising most of the required seedlings for rehabilitation, with the
balance being produced through institutional nurseries through technical support by private
and international organizations.
7. Conclusions
The negative environmental impacts on the MFC, have reached crisis level. Presently, the
riparian communities and the Kenya government through key economic sectors that directly
depend on goods and services of the region are paying the price of over three decades of
negligence and improper land use management. The ongoing restoration efforts, including
educating the general public about the need for sustainable environmental conservation in
such areas is highly essential and should be sustained. It is imperative that the restoration
and rehabilitation efforts are fortified through integration with potential socio-economic
activities that can support the survival of the riparian rural communities. Exploring the role
of eco-tourism, in relation to natural forested ecosystem, followed by putting in place
appropriate and sustainable management framework are hence important in this respect. In
order to further support the rural communities it is crucial to initiate long-term agro-forestry
based practices such as production of sustainable wood products, and non-timber products
such as medicinal plants and honey for commercialization purposes.
Environmental Monitoring
260
Also, worth mentioning as a fundamental aspect of the conservation would be the
unavoidable role of continued research in the region. Further studies that go hand in hand
with the restoration and rehabilitation process would be a key support tool that enables
necessary and appropriate adjustment as need arises. Evaluating the interactions of the
rehabilitated forest ecology in relation with the biological and hydrological systems will be
important at every stage. With the increasing advancement in RS techniques, future research
activities aimed at exploring new and innovative methods for environmental monitoring
and management are also imperative in this respect. Other studies related to carbon
sequestration to defer the effects of global warming through Reduced Emissions associated
with Deforestation and Degradation (REDD) are also necessary. Considering that land
degradation due to anthropogenic causes still remains a major threat to ecosystems and
natural resource sustainability in Kenya, successful rehabilitation of the Mau Forest
Complex will offer a good prototype that can be studied and possibly emulated across other
regions experiencing similar environmental challenges.
8. Acknowledgements
The authors would like to acknowledge the support of the relevant authorities at the World
Agro-forestry Centre, Regional Centre for Mapping of Resources for Development, Regional
Disaster Management Center of Excellence and IGAD – Climate Prediction and Application
Centre. Our Sincere gratitude also goes to the editorial team at InTech Publishers for
streamlining this work to publication standards.
9. References
Baldyga, T. J., Miller, N. S., Driesse, L. K., & Gichaba, N. C. (2007). Assessing land cover
change in Kenya’s Mau Forest region using remotely sensed data. African Journal of
Ecology, 46, 46–54, doi:10.1111/j.1365-2028.2007.00806.x
Batjes, N. H. & Gicheru, P. (2004) Soils data derived from SOTER for studies of carbon stocks
and change in Kenya (Version 1). World Soil Information (ISRIC) GEF-SOC/VROM
project report no. 2004/01 (February 2004).
Borga, M. (2002). Accuracy of radar rainfall estimates for streamflow simulation. Journal of
Hydrology, 267, 26-39.
Calder I.R. (1998). Water-resource and land use issues. SWIM Paper 3. Colombo: IIMI
Chemelil, M.C. (1995). The effect of human induced watershed changes on stream flows.
PhD Thesis, Loughborough University of Technology, UK.
China, S.S. (1993). Land Use Planning using GIS. Unpublished PhD thesis, University of
Southampton
Coppin P., Jonckheere, I., Nackaerts, K., & Muys, B. (2004). Digital change detection
methods in ecosystem monitoring: a review. International Journal of Remote Sensing,
25, 1565-1596.
Corey, J. A. B., Navjot, S. S., Kelvin, S-HP. & Barry, W. B. (2007). Global evidence that
deforestation amplifies flood risk and severity in the developing world. Global
Change Biology, 13, 2379–2395, doi:10.1111/j.1365-2486.2007.01446.x
FAO. (1998). Food and Agriculture Organization of the United Nations. Crop
evapotranspiration: Guidelines for computing crop water requirements - FAO
Irrigation and drainage paper 56, Rome, Italy.