REPORT NO. 2011-039 NOVEMBER 2010 BROWARD COLLEGE Financial Audit For the Fiscal Year Ended June 30, 2010_part1 doc
Bạn đang xem bản rút gọn của tài liệu. Xem và tải ngay bản đầy đủ của tài liệu tại đây (291.78 KB, 8 trang )
REPORT NO. 2011-039
N
OVEMBER 2010
BROWARD COLLEGE
Financial Audit
For the Fiscal Year Ended
June 30, 2010
This is trial version
www.adultpdf.com
BOARD OF TRUSTEES AND PRESIDENT
Members of the Board of Trustees and President who served during the 2009-10 fiscal year are listed below:
Sean C. Guerin, Chair from 7-28-09,
Vice Chair to 7-27-09
Sean C. Alveshire from 8-20-09, Vice Chair
from 6-22-10
Paul C. Tanner, Chair to 7-27-09
Georgette Sosa Douglass, Vice Chair
from 7-28-09 to 6-21-10
Lourdes L. Garrido to 8-20-09 (1)
Levi G. Williams, Jr., to 5-31-10 (2)
Notes: (1)
T
erm expire
d
on May 31, 2009, continue
d
to serve to August 20, 2009.
(2) Position vacant from June 1, 2010.
J. David Armstrong, Jr., President
T
he Auditor General conducts audits of governmental entities to provide the Legislature, Florida’s citizens, public entity
management, and other stakeholders unbiased, timely, and relevant information for use in promoting government
accountability and stewardship and improving government operations.
The audit team leader was Enrique A. Alonso, CPA, and the audit was supervised by Ida Marie Westbrook, CPA. Please
address inquiries regarding this report to James R. Stultz, CPA, Audit Manager, by e-mail at
or by
telephone at (850) 922-2263.
This report and other reports prepared by the Auditor General can be obtained on our Web site at
www.myflorida.com/audgen
; by telephone at (850) 487-9024; or by mail at G74 Claude Pepper Building, 111 West Madison
Street, Tallahassee, Florida 32399-1450.
This is trial version
www.adultpdf.com
NOVEMBER 2010 REPORT NO. 2011-039
BROWARD COLLEGE
TABLE OF CONTENTS
PAGE
NO.
EXECUTIVE SUMMARY i
INDEPENDENT AUDITOR’S REPORT ON FINANCIAL STATEMENTS 1
MANAGEMENT’S DISCUSSION AND ANALYSIS 3
BASIC FINANCIAL STATEMENTS
Statement of Net Assets 12
Statement of Revenues, Expenses, and Changes in Net Assets 14
Statement of Cash Flows 15
Notes to Financial Statements 17
OTHER REQUIRED SUPPLEMENTARY INFORMATION
Schedule of Funding Progress – Other Postemployment Benefits Plan 35
INDEPENDENT AUDITOR’S REPORT ON INTERNAL CONTROL OVER
FINANCIAL REPORTING AND ON COMPLIANCE AND OTHER MATTERS
BASED ON AN AUDIT OF THE FINANCIAL STATEMENTS PERFORMED
IN ACCORDANCE WITH
GOVERNMENT AUDITING STANDARDS
36
Internal Control Over Financial Reporting 36
Compliance and Other Matters 37
This is trial version
www.adultpdf.com
NOVEMBER 2010 REPORT NO. 2011-039
2
In accordance with Government Auditing Standards, we have also issued a report on our consideration of Broward
College’s internal control over financial reporting and on our tests of its compliance with certain provisions of laws,
rules, regulations, contracts, and grant agreements and other matters included under the heading INDEPENDENT
AUDITOR’S REPORT ON INTERNAL CONTROL OVER FINANCIAL REPORTING AND ON
COMPLIANCE AND OTHER MATTERS BASED ON AN AUDIT OF THE FINANCIAL
STATEMENTS PERFORMED IN ACCORDANCE WITH
GOVERNMENT AUDITING STANDARDS
.
The purpose of that report is to describe the scope of our testing of internal control over financial reporting and
compliance and results of that testing, and not to provide an opinion on the internal control over financial reporting
or on compliance. That report is an integral part of an audit performed in accordance with Government Auditing
Standards and should be considered in assessing the results of our audit.
Accounting principles generally accepted in the United States of America require that MANAGEMENT’S
DISCUSSION AND ANALYSIS on pages 3 through 11 and OTHER REQUIRED SUPPLEMENTARY
INFORMATION on page 35 be presented to supplement the basic financial statements. Such information,
although not a required part of the basic financial statements, is required by the Governmental Accounting Standards
Board who considers it to be an essential part of financial reporting for placing the basic financial statements in an
appropriate operational, economic, or historical context. We have applied certain limited procedures to the required
supplementary information in accordance with auditing standards generally accepted in the United States of America,
which consisted of inquiries of management about the methods of preparing the information and comparing the
information for consistency with management’s responses to our inquiries, the basic financial statements, and other
knowledge obtained during our audit of the basic financial statements. We do not express an opinion or provide any
assurance on the information because the limited procedures do not provide us with sufficient evidence to express an
opinion or provide any assurance.
Respectfully submitted,
David W. Martin, CPA
November 19, 2010
This is trial version
www.adultpdf.com
NOVEMBER 2010 REPORT NO. 2011-039
4
is improving or deteriorating. You will need to consider many other nonfinancial factors, such as certain trends,
student retention, condition of the buildings, and the safety of the campus, to assess the College’s overall financial
health.
These statements include all assets and liabilities using the accrual basis of accounting, which is similar to the
accounting used by most private-sector institutions. All of the current fiscal year’s revenues and expenses are taken
into account regardless of when cash is received or paid.
A condensed statement of assets, liabilities, and net assets of the College and its component unit for the respective
fiscal years ended, is shown in the following table:
Condensed Statement of Net Assets at
(In Thousands)
6-30-10 6-30-09 12-31-09 12-31-08
Assets
Current Assets 114,254$ 114,386$ 2,173$ 2,826$
Capital Assets, Net 162,783 159,414
Other Noncurrent Assets 29,736 21,334 64,706 57,613
Total Assets
306,773 295,134 66,879 60,439
Liabilities
Current Liabilities 21,198 17,921 683 891
Noncurrent Liabilities 34,804 34,795
Total Liabilities
56,002 52,716 683 891
Net Assets
Invested in Capital Assets,
Net of Related Debt 141,237 139,049
Restricted 66,041 68,375 60,015 54,941
Unrestricted 43,493 34,994 6,181 4,607
Total Net Assets
250,771$ 242,418$ 66,196$ 59,548$
Increase in Net Assets
8,353$ 3.4% 6,648$ 11.2%
College Component Unit
Overall net assets of the College increased by $8.4 million, or 3.4 percent. Changes in the College’s net assets were
the result of the following factors:
Unrestricted net assets increased by $8.5 million, or 24.3 percent, as the College continued to perform well in
its primary operations.
College tuition and fees increased $14.1 million due to increased student enrollment of approximately
12 percent and scholarship allowances increased by $13.9 million, resulting in a net tuition and fee increase of
$0.2 million.
The College received $5.8 million in American Recovery and Reinvestment Act stimulus funds.
College Program Funds decreased $5.7 million due to reduced State appropriations.
Corrections for prior year errors in recording estimated insurance claims payable and related expenses
decreased total net assets by $2.2 million.
This is trial version
www.adultpdf.com
NOVEMBER 2010 REPORT NO. 2011-039
5
Revenues and expenses of the College and its component unit for the respective fiscal years ended are shown in the
following table:
Condensed Statement of Revenues, Expenses, and Changes in Net Assets
For the Fiscal Years Ended
(In Thousands)
6-30-10 6-30-09 12-31-09 12-31-08
Operating Revenues
Student Tuition and Fees, Net of Scholarship
Allowances 40,446$ 40,250$ $ $
Federal Grants and Contracts 7,787 7,318
State and Local Grants and Contracts 2,068 2,649
Nongovernmental Grants and Contracts 8,301 9,029
Sales and Services of Educational Departments 53 49
Auxiliary Enterprises, Net of Scholarship
Allowances 15,519 13,995
Other Operating Revenues 1,485 1,470 2,549 7,354
Total Operating Revenues
75,659 74,760 2,549 7,354
Less, Operating Expenses 231,715 204,421 7,196 8,057
Operating Loss
(156,056) (129,661) (4,647) (703)
Nonoperating Revenues (Expenses)
State Appropriations 67,524 73,968 882
Interest on Capital Asset-Related Debt (1,108) (1,063)
Other Nonoperating Revenues (Expenses) 85,565 48,475 11,295 (16,341)
Net Nono
p
eratin
g
Revenues
(
Ex
p
enses
)
151,981 121,380 11,295 (15,459)
Income (Loss) Before Other Revenues,
Expenses, Gains, or Losses
(4,075) (8,281) 6,648 (16,162)
Capital Appropriations 9,059 18,185
Capital Grants, Contracts, Gifts, and Fees 5,540 5,464
Additions to Permanent Endowments 3 12
Increase (Decrease) in Net Assets
10,527 15,380 6,648 (16,162)
Net Assets, Beginning of Year 242,418 227,038 59,548 75,710
Adjustment to Beginning Net Assets (1) (2,174)
Net Assets, Beginning of Year, as Restated
240,244 227,038 59,548 75,710
Net Assets, End of Year
250,771$ 242,418$ 66,196$ 59,548$
Note: (1)
College Component Unit
To decrease beginning net asset balance for prior years understatement of Estimated Insurance
Claims Payable and related expenses.
Operating Revenues
GASB Statement No. 35 categorizes revenues as either operating or nonoperating. Operating revenues generally
result from exchange transactions where each of the parties to the transaction either gives or receives something of
equal or similar value.
This is trial version
www.adultpdf.com
NOVEMBER 2010 REPORT NO. 2011-039
6
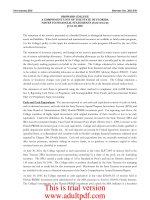
The following chart presents the College’s operating revenues for the 2009-10 and 2008-09 fiscal years:
Operating Revenues: College
(In Thousands)
College operating revenue increased by $0.9 million, or 1.2 percent. College operating revenues were fairly consistent
between the two years.
Operating Expenses
Expenses are categorized as operating or nonoperating. The majority of the College’s expenses are operating
expenses as defined by GASB Statement No. 35. GASB gives financial reporting entities the choice of reporting
operating expenses in the functional or natural classifications. The College has chosen to report the expenses in their
natural classification on the statement of revenues, expenses, and changes in net assets and has displayed the
functional classification in the notes to financial statements.
Operating expenses for the College and its component unit for the respective fiscal years ended are presented in the
following table:
Operating Expenses
(In Thousands)
6-30-10 6-30-09 12-31-09 12-31-08
Operating Expenses
Personnel Services 127,646$ 119,398$ $ $
Scholarships and Waivers 38,294 24,545
Utilities and Communications 4,372 4,955
Contractual Services 11,189 10,798
Other Services and Expenses 8,564 8,022 7,196 8,057
Materials and Supplies 33,108 28,733
Depreciation 8,542 7,970
Total Operating Expenses
231,715$ 204,421$ 7,196$ 8,057$
College Component Unit
$1,485
$15,519
$53
$8,301
$2,068
$7,787
$40,446
$1,470
$13,995
$49
$9,029
$2,649
$7,318
$40,250
$0 $25,000 $50,000
Other
Auxiliary Enterprises, Net
Sales and Services of Educational Departments
Nongovernmental Grants and Contracts
State and Local Grants and Contracts
Federal Grants and Contracts
Student Tuition and Fees, Net
2008-09
2009-10
This is trial version
www.adultpdf.com
NOVEMBER 2010 REPORT NO. 2011-039
7
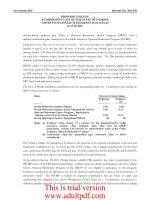
The following chart presents the College’s operating expenses for the 2009-10 and 2008-09 fiscal years:
Operating Expenses: College
(In Thousands)
College operating expenses increase by $27.3 million, or 13.4 percent, over the prior fiscal year to service the
enrollment growth of the College. The College’s operating expense changes are highlighted below:
Scholarships and waivers expenses increased by $13.7 million, or 56 percent. This was due to increased
enrollment and increased financial aid award amounts.
Personnel services expenses increased by $8.2 million, or 6.9 percent, over the prior fiscal year. This was due
to Board approved salary increase and the hiring of additional personnel.
Materials and supplies expenses increased by $4.4 million, or 15.2 percent. This was due to an increase in
bookstore purchases for resale to meet the demands of increased enrollment as well as an increase in repairs
and renovations expenses.
Nonoperating Revenues and Expenses
Certain revenue sources that the College relies on to provide funding for operations, including State appropriations,
certain gifts and grants, and investment income, are defined by GASB as nonoperating. Nonoperating expenses
include capital financing costs and other costs related to capital assets. The following summarizes the College’s
nonoperating revenues and expenses for the 2009-10 and 2008-09 fiscal years:
$8,542
$33,108
$8,564
$11,189
$4,372
$38,294
$127,646
$7,970
$28,733
$8,022
$10,798
$4,955
$24,545
$119,398
$0 $75,000 $150,000
Depreciation
Materials and Supplies
Other Services and Expenses
Contractual Services
Utilities and Communications
Scholarships and Waivers
Personnel Services
2008-09
2009-10
This is trial version
www.adultpdf.com