báo cáo hóa học:" SPECT/CT-plethysmography – non-invasive quantitation of bone and soft tissue blood flow" ppt
Bạn đang xem bản rút gọn của tài liệu. Xem và tải ngay bản đầy đủ của tài liệu tại đây (359.43 KB, 8 trang )
BioMed Central
Page 1 of 8
(page number not for citation purposes)
Journal of Orthopaedic Surgery and
Research
Open Access
Research article
SPECT/CT-plethysmography – non-invasive quantitation of bone
and soft tissue blood flow
Lior Dayan
1
, Zohar Keidar
2
, Ora Israel
2
, Victor Milloul
3
, Johnathan Sachs
2
and Giris Jacob*
4
Address:
1
Ortopedic B and Recanati Autonomic Dysfunction Center, Rambam Health Care Campus, Haifa, Israel,
2
Nuclear Medicine department,
Rambam Health Care Campus & The Technion Faculty of Medicine, Haifa, Israel,
3
Rambam Health Care Campus & The Technion Faculty of
Medicine – IIT, Haifa, Israel and
4
Director, J. Recanati Autonomic Dysfunction Center, Medicine A, Rambam Health Care Campus & The Technion
Faculty of Medicine – IIT, Haifa, Israel
Email: Lior Dayan - ; Zohar Keidar - ;
Ora Israel - ; Victor Milloul - ; Johnathan Sachs - ;
Giris Jacob* -
* Corresponding author
Abstract
Preserved blood flow to bone and soft tissue is essential for their normal function. To date only
numerous methods are suitable for direct bone blood flow (BBF) measurement. Here, we
introduce a novel quantitative method for bone and soft tissue blood flow (BBF and SBF,
respectively) measurement. It involves a combination of SPECT/CT imaging for blood pool
localization in a specific region of interest ("soft" and "hard" tissues composing a limb) with veno-
occlusive plethysmography. Using it, we measured BBF and SBF in the four limbs of 10 healthy
subjects. At steady state blood flow measurements in the four limbs were similar, ranging between
5.5 – 6.5 and 1.87–2.48 ml per 100 ml of tissue per minute for BBF and SBF, respectively. Our
results are comparable to those in the literature. We concluded that SPECT/CT-plethysmography
appears to be a readily available and easy to use method to measure BBF and SBF, and can be added
to the armamentarium of methods for BBF measurements.
Introduction
As with all organs, bone blood flow (BBF) is vital to ongo-
ing skeletal function and growth. BBF preserved at a suffi-
cient degree is a crucial component of normal bone
turnover and contributes significantly to the basic meta-
bolic processes preserving bone integrity, as well as to
repair mechanisms in pathological conditions such as
fractures, infections and osteoporosis [1].
Since blood flow to every organ is a dynamic process reg-
ulated by internal and external systems, its investigation
requires methods that are accurate and reproducible. One
method is the positron emission tomography (PET),
which is a powerful and widely accepted tool in skeletal
muscle perfusion study in humans [2,3]. It has also been
utilized for BBF measurement in human [4,5,3], yet this
method requires the availability of radioactive substances
with extremely short half-life time (e.g.
15
O nuclide),
which are not readily available in many medical centers,
thus rendering it unavailable for routine BBF measure-
ments. Other acceptable methods for BBF assessment are
either invasive or involve noninvasive imaging techniques
with visual non-quantitative assessment of the transit of
various radiotracers through certain anatomical region [6-
Published: 18 August 2008
Journal of Orthopaedic Surgery and Research 2008, 3:36 doi:10.1186/1749-799X-3-36
Received: 24 January 2008
Accepted: 18 August 2008
This article is available from: />© 2008 Dayan et al; licensee BioMed Central Ltd.
This is an Open Access article distributed under the terms of the Creative Commons Attribution License ( />),
which permits unrestricted use, distribution, and reproduction in any medium, provided the original work is properly cited.
Journal of Orthopaedic Surgery and Research 2008, 3:36 />Page 2 of 8
(page number not for citation purposes)
9]. Laser Doppler technique, one of the most currently
acknowledged and accepted techniques for use in BBF
measurement in humans, is invasive and provides only a
qualitative assessment of BBF. Additional methods of BBF
measurement, although accurate and validated in many
researches, were developed mainly for animal research
(e.g., labeled microspheres, thermocouples and dilution
methods) and are not applicable for use in humans [10-
15,7,16,17].
Given the paucity of a suitable quantitative methods for
BBF measurement in humans, we were encouraged to
develop one that would be relatively safe and available.
Using dual modality SPECT/CT imaging devices, it is pos-
sible to accurately localize as well as quantify blood pool
in regions of interest, i.e within limb compartments. The
current study presents a novel method that is based on the
combination of two well known clinical tools, strain
gauge plethysmography and dual modality SPECT/CT
functional and anatomic imaging. The first component of
this method enables blood flow measurement in an entire
limb. The second enables the highly accurate localization
of radiotracer activity to a specific region of interest [18],
in our case blood pool in limb different limb's compart-
ments.
Methods
Subjects
A group of 10 (4 females and 6 males) healthy subjects
aged between 20 and 45, without any history of previous
limb fractures, soft tissue damage or major trauma, dis-
eases affecting the vascular system and with no history of
any routine medication intake were recruited for the
research. No smoking or alcoholic and monoamine con-
taining beverages were allowed 24 hours prior the study.
All subjects signed informed and written consent forms
approved by the local institutional ethics committee.
Experimental design
Plethysmography studies were performed in a quiet, dark-
ened room with ambient temperature of ~24°C and fol-
lowing an overnight fast. Thereafter, SPECT/CT studies
were acquired. Both studies were performed in a supine
position after a 10 minutes supine rest.
Plethysmography studies
Limb blood flow (F
L
) was measured using the well
acknowledged venous occlusion plethysmography tech-
nique[19]. Briefly, a sphygmomanometer cuff was
applied at a predetermined point in the limb under inves-
tigation (i.e. 10 cm distal to the tibial tubercle in the leg
and 10 cm distal to the olecranon tip in the forearm) and
was inflated to 45 mm Hg for 7 seconds to prevent venous
egress. During this period, forearm volume changes per
time unit (correlates with blood flow changes) were meas-
ured by a strain gauge plethysmography (ECR5, Hokan-
son, Inc, Bellevue WA, USA). A 7-second deflation period
was allowed before the subsequent measurement. The
flow to the hand and foot was excluded by inflating a cuff
above the systolic BP in the wrist or ankle, respectively.
Baseline blood flow was the average of at least 4 stable
repeated flow measurements. In order to test the repro-
ducibility of the introduced method, all four limbs were
measured in the same session. Each limb was taken as
control for its contralateral. It is important to note that the
plethysmography method measures the whole limb
blood. While apparently it is the soft tissue volume that is
changed in response to venous occlusion, it is the venous
vasculature congestion within the soft tissue rather than
soft tissue congestion per-se that is responsible for the vol-
ume changes that allow us to measure the blood flow.
Quantitative SPECT/CT scintigraphy
Immediately following the plethysmography study, a
SPECT/CT study of the upper and lower limbs was per-
formed on all patients 10 minutes following intravenous
administration of 740 MBq Tc99m in-vitro labeled red
blood cells[20]. SPECT/CT was performed using a nuclear
medicine dual head variable angle gamma camera system
equipped with a low power x-ray imaging system (Infinia
& Hawkeye, GE Healthcare Technologies, USA).
The x-ray imaging system is composed of an x-ray tube
and a set of detectors located opposite the x-ray tube. They
are mounted on the same gantry and rotate around the
patient with the gamma detectors. SPECT and CT scan
acquired sequentially with the patient remaining com-
pletely still between the scans. Resolution of the x-ray
image is 1 mm, but localization images used for clinical
reading are produced with a 1.69 mm pixel size. The x-ray
images are acquired and reconstructed using the inte-
grated workstation. The data is then transferred to the
nuclear medicine database of the processing workstation
(Xeleris, GE Healthcare Technologies, USA). SPECT
images were acquired using a dual energy window session
providing emission and scatter emission projection. The
emission acquisition protocol was performed using a
matrix size of 128 × 128, parallel head configuration, 180
degrees rotation per head, with an angle step of 3 degrees.
Time per frame was 25 seconds. Reconstruction of SPECT
data was performed on the processing workstation using
scatter correction and attenuation correction (based on
attenuation maps derived from the CT image). CT was
also used as anatomical map for the functional NM data.
The radiation dose to the patient (i.e. the combination of
the radiation dose from the SPECT radiopharmaceutical
and the radiation dose from the CT portion of the study)
was estimated to 6 mS
V
.
Journal of Orthopaedic Surgery and Research 2008, 3:36 />Page 3 of 8
(page number not for citation purposes)
Calculations and statistical analysis
Blood flow calculations
SPECT/CT data (volume and scintigraphic readings)
1. Volumes and blood pool activity of the bone (including
bone marrow) and soft tissue were determined using seg-
mentation based on thresholds within a virtual cylinder
consistent of 3–4 slices (slice thickness 7 mm) on the CT
image. The height of the virtual cylinder on which meas-
urements were performed was of approximately 1.4 – 2.1
cm. Precise calculation of the entire cylinder volume (V
L
)
is provided by the CT component of the dual modality
imaging procedure (see additional file 2).
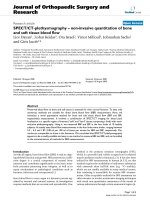
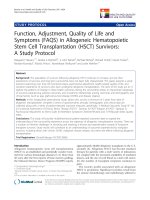
2. Bone volumes, including the bone marrow (V
B
), were
derived from the CT scan using an in-house software that
performs segmentation of the bone and soft tissue for
each CT slice, subsequently creating corresponding
regions of interest. The regions of interest are copied to the
registered reformatted SPECT slices in order to correspond
to CT voxel size (Figure 1).
3. Data regarding total limb and bone blood pool con-
fined to the virtual cylinder (R
L
and R
B
respectively) was
derived from scintigraphic data using the corresponding
counts confined to V
L
and V
B
(raw data shown in addi-
tional file 3).
SPECT/CT reconstruction with X-ray image showing volume (in ml) and counts in the bone (red) and total limb (green)Figure 1
SPECT/CT reconstruction with X-ray image showing volume (in ml) and counts in the bone (red) and total
limb (green).
Journal of Orthopaedic Surgery and Research 2008, 3:36 />Page 4 of 8
(page number not for citation purposes)
4. The limb (and thus the)virtual cylinder is composed of
soft tissue (mainly muscles and skin) and "hard" tissue
(bone and bone marrow). The soft tissue volume (V
S
) and
blood pool (R
S
) are calculated as follows: V
S
= V
L
-V
B
and
the corresponding reading R
S
= R
L
-R
B
.
Bone and soft tissue blood flow measurements (F
B
and F
S
,
respectively) are based on the following considerations:
1. Assume that a part of the leg or arm under examination
is in a form of a cylinder.
The cylinder is composed of two compartments: the bony
compartment and the soft tissue compartment.
2. We define the blood volumes (units are ml blood)
within each compartment:
υ
B
– blood volume within bone compartment (including
bone marrow).
υ
s
– blood volume within soft tissue compartment.
υ
L
– blood volume within the volume that is confined
within the 100 ml cylinder.
3. Based upon plethysmographic measurements, blood
flow to the limb (in the selected area) is:
F
L=
υ
L
/min·100 ml tissue (ml blood/min·100 ml tissue)
If we determine the portion of limb under examination
(i.e. the cylinder) volume is 100 ml, then: υ
L
ml blood
pass through it in 1 minute.
4. The main assumption is that in a resting state, the
vasoregulatory systems are balanced, thus the blood flow
in each compartment is constant, and the momentary
blood flow can be calculated from the plethysmography.
Say that a momentary blood flow through the 100 ml cyl-
inder occurs within a time period dt(t→0), then:
υ
L
(dt) = υ
L
·dt/min (note that dt and min are both time
units, thus υ
L
dt units are volume units – i.e. ml blood. It
means that a momentary volume of υ
L
·dt/min pass dur-
ing a dt period of time)
5. Since only RBC are marked, the scintigraphic readings
are proportional to the blood pool within each compart-
ment.
Say that:
R
B
– scintigraphic reading within the bony compartment
in the virtual cylinder.
R
S
– scintigraphic reading within the soft tissue compart-
ment.
R
L
– scintigraphic reading within the entire limb compart-
ment.
6. During the infinitesimal time period dt, the blood vol-
ume within the bony compartment are proportional to
the scintigraphic readings.
υ
B(dt)
= (R
B
/R
L
)·υ
L
·dt/min (units are of volume-i.e ml
blood)
7. We can measure bone and soft tissue compartments
volumes precisely from the CT scans: we take the 3–4
slices within the virtual cylindered shape limb portion
under examination. We know the slice thickness (slice
thickness 7 mm – the distance between the CT slices). The
height of a virtual cylinder that its cross sectional area is
equal to the slices' is 1.4 – 2.1 cm.
8. The mean measured cylinder volume between the CT
slices (V
L
) is 149 ml and 260 ml for the upper and lower
limbs, respectively (see additional file 2). Since these vol-
umes are quite small, we may say that within a 100 ml
piece of this virtual cylinder the ratios between the bone
and soft tissue volumes is preserved.
9. Say that V
B
/V
L
is the relative bone volume of the virtual
cylinder between the slices. Thus, in order to calculate the
momentary blood volume within a 100 ml bony
com-
partment (υ
B
(dt)
100
), we need to multiply υ
B
(dt) by the
ratio V
L
/V
B
:
In this way:
10. If we assume, again, that in resting position the
vasoregulatory systems are in balance, and the ratios V
L
/
V
B
; υ
L
/V
L
; and R
B
/R
L
remain constant, then we can correct
to a minute flow by multiplying υ
B
(dt)
100
min/dt, which
gives:
11. In a same way, the soft tissue blood flow per 100 ml
soft tissue per minute is:
υ
υυ υ
B
dt
B
dt V
L
V
B
R
B
R
LL
dt V
L
V
B
R
B
R
LL
dt
()
() ( / ) /min ( / ) /m
100
==
⋅⋅
=
⋅⋅
iin⋅V
L
V
B
F
B
V
B
LR
B
R
L
V
L
V
B
B
=
⋅
=
⋅⋅
υυ
(min ) ( / )100
F
SL
R
S
R
L
V
L
s
=
⋅
=
⋅⋅
υυ
(min ) ( / )100
V
S
V
S
Journal of Orthopaedic Surgery and Research 2008, 3:36 />Page 5 of 8
(page number not for citation purposes)
Statistical Analysis
Data are presented as mean ± SEM. Wilcoxon-matched-
paired test, which is suitable for comparison between
small groups, was used to compare between upper and
lower limbs and their contralaterals. The level selected for
statistical significance was set at P value < 0.05. Data were
analyzed with Excel (Microsoft 2000, USA) and GraphPad
Prism (version 3.0, GraphPad Softwarte, Inc., San Diego,
CA).
Results
Six men and four women were evaluated. Subject's mean
age, weight, height, body mass index (BMI, weight/height
in m
2
), systolic and diastolic blood pressure and heart
rates are presented in additional file 1. Raw volume meas-
urements and scintigraphic readings depicted from
SPECT/CT are shown in additional file 2. Briefly, the
limbs' parts volumes that were examined (referred as a
"virtual cylinder" in the methods section) were 149 ± 15,
149 ± 16 ml for right and left upper limbs, and 265 ± 22
and 256 ± 20 ml for the right and left lower limbs, respec-
tively.
At steady state blood flow measurements in the four limbs
ranged between 5.5 – 6.5 and 1.87–2.48 ml per 100 ml of
tissue per minute for BBF and SBF, respectively.
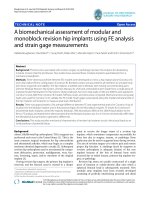
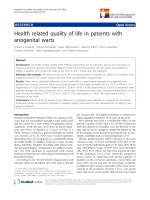
Blood flows in each limb and its compartments are pre-
sented in additional file 3 and in figure 2. F
B
was signifi-
cantly higher compared to F
S
in all four limbs (6.16 ± 0.65
vrs 2.37 ± 0.30 in RUL, p < 0.001; 5.9 ± 1.1 vrs 1.87 ± 0.20
in LUL, p < 0.001;6.28 ± 0.72 vrs 2.48 ± 0.28 in RLL, p <
0.001; 5.63 ± 0.72 vrs 2.36 ± 0.29 in LLL, p < 0.001, units
in ml blood per minute per 100 ml). No significant differ-
ences in either bone or soft tissue blood flows were meas-
ured between right and left limbs, both in the upper and
the lower extremities.
Discussion
Normal growth, remodeling and repair of bone require
delivery of nutrients and oxygen through blood flow to
bone tissue [21]. Interruption of normal bone and soft tis-
sue blood flow has been shown to be responsible for the
development of severe and common health problems
including diabetic ulcers and osteoporosis [22]. Neverthe-
less, only limited literature is available on the physiology
and pathophysiology of bone and soft tissue blood flow,
as compared to other tissues (e.g. renal, brain) that have
been thoroughly investigated. Presently, we describe a
novel method that which enables noninvasive BBF quan-
tification in humans.
Dual modality SPECT/CT imaging enables to quantify,
with a high degree of precision, blood pool localized in a
specific area of interest (in our study, the "soft" and
"hard" tissues composing a limb). This method, com-
bined with plethysmographic measurements, allows for
quantification of blood flow in the tissues being evalu-
ated. In this study, we showed that the BBF in the upper
and lower limbs ranges between 5.5 and 6.5 ml per 100
ml of tissue per minute. These results are comparable with
previously published data (e.g. Kubo et al., using
15
O PET,
showed that blood flow in femoral heads correlates with
age and ranges between 1.7–6 ml/min per 100 g tissue)
[23,5,4].
Data from animal studies using labeled microspheres
reveals a variation in BBF, in the range of 5–20 ml/min per
100 g, within different regions of the same bone sample
[10]. This method requires animal sacrifice for a direct
measurement of fluorescence or radioactivity assessment,
thus cannot be comparable to methods used in humans.
Our research has also shows that soft tissue blood flow
(which is mainly a contribution of skeletal muscles) aver-
aged between 1.87–2.48 ml/min per 100 ml tissue, which
is comparable of PET measurements (range between
1.43–6.72 ml/min per 100 g muscle [5,4,24,2]. Notewor-
thy to mention that SPECT/CT-plethysmography revealed
a trend towards a higher SBF in the dominant right upper
limbs compared with the contralateral. Another interest-
ing observation is that BBF was almost three times higher
as compared to the adjacent SBF (per 100 ml tissue).
Notice that while data in the literature is expressed as ml
per minute per g tissue, ours is expressed as ml per minute
per 100 ml tissue, since plethysmographic measurements
are based on volume changes. This may be the reason for
the small differences of our data from that described in
the literature.
Venous-occlusive plethysmography is an easy and accu-
rate method for the assessment of total limb blood flow.
It cannot however, distinguish between the various tissue
components in the limb. It cannot also differentiate
between soft tissue components blood flow (i.e. skeletal
muscle and skin). In this study, however, an anatomical
CT interface such as CT was manually fused with data
derived from SPECT studies in order to accurately localize
blood flow measurements to the bone. Fusion methods of
separately performed functional and structural imaging
data are based, as a rule, on extrinsic or intrinsic land-
marks. Accurate localization of these markers is, however,
difficult and requires considerable operator skill. These
drawbacks are more prominent in aligning the nuclear
medicine data, which suffer from inherent low resolution.
Inaccurate registration of separately acquired scinti-
graphic and CT data may be due to differences in patient
positioning between studies, as well as to differences in
organ location and volume at the time of imaging [18].
Sequential acquisition of scintigraphic SPECT and CT data
Journal of Orthopaedic Surgery and Research 2008, 3:36 />Page 6 of 8
(page number not for citation purposes)
Bone (upper graph) and soft tissue (lower graph) blood flow in each limb (RUL-right upper limb, LUL-left upper limb, RLL-right lower limb, LLL-left lower limb)Figure 2
Bone (upper graph) and soft tissue (lower graph) blood flow in each limb (RUL-right upper limb, LUL-left
upper limb, RLL-right lower limb, LLL-left lower limb). Blood flow units are expressed in ml/100 ml tissue·min-1 units,
mean value for each column is marked with transverse line).
Journal of Orthopaedic Surgery and Research 2008, 3:36 />Page 7 of 8
(page number not for citation purposes)
during a single imaging session using SPECT/CT over-
comes these limitations by accurate localization of blood
pool, represented by uptake of labeled RBC, as demon-
strated on SPECT, to specific areas in bone and soft tis-
sues, as delineated by the CT.
Study limitations and clinical perspectives
1. Plethysmography is a measurement technique that can
only be applied to long bones and our method is, at
present, only suitable for measuring limb blood flow.
Future innovations involving a combination of SPECT/CT
with different techniques for the assessment of regional
blood flow (e.g., Dupplex) may allow for BBF measure-
ment in flat/small bones.
2. Present method did not allow for separation of bone
marrow from cortical bone flow. The use of improved
devices with higher imaging resolutions may allow in the
future studying the specific blood flow distribution within
the bone.
3. When one comes to compare our results with those of
the literature, he need to be aware that in the literature the
bone blood flow results are presented in ml blood per
minute per 100 grams bone tissueunits. We, however,
present the results in units of 100 ml blood per minute per
100 ml bone tissue. In order to compare the values pre-
sented in the current paper with those in the literature,
one need to correct the units that we used by dividing
them in the specific gravity of the tissue. For example: we
showed that the mean F
B
in the RUL is 6.16 ml blood per
minute per 100 ml bone tissue. If the specific gravity of
bone is (for example) 1.8 gr/ml, then the correction is
6.16/1.8 ml blood/min/100 gr bone.
We raised this points in order to precede one expected
question regarding our results: the fact that we found
bone blood flow much higher than soft tissue blood flow.
If you correct our results using the specific gravity of each
tissue, you will find them quite similar to those in the lit-
erature.
4. Our assumption that in resting-supine state is a steady
state, where blood hydrodynamic characteristics between
bone and muscle are comparable is essential, and the
entire theory is based upon it. We could find neither sup-
port nor contradiction to this assumption in the literature,
yet it seems only intuitive to us.
5. Our measurements cannot differentiate muscle from
skin blood flow, thus SBF refers to both.
6. The resolution of the method, which supposedly deter-
mines a metric of blood flow in the bone, would be the
smallest difference in blood flow this method can detect.
The resolution is usually determined using a phantom
simulating the procedure performed on the patient where
all parameters are known. We do not believe we can deter-
mine this based on our method as no gold standard for
osseous blood flow is currently available. The potential
noise sources (factors that would influence the measured
value that are not related solely to the blood flow in the
bone) are:
a. Tecnical factors related to the veno-occlusive plethys-
mography (incorrect placement etc.)
b. Poor labeling of RBC.
c. Patient motion during acquisition of nuclear medicine
study.
d. Misregistartion of CT and nuclear medicine portion of
study due to motion.
e. Metallic devices in bone.
f. Operator error during processing of data.
Conclusion
Bone blood flow is a physiologic characteristic that needs
yet to be investigated in settings of clinical significances
such as atherosclerosis, anti-hypertensive treatment, and
osteoporosis, all conditions that are known to affect BBF.
Here we offer it not as a replacement, but rather as addi-
tional method in the minute armamentarium of methods
for BBF measurement.
Competing interests
The authors declare that they have no competing interests.
Authors' contributions
LD carried out the research designing, physiologic studies,
data analysis and writing. ZK carried out the nuclear scan
studies, participated in data processing and writing. OI
participated in scan studies and data analysis. VM partici-
pated in data analysis. JS participated in scan studies and
data analysis. GJ carried out the research designing, phys-
iologic studies, data analysis and writing. All authors read
and approved the final manuscript.
Additional material
Additional file 1
Clinical characteristics of subjects (presented as mean ± SEM).
Click here for file
[ />799X-3-36-S1.jpeg]
Publish with BioMed Central and every
scientist can read your work free of charge
"BioMed Central will be the most significant development for
disseminating the results of biomedical research in our lifetime."
Sir Paul Nurse, Cancer Research UK
Your research papers will be:
available free of charge to the entire biomedical community
peer reviewed and published immediately upon acceptance
cited in PubMed and archived on PubMed Central
yours — you keep the copyright
Submit your manuscript here:
/>BioMedcentral
Journal of Orthopaedic Surgery and Research 2008, 3:36 />Page 8 of 8
(page number not for citation purposes)
References
1. Laroche M: Intraosseous circulation from physiology to dis-
ease. Joint Bone Spine 2002, 69:262-269.
2. Nuutila P, Kalliokoski K: Use of positron emission tomography
in the assessment of skeletal muscle and tendon metabolism
and perfusion. Scand J Med Sci Sports 2000, 10:346-350.
3. Raitakari M, Nuutila P, Ruotsalainen U, Teras M, Eronen E, Laine H,
Raitakari OT, Iida H, Knuuti MJ, Yki-Jarvinen H: Relationship
between limb and muscle blood flow in man. J Physiol 1996,
496 ( Pt 2):543-549.
4. Kubo T, Kimori K, Nakamura F, Inoue S, Fujioka M, Ueshima K, Hira-
sawa Y, Ushijima Y, Nishimura T: Blood flow and blood volume
in the femoral heads of healthy adults according to age:
measurement with positron emission tomography (PET).
Ann Nucl Med 2001, 15:231-235.
5. Iida S, Harada Y, Ikenoue S, Moriya H: Measurement of bone mar-
row blood volume in the knee by positron emission tomog-
raphy. J Orthop Sci 1999, 4:216-222.
6. Binzoni T, Leung T, Hollis V, Bianchi S, Fasel JH, Bounameaux H, Hilt-
brand E, Delpy D: Human tibia bone marrow: defining a model
for the study of haemodynamics as a function of age by near
infrared spectroscopy. J Physiol Anthropol Appl Human Sci 2003,
22:211-218.
7. Kane WJ: Fundamental concepts in bone-blood flow studies. J
Bone Joint Surg Am 1968, 50:801-811.
8. Shim SS: Physiology of blood circulation of bone. J Bone Joint
Surg Am 1968, 50:812-824.
9. Swiontkowski MF, Tepic S, Perren SM, Moor R, Ganz R, Rahn BA:
Laser Doppler flowmetry for bone blood flow measurement:
correlation with microsphere estimates and evaluation of
the effect of intracapsular pressure on femoral head blood
flow. J Orthop Res 1986, 4:362-371.
10. Anetzberger H, Thein E, Becker M, Walli AK, Messmer K: Validity
of fluorescent microspheres method for bone blood flow
measurement during intentional arterial hypotension. J Appl
Physiol 2003, 95:
1153-1158.
11. Anetzberger H, Thein E, Maier M, Birkenmaier C, Messmer K: Fluo-
rescent microspheres are reliable for serial bone blood flow
measurements. Clin Orthop Relat Res 2004:241-248.
12. Anetzberger H, Thein E, Loffler G, Messmer K: Fluorescent micro-
sphere method is suitable for chronic bone blood flow meas-
urement: a long-term study after meniscectomy in rabbits. J
Appl Physiol 2004, 96:1928-1936.
13. Anetzberger H, Thein E, Becker M, Zwissler B, Messmer K: Micro-
spheres accurately predict regional bone blood flow. Clin
Orthop Relat Res 2004:253-265.
14. ElMaraghy AW, Humeniuk B, Anderson GI, Schemitsch EH, Richards
RR: Femoral bone blood flow after reaming and intramedul-
lary canal preparation: a canine study using laser Doppler
flowmetry. J Arthroplasty 1999, 14:220-226.
15. Fleming JT, Barati MT, Beck DJ, Dodds JC, Malkani AL, Parameswaran
D, Soukhova GK, Voor MJ, Feitelson JB: Bone blood flow and vas-
cular reactivity. Cells Tissues Organs 2001, 169:279-284.
16. Notzli HP, Swiontkowski MF, Thaxter ST, Carpenter GK III, Wyatt R:
Laser Doppler flowmetry for bone blood flow measure-
ments: helium-neon laser light attenuation and depth of per-
fusion assessment. J Orthop Res 1989, 7:413-424.
17. Rhinelander FW: Tibial blood supply in relation to fracture
healing. Clin Orthop Relat Res 1974:34-81.
18. Keidar Z, Israel O, Krausz Y: SPECT/CT in tumor imaging: tech-
nical aspects and clinical applications. Semin Nucl Med 2003,
33:205-218.
19. Hokanson DE, Sumner DS, Strandness DE Jr.: An electrically cali-
brated plethysmograph for direct measurement of limb
blood flow. IEEE Trans Biomed Eng 1975, 22:25-29.
20. Patrick ST, Glowniak JV, Turner FE, Robbins MS, Wolfangel RG:
Comparison of in vitro RBC labeling with the UltraTag RBC
kit versus in vivo labeling. J Nucl Med 1991, 32:242-244.
21. Brinker MR, Lippton HL, Cook SD, Hyman AL: Pharmacological
regulation of the circulation of bone. J Bone Joint Surg Am 1990,
72:964-975.
22. Frost ML, Cook GJ, Blake GM, Marsden PK, Benatar NA, Fogelman I:
A prospective study of risedronate on regional bone metab-
olism and blood flow at the lumbar spine measured by 18F-
fluoride positron emission tomography. J Bone Miner Res 2003,
18:2215-2222.
23. Guyton A 1996 Local control of blood flow by the tissues.In: Guyton
H 9th ed.Saunders,Philadelphia,pp.199-208.: . .
24. McCarthy I: The physiology of bone blood flow: a review. J Bone
Joint Surg Am 2006, 88 Suppl 3:4-9.
Additional file 2
Raw data extracted from SPECT/CT. Volumes (in ml) and scintigraphic
readings (in counts) of total "cylinder" and bone. RUL-right upper limb,
LUL-left upper limb, RLL-right lower limb, LLL-left lower limb. V
L
and
R
L
-entire "cylinder" volume and counts, respectively. V
S
and R
S
, volume
and counts of soft tissue, respectively. V
B
and R
B
, volume and counts of
bone compartment, respectively. Data is expressed as mean ± SEM.
Click here for file
[ />799X-3-36-S2.jpeg]
Additional file 3
Blood flow measurements, resistance and ratios. Blood flow units are
expressed in ml/100 ml tissue·min
-1
units. RUL-right upper limb, LUL-
left upper limb, RLL-right lower limb, LLL-left lower limb. F
L
-total limb
blood flow, F
B
-bone blood flow, F
S
blood flow in the soft tissue compart-
ment. Data is expressed as mean ± SEM.
Click here for file
[ />799X-3-36-S3.jpeg]