Ferroelectrics Physical Effects Part 16 docx
Bạn đang xem bản rút gọn của tài liệu. Xem và tải ngay bản đầy đủ của tài liệu tại đây (4.02 MB, 40 trang )
Compositional and Optical Gradient in Films of PbZr
x
Ti
1-x
O
3
(PZT) Family
589
deposition technique different kind of chemical gradient can be obtained depending on
deposition conditions.
Fig. 6. Optical gradient formation reasons in thin films.
3.3 Gradient in PZT thin films prepared by sputtering and hydrothermal techniques
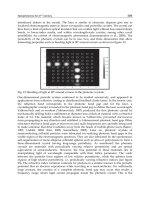
Some examples of compositional gradient for sputtering and hydrothermal techniques are
summarized in Fig. 7. For sputtering methods it is quite common to obtain PZT films with
enriched Pb and/or Pb/(Zr+Ti) towards the surface of the film resulting in increase of
refractive index near the surface (Fig. 7, Case 1 and 2). It is due to the fact that sputtering
techniques have difficulty in composition control due to high volatility of Pb or PbO.
Special profile of refractive index in the perovskite PZT films is induced by a
selfpolarization formed during film deposition and cooling down (Deineka et al, 2001,
Suchaneck et al., 2002). For example, PZT thin films of about 1 μm thickness deposited by dc
and RF-sputtering on Si/SiO
2
/adhesion layer/(1 1 1)Pt substrates had the Ti/Ti+Zr ratio
nearly constant throughout the PZT film, while the surface was strongly lead enriched
(Pb/Ti+Zr ≈ 1.6) and the bottom electrode interface was lead depleted (34). Obtained optical
profile by SE was similar to that presented in Fig. 2.
Fig. 7. Common compositional profiles for PZT thin film fabricated by sputtering and
hydrothermal techniques. Case 1: based on the work of Vidyarthi et al., 2007; Case 2: Chang
and He, 2005; Suchaneck et al., 2002; Case 3: Morita et al., 1997; Ohba et al., 1994.
The situation is different with hydrothermal methods where, due to the low process
temperature and relatively high pressure, Pb and PbO evaporation does not take place and
Ferroelectrics – Physical Effects
590
interdiffusion and chemical reaction between the film and the substrate is suppressed. For
example, Ohba et al., 1994, observed a steep gradient of chemical composition between a
substrate and a PZT layer: an interfacial Ti-rich PZT layer with low piezoelectric constant
near the substrate. Contrary to this result, Morita et al., 1997, reported that separated PTO
and PZO layers were deposited during the nucleation process; the PTO layer grew during
the first 2 h of the nucleation process, followed by the PZO film growth (Fig. 7, Case 3).
3.4 Gradient in sol-gel PZT thin films
A great number of sol-gel processing paramiters as temperature pyrolysis and final heat-
treatment, heat treatment atmosphere and duration, solution composition, and seeding layer
are strongly influencing the structural and, therefore, physical properties of PZT films.
Broad studies have been done on chemical depth profile of sol-gel PZT films depending on
the process conditions mention above. Some examples of chemical depth profile for sol-gel
PZT films on platinized Si (regarding solvents, pyrolysis and annealing) are given in Fig.8.
As can be seen it is not evident whether initial sol or annealing is responsible for the
gradient appearance. One of the major limitations of the sol-gel technique is that it does not
yield the desired perovskite phase directly. Thermodynamically driven diffusion and/or
kinetic demixing for sol-gel films are strongly determine by how the annealing is
accomplished (furnace, hot plate, rapid thermal annealing, temperature, duration etc), lead
content of the starting solution, and also thermal decomposition of raw components. Quite
often some of these factors are not mentioned in the publications and it makes difficult or
even impossible to do comparisons and reasonable conclusions of these studies.
The formation of perovskite phase upon final annealing is preceded by an undesirable
nonferroelectric pyrochlore phase. Pyrochlore inclusions are often observed in sol-gel
derived perovskite films. An intermediate annealing step (pyrolysis) plays a pivotal role in
determining the crystal orientation as well as ferroelectric and piezoelectric properties of the
resultant PZT films (Izyumskaya et al., 2007). There are some studies done for this
intermediate stage.
Fig. 8. Common compositional profiles for PZT thin film fabricated by sol-gel. Stage 1: Initial
gel; Stage 2: Initial crystallization; Stage 3: Full crystallization. Case 1 and 2: based on work
of Etin et al., 2006; Case 3: Ledermann et al., 2004; Case 4 and 5: Aulika et al., 2009.
The paper of Etin et al., 2006, proved that variation in Zr/Ti ratio in PZT films originates
early in the crystallization process. These variations are caused by a mismatch in the thermal
decomposition of the individual Zr/Ti components in the PZT precursor. Once created, the
Compositional and Optical Gradient in Films of PbZr
x
Ti
1-x
O
3
(PZT) Family
591
compositional gradients cannot be eradicated by prolonged heat treatments. In the Cases 1
and 2, presented in Fig, 8, PZT films were prepared by two sol-gel precursor formulations.
The difference between the two formulations is the stabilization of the zirconium precursor:
a) Zr precursor is chemically stabilized with AcOH, or b) Zr is stabilized with
acetylacetonate (AcAc). Formulation (a) led to opposite concentration gradients of Zr
(increasing) and Ti (decreasing) towards surface, while formulation (b) gave rise to constant
Zr and Ti concentrations towards the substrate throughout the films. The elemental depth
distributions are governed by the thermal decomposition pattern of the individual metal
compounds in the sol–gel precursor (Etin et al., 2006). In formulation (a) Zr precursor
stabilized with AcOH showed faster pyrolysis and lower decomposition temperature than
the Ti precursor. Thus, in formulation (a) Zr-rich phase can form in the bulk before the Ti
precursor enters the reaction. After the Ti precursor decomposes, growth of Ti-rich PZT film
proceeds from the interface with the Pt electrode leading to opposing concentrations
gradients of Zr and Ti in the film. In formulation (b) the decomposition of Ti and Zr
precursors occurs simultaneously and therefore a uniform depth profile is obtained.
Distribution of the nearest neighbor and next nearest neighbor ions in the pyrochlore phase
was demonstrated to be similar to those in the amorphous phase (Reaney et al., 1998).
Therefore, although perovskite is the thermodynamically stable phase in the temperature
range used in sol-gel fabrication, the transformation from amorphous to pyrochlore phase is
kinetically more favorable than a straight transformation to the perovskite phase. The
kinetics of transformation from the amorphous to perovskite phase as well as film
orientation was shown to depend strongly on the pyrolysis conditions (Brooks et al., 1994;
Reaney et al., 1998).
In the work of Ledermann et al., 2003, it is shown that sol-gel PZT thin films are Ti-rich
closer to the substrate and Zr-rich closer to the surface for each layer of the film, as well as
that the concentration of Pb increases directionally from the substrate to the surface (Fig. 8,
Case 3). This is special case of controlled compositional gradient of sol-gel PZT thin films:
the gradient has amplitude of ±20% at the 53/47 morphotropic phase boundary (MPB),
showing improved electrical performances. Thanks to the high development of film
deposition techniques, in our days it is possible to fabricate controlled compositions,
textures and structures of the films with dedicated properties.
These gradient studies show that selection of precursors (chemical solvents) and processing
parameters (drying temperatures and time, crystallization temperature and time, etc.) for
the deposition of sol-gel films is influential in controlling the homogeneity of the films.
Recently detailed studies of sol-gel PZT 52/48 thin and thick films were presented (Aulika
et al., 2009), which were made by using two different solvent systems: a mixture of acetic
acid and methanol (AcOH/MeOH) or 2-Methoxyethanol (2-MEO) (Fig. 8, Case 4 and 5). To
crystallize the films, two different thermal profiles were applied: all layers crystallized
together (LCT) at the same time, and each layer crystallized individually (LCI). The first
profile employed the deposition of one layer followed by drying at 300°C for 1 min. When
the final layer was deposited, the sample was placed on a hotplate at 550°C for 35 min to
crystallize. The second thermal profile involved individual crystallization of each layer by
holding the sample at 300°C for 1 min followed by 550°C for 5 min before the next layer was
coated. The annealing time was sufficient for all films to crystallize.
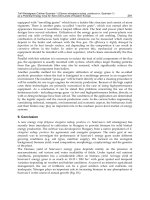
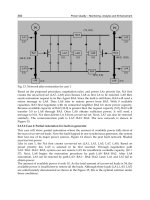
Among all analyzed samples, the refractive index gradient was found only for two groups
of films, which were made by crystallizing each layer before another layer was deposited
(LCI) (Aulika et al., 2009): 1) One group of films was made using the AcOH/MeOH sol
Ferroelectrics – Physical Effects
592
(Fig. 9a) and 2) the other group was made with the 2-MEO sol (Fig. 9b). The gradient is
different for all films of different thickness (Fig. 9). This is most likely due to recurrent
annealing of already crystallized layers. The trend of n with depth presented in Fig. 9b can
be caused by several reasons such as 1) residual stress in the film, 2) concentration gradients
of Ti or Zr with the layer, 3) an increase in excess Pb (Aulika et al., 2009; Deineka et al., 2001;
Ledermann et al., 2003; Watts et al., 2005), 4) polarization profile that is strongly dependent
on film thickness (polarization is homogeneous in the greater part of the thick film except in
small regions at the film boundaries, while it is completely inhomogeneous in thin films).
0 105 210 315 420 525
2.20
2.25
2.30
2.35
2.40
2.45
2.50
2.55
2.60
2.65
2.70
a)
AcOH/MeOH sol, LCI
2 layers
3 layers
4 layers
5 layers
n (700 nm)
d (nm)
0 65 130 195 260 325
2.28
2.32
2.36
2.40
2.44
2.48
2.52
b)
2-MEO sol, LCI
2 layers
3 layers
4 layers
5 layers
n (700 nm)
d (nm)
Fig. 9. Depth profile of refractive index n at the 700 nm of wavelength for the samples with
different number of layers made using a) AcOH/MeOH, and b) 2-MEO sol. All figures taken
from (Aulika et al., 2009). © The Electrochemical Society, Inc. [2009]. All rights reserved.
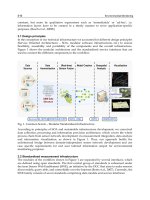
No optical gradient is found for films with different numbers of layers when all layers are
crystallized at the same time, regardless of the sol used. This was also confirmed for the tick
films (Aulika et al., 2009). The groups of films made with AcOH/MeOH sol and by the LCT
routine show strong (111) orientation with some low intensity peaks of other orientations,
such as (110), (112) or (001)/(100) (Fig. 10 cd). While films with optical gradient revealed
(001)/(100) and (002)/(200) orientations (Fig. 10 ab).
Based on the XRD results (Aulika et al., 2009) of LCI films, a picture of how the orientation
of the film changes when more layers are added was obtained. Thus, when processing the
films using the LCI method, only the first layer crystallizes directly on the Pt substrate and
all subsequently deposited layers crystallize on top of PZT 52/48. Since the thermal profile
used assures (100) orientation of the film, we would expect the first layer to be (100)
oriented, as well as all subsequently deposited layers, since the last layer also is crystallize
on (100) PZT. Nevertheless, both groups of PZT 52/48 films processed with the LCI method
in fact exhibit some (111) orientation for films having more than three layers. The
appearance of (111) orientation can only be explained if some excess of PbO after
crystallization is assumed, located close to the surface, as recently reported by Brennecka et
al., 2008. Indeed, some pyrochlore was found for all LCI films made with AcOH/MeOH sol.
It is thus possible that after the deposition of the next layer, the residual pyrochlore induced
nucleation and growth in the (111) direction, consuming the uncrystallized matrix and
accounting for the appearance of the (111) orientation at later stages within the first layer.
Considering the work of Brennecka et al., 2008 and results of Aulika et al., 2009, the
uncrystallized pyrochlore phase was most likely the lead deficient fluorite phase, which was
also accompanied by a compositional gradient of Pb/Zr through the layer thickness.
Compositional and Optical Gradient in Films of PbZr
x
Ti
1-x
O
3
(PZT) Family
593
20 25 30 35 40 45
Py
(002)
(200)
Pt
a)
2Θ (degrees)
Intensity (a. u.)
PZT 52/48, ACOH/MeOH, LCI
thin films
1 layer
2 layers
3 layers
4 layers
5 layers
(001)
(100)
(111)
k
β
20 25 30 35 40 45
Py
(002)
(200)
Pt
k
β
(001)
(100)
b)
2 layer
3 layers
4 layers
5 layers
2Θ (degrees)
Intensity (a. u.)
PZT 52/48, 2-MEO, LCI
thin films
20 25 30 35 40 45
Py
(002)
(200)
Pt
(111)
k
β
(110)
(001)
(100)
2Θ (degrees)
Intensity (a. u.)
PZT 52/48, ACOH/MeOH, LCT
thin films
1 layer
2 layers
3 layers
4 layers
5 layers
c)
20 25 30 35 40 45
d)
2 layers
3 layers
4 layers
5 layers
2Θ (degrees)
Intensity (a. u.)
PZT 52/48, 2-MEO, LCT
thin films
(001)
(100)
Py
(110)
k
β
(111)
Pt
(002)
(200)
Fig. 10. The XRD of the LCI samples for a) AcOH/MeOH films, b) 2-MEO films, and LCT
samples for c) ACOH/MeOH films, and d) 2-MEO films. All figures taken from (Aulika et
al., 2009). © The Electrochemical Society, Inc. [2009]. All rights reserved.
In pinpointing the cause of the detected optical gradient, any change in orientation with
number of layers can be eliminated based on the consideration that the films made with the
LCT method showed more mixed orientation among the samples, and yet no optical
gradient was found for these films. Moreover, the optical gradient was found in films made
with the LCI route, where a strong variation in lattice parameter with increasing thickness
was found, even though the type of gradient was dependent on the sol used.
On the other hand, it was reported that the n increases with increasing Ti/Zr concentration
(Tang et al., 2007; Yang et al., 2006). It is likely that the appearance of the depth profile for
the LCI films is connected with the fact that PbTiO
3
(PTO) crystallizes before PbZrO
3
(PZO)
(Impey et al., 1998), while crystallizing layers together may avoid preferential PTO and PZO
crystallization. Better quality PZT 52/48 composition thin films can be made by annealing
the films at higher temperatures using rapid thermal annealing (RTA) or oven, or to have a
different Zr/Ti concentration ratio in each layer with the goal to anticipate the selection and
diffusion processes (Calamea and Muralt, 2007). RTA usually needs fully crystallizing at >
650ºC, but in the study of Aulika et al., 2009, annealing temperature at 550ºC on a hotplate
was chosen so that the crystallization of the films started at the interface of Pt/ PZT and
grew up to the top rather than crystallizing the films in a oven/RTA which would lead to
the crystallization from everywhere and smeared the possible formation of gradient in
Ferroelectrics – Physical Effects
594
composition. This use of low annealing temperature led to the formation of pyrochlore
(Fig. 10a, c).
To summarize, there are three possible origins of the refractive index gradient n(d): 1) the
above-mentioned polarization inhomogeneity close to the film surface, and 2) the varying
Zr/Ti ratio and 3) varying Pb throughout the layer. The latter two can be attributed to the
separate crystallization of each layer, causing the diffusion of Pb, Ti and Zr ions in the film.
If we extrapolate this to the optical properties according to the fact that n increases with
decreasing Zr/Ti ratio (Fig.3), then we can say from Fig. 8b that the Zr/Ti ratio decreases
directionally from the substrate to the surface, which is opposite to the observations, e.g., of
Ledermann by TEM. However, it is known that sol-gel thin films may have higher
concentrations of Pb at the surface (Impey et al., 1998; Ledermann et al., 2003; Watts et al., 2005).
3.4.1 Surface enrichment in ferroelectric thin films
Surface enrichment of some elements has been reported by many authors (Impey et al., 1998,
Watts et al., 2001, 2003 and 2005; Gusmano et al., 2002), and there are just few explanations
for this phenomenon. An analogy may be drawn with the oxidation of metals such as Cu
and Sn where the metals dif-fuse towards the reacting surface (Wagner, 1971; Cabrera and
Mott, 1948).
The data presented by Watts et al indicates that the pyrolysis and crystallization steps for
sol-gel films result in incomplete oxidation (Watts et al., 2005). The diffusion is driven by the
oxidation of Pb at the PZT/oxygen interface. The second mechanism is kinetic demixing
(Martin, 2003): diffusion of metallic species at different rates, usually in the direction of
higher oxygen potential (even though the phase is thermodynamically stable under all these
oxygen pressures). This mechanism is often applied for kinetics of solid solutions, but it was
shown that a single phase can decompose under a chemical potential gradient (Wang and
Akbar, 1992). Most likely that both processed (thermodynamically driven diffusion or
kinetic demixing, (Fig. 6) are taking place since it is difficult to separate them due to the fact
that the low oxygen content in the film promotes both processes.
Fig. 11. Self-poling mechanism in ferroelectric thin films.
An electrical potential that polarizes the ferroelectric at high temperatures as it cools
through the Curie temperature is created by the migration of cations in the film (Fig. 11).
The spontaneous polarization allows the cations to diffuse faster and is the reason why
surface enrichment is so significant in ferroelectric films (Watts et al., 2005). The ferroelectric
(FE) polarization induced electrochemically by this mechanism is in the direction observed
experimentally by Impey et al., 1998, and by Okamura et al., 1999. Pb
2+
diffusion may also
lead to self-polarization, which causes the polarization inhomogeneity discussed above.
Compositional and Optical Gradient in Films of PbZr
x
Ti
1-x
O
3
(PZT) Family
595
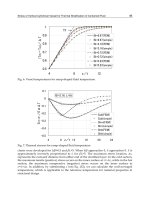
3.4.2 Confirmation of optically detected gradient by TEM and EDX
Fine grains of pyrochlore phase between perovskite crystallites throughout the film
thickness were observed for films made by LCI (Fig. 12a). A pyrochlore layer about 50 nm
thick was found at the surface of the film. These results are in accordance with the XRD
analysis (Fig. 10). The EDX results showed a strong variation in Pb and Zr concentrations
throughout the thickness of the film (Fig. 12b), and this film had a strong optical gradient.
Close to the surface where the pyrochlore layer was observed, a strong reduction in lead
concentration and an increase in zirconium concentration were detected.The titanium
concentration was not much affected by the phase separation. It can be conclude that these
samples show the same two-phase structure reported by Brennecka et al within each layer,
whereby the lead-deficient upper layer causes a compositional gradient.
For PZT 52/48 (LCT) film the columnar grains and additional ~10 nm thin pyrochlore layer
on the surface was found (Fig. 12c). This film had no optical gradient. No Py was detected
by XRD analysis due to its low amount (see Fig. 10). As shown in Fig. 12d, a more uniform
EDX concentration profile was obtained in comparison to Fig. 12b.
0 50 100 150 200 250 300
6
8
10
12
14
16
18
20
2.35
2.40
2.45
2.50
2.55
2.60
PZT 52/48, AcOH/MeOH, LCI
Ti
Zr
Pb
Atomic (%)
Bottom
Top
Thickness (nm)
b)
n (700 nm)
n(d)
0 50 100 150 200 250 300
8
10
12
14
16
18
20
22
d)
Atomic (%)
PZT 52/48, AcOH/MeOH, LCT
Ti
Zr
Pb
Bottom
Thickness (nm)
Top
Fig. 12. TEM micrograph (dark field (a) and bright field (c)) of a cross-section of LCI film (a)
and LCT film (c) showing pyrochlore phase (Py) between and on the surface of the PZT
grains; EDX profile from substrate to the film surface (b, d) in comparison with the optical
depth profile n(d) established by SE (b). All figures taken from (Aulika et al., 2009). © The
Electrochemical Society, Inc. [2009]. All rights reserved.
Ferroelectrics – Physical Effects
596
The results obtained by EDX are in good agreement with the optical data evaluated by SE
(Fig. 12b). There are almost no changes in variation of Pb, Zr, and Ti near the substrate of the
film, which is “reflected” in optical analyses as no optical gradient n(d). A significant
decrease in Pb and increase in Zr can be seen in the optical data as a decrease in n(d). Near
the surface n(d) starts to increase, which is in good agreement with other results (Deineka et
al., 1999, 2001, and January 2001; Suchaneck et al., 2002).
4. Conclusion
The brief introduction into the composition problems and composition control of
Pb(Zr
x
Ti
1-x
)O
3
(PZT) films were laid out in this chapter. Structural and ferroelectric
properties, growth rate, phase composition, and stoichiometry of PZT films depend on a
number of film deposition parameters. Understanding the chemistry and physics behind the
formation of PZT films are of basic and technological importance. The gradient (either
compositional and/or optical) can be induced by such factors as thermodynamically driven
diffusion and/or kinetic demixing, stress, and nucleation processes. Depending on
deposition processes involved, some or even all of these factors can be incorporated and
accountable for compositional and/or optical gradient formation in the films. For the same
film deposition technique different kind of chemical gradient can be obtained depending on
deposition parameters. Any change in the sample structure will affect the polarization and
optical properties of the material, irrespective of whether it is a result of the stoichiometry,
compositional gradient, internal stresses, etc.
Examples on the characterization methods both intrusive and nondestructive were given,
underlining the advantages of optical methods, especially spectroscopic ellipsometry, for
gradient detection in films.
The depth profile of the refractive index and composition was presented in details for sol-
gel PZT 52/48 thin films made using different chemical solvents and annealing procedures.
Thanks to the high development of film deposition techniques, in our days it is possible to
fabricate controlled compositions, textures and structures of the films with dedicated and
improved electrical properties.
It was also demonstrated that separate crystallization of the layers determines the gradient
appearance, irrespective of the chemical solvents as AcOH/MeOH and 2-MEO. The analysis
of the XRD results of PZT 52/48 films made with LCI has shown that these films have a
preferred orientation of (001)/(100) in contrast to the films made with LCT, which have
shown a predominant (111) orientation and no gradient in optical properties. A more
refined analysis has shown that a refractive index gradient was apparent in the samples in
which lattice parameters strongly change with thickness. For these films, EDX analysis
showed significant variation in Pb and Zr. In addition, these qualitative spectroscopic
ellipsometry analyses are in accordance with results obtained with other methods, like EDX
and ERD. Thus, the spectroscopic ellipsometry method offers the opportunity to accomplish
quality analysis of thin films in a relatively simple, fast, and non-destructive way.
To improve spectroscopic ellipsometry calculation for PZT films with complex optical
gradients, the films should be considered as a media of two materials – PZT 52/48 and Py,
where the PbTiO
3
and PbZrO
3
concentrations change within a PZT film. Such complex
calculations can be obtained from SE experimental data if additional SE measurements are
made on samples of pure Py, PbTiO
3
and PbZrO
3
films to extract their optical properties.
Nevertheless, by applying a simple exponential gradient model to experimental SE data
Compositional and Optical Gradient in Films of PbZr
x
Ti
1-x
O
3
(PZT) Family
597
analysis, reasonable qualitative data can be obtained which gives an idea of the quality of
the sample, its optical properties, optical gradient and homogeneity. Moreover, these
qualitative SE analyses are in accordance with results obtained with other methods, e.g.,
SIMS, EDX and XRD. Thus, the SE method offers the opportunity to accomplish optical
analyses of thin films in a simple, fast, precise and non-destructive way, as well as acquire
reasonable results and obtain justified information about the quality of thin films. SE is
perfect also for real time monitoring of film growth, thickness, optical constants, interface,
roughness, optical gradient detection.
Advantages of SE like speed and accuracy, nondestructiveness, no specific sample
preparation requirements, compatible with liquid & solid samples, characterization on both
absorbing & transparent substrates, thermo-optics (e.g., phase transition analyses), and
inhomogeneities detection (porosity, surface roughness, interfaces, optical gradient etc) is of
great significance not only from a fundamental, but also from a technological point of view
due to intense developments in micro & nano-electronics for nanostructures engineering,
where changes in interfaces, within the films and surfaces, and a requirement to detect it,
plays very important role. And in this spectroscopic ellipsometry is unique as metrology
instrumentation.
5. Acknowledgements
Some results published in this chapter were made within the 6th Framework Program of the
Multifunctional & Integrated Piezoelectric Devices (MIND). This work was supported by
the European Social Fund and UNESCO LÓREAL Latvian National Fellowship for Woman
in Science, and grants KAN301370701 of the ASCR, 1M06002 of the MSMT CR,
2 202/09/J017 of GACR and AV0Z10100522. We would like to express our gratitude to
Sebastjan Glinsek for TEM sample preparation.
6. References
Aulika, I.; Corkovic, S.; Bencan, A.; D’Astorg, S.; Dejneka, A.; Zhang, Q.; Kosec M.; Zauls, V.
(2009), The influence of processing parameters on the formation of optical gradients
in chemical solution-derived PbZr
0.52
Ti
0.48
O
3
thin films. Journal of Electrochemical
Society, 156, G217
Aulika, I.; Dejneka, A.; Lynnyk, A.; Zauls, V.; Kundzins, M. (2009), Thermo-optical
investigations of NaNbO
3
thin films by spectral ellipsometry. Physica Status Solidi
(c), 6, 2765
Aulika, I.; Dejneka, A.; Zauls, V.; Kundzins, K. (2008), Optical gradient of the trapezium-
shaped NaNbO
3
thin films studied by spectroscopic ellipsometry, Journal of
Electrochemical Society, 155, G209
Aulika, I.; Deyneka, A.; Zauls V.; Kundzins, K. (2007), Thermo-optical studies of NaNbO
3
thin films. Journal of Physics, Conference Edition, V93, 012016
Boher, P.; Stehle, J. L.; Piel, J. P.; Fried, M.; Lohner, T.; Polgar, O.; Khanh, N. Q.; Barsony, I.
(1996), Spectroscopic ellipsometry applied to the determination of an ion
implantation depth profile. Nuclear Instruments and Methods in Physics Research
Section B, 112, 160
Born, М.; Wolf, E. (Cambrig University, 1999), Principles of optics, 7
th
(expended) edition
Ferroelectrics – Physical Effects
598
Bovard, B.G. (1990), Rugate filter design: the modified Fourier transform technique, Applied
Optics, 29, 24-30
Brennecka, G.L.; Parish, C. M.; Tuttle, B. A.; Brewer, L. N.; Rodriguez, M.A. (2008),
Reversibility of the Perovskite
‐to‐Fluorite Phase Transformation in Lead‐Based
Thin and Ultrathin Films. Advanced Materials, 20, 1407
Brevnov, D. A.; Bungay, C. (2005), Diameter-Dependent Optical Constants of Gold
Mesoparticles Electrodeposited on Aluminum Films Containing Copper. The
Journal of Physical Chemistry B, 109,
14529
Brooks, K. G.; Reaney, I. M.; Klissurska, R.; Huang, Y.; Buzsill, L.; Setter, N. (1994),
Orientation of rapid thermally annealed lead zirconate titanate thin films on (111)
Pt substrates. Journal of Material Research, 9, 2540
Bungay, C.; Tiwald, T. E.; (2004), Infrared spectroscopic ellipsometry study of molecular
orientation induced anisotropy in polymer substrates. Thin Solid Film, 455 – 456 272;
Cabrera, N.; Mott, N. F (1948), Theory of the Oxidation of Metals. Reports on Progress in
Physics, 12, 163–184
Calamea, F.; Muralt, P. (2007), Growth and properties of gradient free sol-gel lead zirconate
titanate thin films. Applied Physics Letters, 90, 062907
Callard, S.; Gagnaire, A.; Joseph, J. (1998), Characterization of graded refractive index silicon
oxynitride thin films by spectroscopic ellipsometry. Thin Solid Films, 313-314, 384
Chang, W.L.; He, J.L. (2005), Comparison of the microstructures and ferroelectric
characteristics of sputter deposited PZT films with and without lead or lead oxide
for compensation. Ceramics International, 31, 461–468
Corkovic, S.; Whatmore, R. W.; Zhang, Q. (2008), Development of residual stress in sol-gel
derived Pb(Zr,Ti)O
3
films: An experimental study. Journal Applied Physics, 103,
084101
Deineka, A. M.; Glinchuk, D.; Jastrabik, L.; Suchaneck, G.; Gerlach, G. (January, 2001),
Nondestructive investigations of the depth profile of PZT ferroelectric films.
Ferroelectrics 264, 151
Deineka, A.; Glinchuk, M. D.; Jastrabik, L.; Suchaneck, G.; Gerlach, G. (2001), Ellipsometry
investigation of perovskite/pyrochlore PZT thin film stacks. Ferroelectrics 258, 271
Deineka, A.; Glinchuk, M.; Jastrabik, L.; Suchaneck, G.; Gerlach, G. (2001), Ellipsometric
Investigations of the Refractive Index Depth Profile in PZT Thin Films. Physica
Status Solidi A, 188, 1549
Deineka, A.; Jastrabik, L.; Suchaneck, G.; Gerlach, G. (1999), Optical Properties of Self-
Polarized PZT Ferroelectric Films. Ferroelectrics, 273, 155
-160
Dejneka, A.; Aulika, I.; Makarova, M. V.; Hubicka, Z.; Churpita, A.; Chvostova, D.; Jastrabik,
L.; Trepakov, V. A. (2010), Optical Spectra and Direct Optical Transitions in
Amorphous and Crystalline ZnO Thin Films and Powders. Journal of Electrochemical
Society, 157, G67
Dejneka, A.; Aulika, I.; Trepakov, V.; Krepelka, J.; Jastrabik, L.; Hubicka, Z.; Lynnyk, A.;
(2009), Spectroscopic ellipsometry applied to phase transitions in solids:
possibilities and limitations. Optics Express, 3 14322
Etin, A.; Shter, G. E.; Baltianski, S.; Grader, G. S.; Reisner, G. M. (2006), Controlled Elemental
Depth Profile in Sol–Gel-Derived PZT Films, Journal of American Ceramic Society, 89,
2387–2393
Compositional and Optical Gradient in Films of PbZr
x
Ti
1-x
O
3
(PZT) Family
599
Fried, M.; Petrik, P.; Lohner, T.; Khánh, N. Q.; Polgár O.; Gyulai, J. (2004), Dose-dependence
of ion implantation-caused damage in silicon measured by ellipsometry and
backscattering spectrometry. Thin Solid Films 455-456, 404
Gibbons, B.J.; Trolier-McKinstry, S. (1999), The sensitivity limits of spectroscopic
ellipsometry to oxygen content in YBa2Cu3O7-d thin films. Thin Solid Films 352, 205
Gkotsis, P.; Kirby, P.B.; Saharil, F.; Oberhammer, J.; Stemme, G. (2007), Thin film crystal
growth template removal: Application to stress reduction in lead zirconate titanate
microstructures. Applied Physics Letters, 91, 163504
Glinchuk, M. D.; Eliseev, E. A.; Deineka, A.; Jastrabik, L. (2000), Optical refraction index and
electric polarization profile of ferroelectric thin film. Fine mechanics and optics, 45,
338-342
Glinchuk, M. D.; Eliseeva, E.A.; Stephanovich, V.A. (2002), The depolarization field effect on
the thin ferroelectric films properties. Physica B, 322, 356–370
Guenther, M.; Gerlach, G.; Suchaneck, G.; Sahre, K.; Eichhorn, K J.; Wolf, B.; Deineka, A.;
Jastrabik, L. (2002), Ion-beam induced chemical and structural modification in
polymers. Surface and Coatings Technology, 158-159, 108
Gusmano, G.; Bianco, A.; Viticoli, M.; Kaciulis, S.; Mattogno, G.; Pandolfi, L., (2002), Study of
Zr
1−x
Sn
x
TiO
4
thin films prepared by a polymeric precursor route. Surface and
Interface Analysis, 34, 690–693
Impey, S. A.; Huang, Z.; Patel, A.; Beanland, R.; Shorrocks, N. M.; Watton, R.; Whatmore, R.
W. (1998), Microstructural characterization of sol-gel lead-zirconate-titanate thin
films. Journal of Applied Physics, 83, 2202
Izyumskaya, N.; Alivov, Y I.; Cho, S J.; Morkoc, H.; Lee, H.; Kang, Y S. (2007), Processing,
Structure, Properties, and Applications of PZT Thin Films. Critical Reviews in Solid
State and Materials Sciences, 32, 111-202
Jellison, G. E.; Modine, F. A. (1996), Parameterization of the optical functions of amorphous
materials in the interband region. Applied Physics Letters, 69, 371
Jellison, G. E.; Modine, F. A.; Boatner, L. A. (1997), Measurement of the optical functions of
uniaxial materials by two-modulator generalized ellipsometry: rutile (TiO
2
), Optics
Letters, 22
, 1808
Kamp, D. A.; DeVilbiss, A. D.; Philpy, S. C.; Derbenwick, G. F. (2004), Adaptable
ferroelectric memories for space applications. IEEE, Non-Volatile Memory
Technology Symposium 2004, 10.1109/NVMT.2004.1380832
Lappalainen, J.; Hiltunen, J.; Lantto, V. (2005), Characterization of optical properties of
nanocrystalline doped PZT thin films. Journal of European Ceramic Society, 25, 2273
Ledermann, N. ; Muralt, P. ; Baborowski, J.; Gentil, S.; Mukati, K.; Cantoni, M.; Seifert, A.;
Setter, N. (2003), {1 0 0}-Textured, piezoelectric Pb(Zr
x
, Ti
1−x
)O
3
thin films for
MEMS: integration, deposition and properties. Sensors and Actuators A, 105, 162–170
Losurdo, M. (2004), Relationships among surface processing at the nanometer scale,
nanostructure and optical properties of thin oxide films. Thin Solid Films, 455-456,
301
Marcus, R. K.; Schwartz, R. W. (2000), Compositional profiling of solution-deposited lead
zirconate–titanate thin films by radio-frequency glow discharge atomic emission
spectroscopy (rf-GD-AES), Chemical Physics Letters, 318, 481–487
Martin, M. (2003), Materials in thermodynamic potential gradients. Journal of Chemical
Thermodynamics, 8, 1291–1308.
Ferroelectrics – Physical Effects
600
Morita, T.; Kanda, T.; Yamagata, Y.; Kurosawa, M.; Higuchi, T. (1997), Single process to
deposit lead zirconate titanate (PZT) thin film by a hydrothermal method. Japanese
Journal of Applied Physics, 36, 2998
Morozovskaa, A. N.; Eliseevb, E. A.; Glinchuk, M. D. (2007), Size effects and depolarization
field influence on the phase diagrams of cylindrical ferroelectric nanoparticles.
Physica B, 387, 358–366
Morton, D. E.; Johs B.; Hale, J. (2002), Soc. of Vac. Coat. 505/856-7188, 45th Ann. Techn. Conf.
Proc. ISSN 0737-5921, 1
Muralt, P. (2000), Ferroelectric thin films for micro-sensors and actuators: A review.
IOPscience:: Journal of Micromechanics and Microengineering, 10, 136-146
Nguyen Van, V.; Brunet-Bruneau, A.; Fisson, S.; Frigerio, J. M.; Vuye, G.; Wang, Y.; Abelνs,
F.; Rivory, J.; Berger, M.; Chaton, P. (1996), Determination of refractive-index
profiles by a combination of visible and infrared ellipsometry measurements.
Applied Optics, 35, 5540
Nishizawa, H.; Tateyama, Y.; Saitoh, T. (2004), Ellipsometry characterization of oxidized
copper layers for chemical mechanical polishing process. Thin Solid Films, 455-456,
491
Ohba, Y.; Arita, K.; Tsurumi, T.; Daimon, M. (1994), Analysis of interfacial phase between
substrates and lead zirconate titanate thin films synthesized by hydrothermal
method. Japanese Journal of Applied Physics, 33, 5305
Okamura, S.; Miyata, S.; Mizutani, Y.; Nishida, T.; Shiosaki, T. (1999), Conspicuous voltage
shift of D–E hysteresis loop and asymmetric depolarization in Pb-based
ferroelectric thin films. Japanese Journal of Applied Physics, 38, 5364–5367
Okamura, S.; Miyata, S.; Mizutani, Y.; Nishida, T; Shiosaki, T. (1999), Conspicuous voltage
shift of D–E hysteresis loop and asymmetric depolarization in Pb-based
ferroelectric thin films. Japanese Journal of Applied Physics, 38, 5364–5367
Oulette, M. F.; Lang, R. V; Yan, K. L.; Bertram, R. W.; Owle, R. S.; Vincent, D. (1991),
Experimental studies of inhomogeneous coatings for optical applications. Journal of
Vacuum Science and Technology A, 9, 1188- 1192
Parish, C. M.; Brennecka, G. L.; Tuttle, B. A.; Brewer, L. N. (2008), Quantitative X-Ray
Spectrum Imaging of Lead Lanthanum Zirconate Titanate PLZT Thin-Films. Journal
of American Ceramic Society
, 91, 3690
Philpy, S. C.; Kamp D. A.; Derbenwick G. F. (2003), Hardened By Design Ferroelectric
Memories for Space Applications,” Non-Volatile Memory Technology Symposium
2003, San Diego, California
Reaney, I. M.; Taylor, D. V.; Brooks, K. G. (1998), Ferroelectric PZT thin films by sol-gel
deposition. Journal of Sol-Gel Science and Technology, 13, 813
Rivory, J. (1998), Characterization of inhomogeneous dielectric films by spectroscopic
ellipsometry. Thin Solid Films, 313-314, 333
Snyder, P.G.; Xiong, Y M.; Woollam, J.A.; Al-Jumaily G.A.; Gagliardi, F.J. (1992), Graded
refractive index silicon oxynitride thin film characterized by spectroscopic
ellipsometry. Journal of Vacuum Science and Technology A, 10, 1462
Sternberg, A.; Krumins, A.; Kundzins, K.; Zauls, V.; Aulika, I.; Cakare, L.; Bittner, R.; Weber,
H.; Humer, K.; Lesnyh, D.; Kulikov D.; Trushin, Y. (2003), Irradiation effects in lead
zirconate thin films. Proceedings of SPIE, 5122, 341
Compositional and Optical Gradient in Films of PbZr
x
Ti
1-x
O
3
(PZT) Family
601
Suchaneck, G.; Lin, W. -M.; Koehler, R.; Sandner, T.; Gerlach, G.; Krawietz, R.; Pompe, W.;
Deineka, A.; Jastrabik, L. (2002), Characterization of RF-sputtered self-polarized
PZT thin films for IR sensor arrays. Vacuum 66, 473
Sugiyama, O.; Kondo, Y.; Suzuki, H.; Kaneko, S. (2003), XPS Analysis of Lead Zirconate
Titanate Thin Films Prepared Via Sol–Gel Process. Journal of Sol–Gel Science and
Technology, 26, 749–52
Sugiyama, O.; Murakami, K.; Kaneko, S. (2004), XPS Analysis of Surface Layer of Sol–Gel-
Derived PZT Thin Films, Journal of European Ceramic Society, 24, 1157–1160
Synowicki, A. (1998), Spectroscopic ellipsometry characterization of indium tin oxide film
microstructure and optical constants. Thin Solid Film, 313 – 314, 394
Synowicki, R.A.; Tiwald, T. E. (2004), Optical properties of bulk c-ZrO
2
, c-MgO and a-As
2
S
3
determined by variable angle spectroscopic ellipsometry.Thin Solid Film, 455 – 456,
248
Tang, X. G.; Liu, Q. X.; Jiang L. L.; Ding, A.L. (2007), Optical properties of Pb(Zr
x
Ti
1-x
)O
3
(x=
0.4, 0.6) thin films on Pt-coated Si substrates studied by spectroscopic ellipsometry.
Materials Chemistry and Physics, 103, 329
Tilley, D.R. (Gordon and Breach, Amsterdam, 1996), Ferroelectric Thin Films
Tompkins, H. G. Irene, E. A. (NY 2005), Handbook of ellipsometry
Trolier-McKinstry, S.; Koh, J. (1998), Composition profiling of graded dielectric function
materials by spectroscopic ellipsometry. Thin Solid Films, 313-314, 389
Vidyarthi, V.S.; Lin, W M.; Suchaneck, G.; Gerlach, G.; Thiele, C.; Hoffmann, V. (2007),
Plasma emission controlled multi-target reactive sputtering for in-situ crystallized
Pb(Zr,Ti)O
3
thin films on 6″ Si-wafers, Thin Solid Films, 515, 3547–3553
Wagner, C. (1971), Contribution to the thermodynamics of interstitial solid solutions. Acta
Metallurgica, 19, 843-849
Wang, C. C.; Akbar, S. A. (1992), Decomposition of YBa
2
Cu
3
O
x
under an oxygen potential
gradient using a YSZ-based galvanic cell. Material Letters, 13, 254–260
Wang, X.; Masumoto, H.; Someno, Y.; Chen, L.; Hirai., T. (2001), Stepwise graded refractive-
index profiles for design of a narrow-bandpass filter. Applied Optics, 40, 3746
Wang, Y.G.; Zhong, W.L.; Zhang, P.L. (1995), Surface and size effects on ferroelectric films
with domain structures. Physical Review B, 51, 5311
Watts, B. E.; Leccabue, F.; Fanciulli, M.; Ferrari, S.; Tallarida, G.; Parisoli, D. (2001), The
influence of low temperature baking on the properties of SrBi
2
Ta
2
O
9
films from
metallorganic solutions. Integrated Ferroelectrics, 37, 565–574.
Watts, B. E.; Leccabue, F.; Fanciulli, M.; Tallarida, G.; Ferrari, S. (2003), Surface segregation
mechanisms in ferroelectric thin films. Journal of Electroceramics, 11, 139–147
Watts, B.E.; Leccabue, F.; Bocelli, G.; Padeletti, G.; Kaciulis, S.; Pandolfi, L. (2005), Lead
enrichment at the surface of lead zirconate titanate thin films, Journal of the European
Ceramic Society, 25, 2495–2498
Whatmore, R.W.; Zhang, Q.; Huang, Z.; Dorey, R.A. (2003), Ferroelectric thin and thick films
for microsystems. Materials Science in Semiconductor Processing, 5, 65-76
Xi, J Q.; Schubert, M. F.; Kim, J. K.; Schubert, E. F.; Chen, M.; Lin, S Y.; Liu, W. ; Smart, J. A.
(2007), Optical thin-film materials with low refractive index for broadband
elimination of Fresnel reflection. NaturePhotonics, 1, 176
Ferroelectrics – Physical Effects
602
Yang, S.; Zhang Y.; Mo, D. (2006), A comparison of the optical properties of amorphous and
polycrystalline PZT thin films deposited by the sol–gel method. Materials Science
and Engineering B, 127, 117
Yee, Y.; Nam, H J.; Lee, S H.; Uk Bu, J.; Lee, J W. (2001), PZT actuated micromirror for
fine-tracking mechanism of high-density optical data storage. Sensors and Actuators
A, 89, 166-173
26
Photo-induced Effect in Quantum
Paraelectric Materials Studied by
Transient Birefringence Measurement
Toshiro Kohmoto and Yuka Koyama
Graduate School of Science, Kobe University,
Japan
1. Introduction
Strontium titanate SrTiO
3
is known as a quantum paraelectric material, and its lattice
dynamics and unusual dielectric character have been studied extensively. The cubic (O
h
)
structure above the structural phase transition temperature (T
C
= 105 K) changes into the
tetragonal (D
4h
) structure below T
C
. At low temperatures, dielectric constant increases up to
about 3x10
4
, where the paraelectric phase is stabilized by quantum fluctuations even below
the classical Curie temperature 37 K (Muller & Burkard, 1979).
Photo-induced effect in dielectric materials is an attractive topic. Some kind of ferroelectric
materials such as SbSI (Ueda et al., 1967) and BaTiO
3
(Volk et al., 1973; Godefroy et al., 1976)
are known to show photo-induced effects. In this decade, much interest has been paid on
the giant enhancement in dielectric constants under ultraviolet (UV) illumination and DC
electric field in quantum paraelectrics, strontium titanate SrTiO
3
and potassium tantalate
KTaO
3
(Takesada et al., 2003; Hasegawa et al., 2003; Katayama et al., 2003), because weak
light illumination gives rise to an intense response in dielectricity.
The two models shown Fig. 1, the ferroelectric cluster model (Takesada et al., 2003;
Hasegawa et al., 2003; Katayama et al., 2003) and the conductive-region model (Homes et al.,
2001; Katayama et al., 2003), have been proposed to explain the origin of the giant dielectric
constants. At present, however, it is still not clear which model is better. In the ferroelectric
cluster model, the photo-induced ferroelectric region has a huge dipole moment, where it is
expected that a photo-induced polar domain generates spatial lattice distortion. In the
conductive-region model, on the other hand, the superposition of insulative and photo-
induced conductive regions, which is characterized by the boundaries between the two
regions, makes the apparent dielectric constants to be enormous.
Giant dielectric response has been observed in some types of nonferroelectric materials
(Homes et al., 2001; Wu et al., 2002; Dwivedi et al., 2010). The enormous increase in
dielectric constants is attributed to the formation of barrier layer capacitors and the resultant
Maxwell-Wagner polarization or interfacial polarization. This giant dielectric response often
occurs in materials with grains surrounded by the insulating grain boundary and is
explained by the conductive-region model.
According to the measurement of dielectric constants, a doped crystal Sr
1-x
Ca
x
TiO
3
undergoes a ferroelectric transition above the critical Ca concentration x
c
= 0.0018 (Bednorz
Ferroelectrics – Physical Effects
604
& Muller, 1984; Bianchi et al., 1994). Doped Ca ions are substituted for the Sr ions. The cubic
structure above the structural phase transition temperature (T
C1
) changes into the tetragonal
structure below T
C1
and into the rombohedral structure below the ferroelectric transition
temperature T
C2
. Off-centered impurity ions, which are assumed in the case of impurity
systems such as Li-doped KTiO
3
and Nb-doped KTiO
3
(Vugmeister & Glinchuk, 1990), are
supposed also in the case of Ca-doped SrTiO
3
. Their polarized dipole moments show a
ferroelectric instability below the ferroelectric transition temperature. In the case of Ca-
doped SrTiO
3
, a spontaneous polarization occurs along [110]
directions within the c plane,
where the tetragonal (D
4h
) symmetry is lowered to C
2v
.
Fig. 1. Schematic pictures of (a) ferroelectric cluster model and (b) conductive-region model.
In Ca-doped SrTiO
3
, a UV illumination causes a shift of the ferroelectric phase transition
temperature toward the lower side (Yamada & Tanaka, 2008). The T
C2
reduction under the
UV illumination is considered to be caused by disequilibrium carriers which are captured by
traps and screen the polarization field.
In the present study, we performed three types of experiment in pure and Ca-doped SrTiO
3
;
(i) stationary birefringence measurement in UV light and DC electric fields, (ii) transient
birefringence measurement in UV light and pulsed electric fields, and (iii) transient
absorption and birefringence measurements after the optical pulse excitation using the
pump-probe technique. The photo-induced dynamics of the lattice distortion, the dielectric
polarization, and the relaxed excited state in SrTiO
3
is studied in comparison with the lattice
distortion in the doping-induced ferroelectric phase of Ca-doped SrTiO
3
. We discuss which
model explains the experimental results better.
The experiments are performed on single crystals of pure and Ca-doped SrTiO
3
with the Ca
concentration of x = 0.011. SrTiO
3
was obtained commercially and Ca-doped SrTiO
3
was
grown by the floating zone method. The thickness of the samples is 0.2 mm. The structural
phase-transition temperature, T
C1
=180K, of the Ca-doped SrTiO
3
was obtained from the
temperature dependence of the birefringence (Koyama et al., 2010), and the ferroelectric
phase-transition temperature, T
C2
= 28K, was determined by the measurement of dielectric
constants (Yamada & Tanaka, 2008).
2. Lattice distortion in the UV and DC fields in Ca-doped SrTiO
3
The stationary birefringence is studied to investigate the static properties of the lattice
distortion generated by the UV illumination in comparison with that generated by the
ferroelectric deformation.
Photo-induced Effect in Quantum Paraelectric
Materials Studied byTransient Birefringence Measurement
605
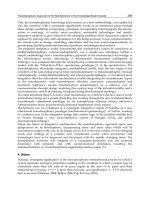
2.1 Birefringence measurement in the UV light and DC electric fields
The schematic diagram of the birefringence measurement in the UV light and DC electric
fields is shown in Fig. 2. The change in birefringence is detected as the change in the
polarization of a linearly polarized probe light provided by a Nd:YAG laser (532 nm). The
source of UV illumination is provided by the second harmonics (380 nm, 3.3 eV) of the
output from a mode-locked Ti-sapphire laser, whose energy is larger than the optical band
gap of SrTiO
3
(3.2 eV). The intensity of UV illumination is 1.6 mW/mm
2
. Since the repetition
rate of the UV pulses is 80 MHz, this UV illumination can be considered to be continuous in
the present experiment. The UV beam is illuminated on the gap between two Au electrodes.
The electrodes with a gap of 0.8 mm are deposited on a (100) surface of the samples by
spattering. A DC electric field, whose amplitude is 375 V/mm, is applied between the two
electrodes. The DC electric field is applied parallel to [100] direction of the crystal.
Fig. 2. Schematic diagram of the birefringence measurement in the UV light and DC electric
fields.
The change in the polarization of the probe light is detected by a polarimeter. The
construction of the polarimeter is shown in Fig. 3. The polarimeter (Kohmoto et al., 2000;
Jones, 1976) detects the rotation of polarization plane of a light beam. A linearly-polarized
beam is split by a polarized beam splitter (PBS) and incident on the two photodiodes (PD)
whose photocurrents are subtracted at a resistor (R). When the polarized beam splitter is
mounted at an angle of 45
o
to the plane of polarization of the light beam, the two
photocurrents cancel. If the plane of polarization rotates, the two currents do not cancel and
the voltage appears at the resistor.
In the present experiment, the birefringence generated by the lattice deformation is detected
as the change in polarization of the probe beam using a quarterwave plate and a
polarimeter. The birefringence generated in the sample changes the linear polarization
before transmission to an elliptical polarization after transmission. The linearly-polarized
probe beam is considered to be a superposition of two circularly-polarized components
which have the opposite polarizations and the same intensities. The generated birefringence
destroys the intensity balance between the two components. The two circularly-polarized
beams are transformed by the quaterwave plate to two linearly-polarized beams whose
polarizations are crossed each other, and the unbalance of circular polarization is
Ferroelectrics – Physical Effects
606
transformed to the unbalance of linear polarization or the rotation of polarization plane.
This rotation is detected by the polarimeter as the signal of the lattice deformation.
Fig. 3. Construction of the polarimeter.
2.2 UV intensity dependence of the birefringence
The ultraviolet intensity dependence of the change in birefringence in Ca-doped SrTiO
3
is
shown in Fig. 4, where the temperature is 6 K and the polarization plane of the probe light is
along the [110] and [100] axes, with which the lattice distortion along the [100] and [110]
axes are detected, respectively. The birefringence increases nonlinearly as the UV intensity is
increased. As is shown in Fig. 4(a), the change in birefringence appears at very weak UV
intensity in the polarization plane only along the [110] axis, rises rapidly, and holds almost a
constant value above 0.5 mW/mm
2
. Figure 4(b), where the horizontal axis is in a logarithmic
scale, indicates that the structural deformation begins at the UV intensity of 10
-3
mW/mm
2
.
The change in birefringence for the probe polarization along the [110] axis is much larger
than that along the [100] axis. These facts imply that the UV illumination causes Ca-doped
SrTiO
3
to undergo a first-order-like structural deformation and generates a lattice distortion
along the [100] axis as a result of the competition between the UV-induced and ferroelectric
deformations, and its threshold value is very small.
Figure 5 schematically shows the direction of the local lattice distortion in pure and Ca-
doped SrTiO
3
. The observed direction of the lattice distortion in Ca-doped SrTiO
3
generated
by the UV illumination is the same as that in the case of pure SrTiO
3
(Nasu, 2003).
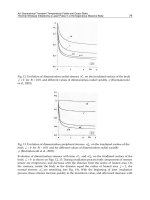
2.3 Temperature dependence of the birefringence in the UV and DC fields
We investigated the temperature dependence of the change in birefringence for Ca-doped
SrTiO
3
in the combination of two external fields, UV light (UV) and DC electric (DC) fields.
The experimental result is shown in Fig. 6 where the polarization plane of the probe light is
along the [110] and [100] axes. The sample is in the four types of fields; neither UV nor DC
(no field), only DC (DC), only UV (UV), and both UV and DC (UV+DC). The changes in
birefringence for the probe polarization along the [110] axis are much larger than those
along the [100] axis. This means that the optical anisotropy is generated along the [100] axis.
For the probe polarization along the [110] axis without the DC electric field, the change in
birefringence for no field is similar to that for UV, as is seen in Fig. 6, while under the DC
1
Photo-induced Effect in Quantum Paraelectric
Materials Studied byTransient Birefringence Measurement
607
Fig. 4. UV intensity dependence of the change Δn in birefringence in Ca-doped SrTiO
3
at 6 K,
where the probe-light polarization is along the [110] and [100] axes. The horizontal axis is (a)
in a linear scale and (b) in a logarithmic scale.
Fig. 5. Direction of the local lattice distortion (a) in SrTiO
3
and (b) in Ca-doped SrTiO
3
. The
direction of local lattice distortion generated by the UV illumination is axial along the [100]
axis both for pure and Ca-doped SrTiO
3
. The direction of the local lattice distortion in the
ferroelectric phase of Ca-doped SrTiO
3
is diagonal along the [110] axis.
Ferroelectrics – Physical Effects
608
Fig. 6. Temperature dependence of the change in birefringence for Ca-doped SrTiO
3
in the
combination of two external fields, UV light (UV) and DC electric (DC) fields, where the
polarization plane of the probe light is along the [110] and [100] axes. The sample is in the
four types of fields; neither UV nor DC (no field), only DC (DC), only UV (UV), and both
UV and DC (UV+DC).
electric field the change for DC is different from that for UV+DC. The difference arises from
that of the macroscopic optical anisotropy generated along the [100] axis by the UV
illumination.
In the ferroelectric phase of Ca-doped SrTiO
3
, the direction of the local lattice distortion is
diagonal along the [110] axis (Bednorz & Muller, 1984) as shown in Fig. 5(b). There are six
equivalent diagonal sites where the distortion directions are [110], [1-10], [011], [01-1], [101],
and [10-1]. In no field, it is expected that the six local sites distribute randomly as shown in
Fig. 7(a), and no optical anisotropy is generated. The observed birefringence change Δn
NO
for no field, however, shows that the optical anisotropy grows along the [100] axis at low
temperatures. This may be because that the domain structure due to the structural phase
transition violates the equivalency among the six sites.
In the DC electric field along the [100] axis, on the other hand, the six local diagonal sites in
the ferroelectric phase are not equivalent as shown in Fig. 7(b). The two diagonal sites, [011]
and [01-1] which are perpendicular to the [100] axis, are more unstable in the DC elected
field along the [100] axis than the other four diagonal sites, [110], [1-10], [101], and [10-1].
The random distribution of the four diagonal sites generate a macroscopic optical
anisotropy along the [100] axis. This explains the observed large increase of the
birefringence change Δn
DC
for the [110] probe and small change for the [100] probe.
Photo-induced Effect in Quantum Paraelectric
Materials Studied byTransient Birefringence Measurement
609
As discussed in section 2.2, the lattice distortion generated by the UV illumination is axial
along the [100] axis. In no DC electric field, its direction distributes randomly among the three
equivalent directions, [100], [010], and [001] as shown in Fig. 7(c), where no macroscopic
optical anisotropy is expected. The observed similar behavior between the birefringence
changes Δn
NO
for no field and Δn
UV
for UV can be explained by the fact that the UV
illumination changes the local distortion but does not add any macroscopic optical anisotropy.
Fig. 7. Directions of the local lattice distortion in the ferroelectric phase of Ca-doped SrTiO
3
.
(a) In no field, the six equivalent diagonal sites distribute randomly. (b) In the DC electric
field along the [100] axis , the two diagonal sites perpendicular to the [100] axis are more
unstable than the other four diagonal sites. (c) The three equivalent axial sites generated by
the UV illumination distribute randomly in no DC electric field. (d) In the DC electric field,
the two UV-generated axial sites perpendicular to the DC field direction are more unstable
than the parallel UV-generated axial site. Macroscopic optical anisotropies are expected to
be generated in the DC electric field (b) for DC and (d) for UV+DC, but are not expected (a)
for no field and (c) for UV.
In the DC electric field along the [100] axis, the three axial sites generated by the UV
illumination are not equivalent as shown in Fig. 7(d). The two axial sites [010] and [001],
which are perpendicular to the [100] axis, are more unstable than the other axial site [100].
This axial site can also contribute to generate a macroscopic optical anisotropy along the
[100] axis. The UV illumination changes some part of the local distortion from the diagonal
site along the [110] axis to the axial site along the [100] axis. The UV illumination decreases
the birefringence change in the DC electric field; Δn
UV+DC
<Δn
DC
, as is seen in Fig. 6. This
result suggests that the sign of the optical anisotropy generated by the UV illumination is
opposite to that by the diagonal distortion in the ferroelectric phase. It should be noted that
the optical anisotropy due to the structural deformation generated by the UV illumination is
of the same order of magnitude as that generated by the ferroelectric deformation.
Ferroelectrics – Physical Effects
610
3. Lattice distortion in the UV and pulsed electric fields in pure and
Ca-doped SrTiO
3
3.1 Transient birefringence measurement in the UV light and pulsed electric fields
The transient birefringence in a pulsed electric field is studied to probe whether or not the
lattice distortion generated by the UV illumination is affected by the electric field. In the
experiment of transient birefringence, the change in birefringence is monitored by the probe
light of 532 nm from the Nd:YAG laser, and its time evolution is obtained from the
waveform digitized on an oscilloscope. A pulsed electric field, whose amplitude is 150
V/mm and pulse width is 1.2 ms, is applied between the two Au electrodes.
3.2 Transient birefringence in SrTiO
3
Figure 8(a) shows the change Δn(t) in birefringence in pure SrTiO
3
after the application of
the electric-field pulse at t = 0 between 4.5 K and 50 K, where the UV illumination is off and
the polarization plane of the probe light is along the [110] axis. The signal of the
birefringence change rises rapidly at the start of the electric–field pulse and holds a constant
value during the pulse. As the temperature is decreased, the birefringence change induced
by the electric-field pulse is increased. This means that the polarization, which is related to
the dielectric constants, is increased at lower temperatures.
Fig. 8. Temperature dependence of the transient birefringence signal Δn(t) in SrTiO
3
in a
pulsed electric field under the (a) dark and (b) UV illumination. The polarization plane of
the probe light is along the [110] axis. The electric field of 150 V/mm is turned on at t = 0.
Photo-induced Effect in Quantum Paraelectric
Materials Studied byTransient Birefringence Measurement
611
Figure 8(b) shows the change in birefringence in SrTiO
3
under the UV illumination. The
dielectric response of relaxation type is observed at all temperatures. As the temperature is
decreased, the relaxation rate becomes increased.
3.3 Transient birefringence in Ca-doped SrTiO
3
The change Δn(t) in birefringence in Ca-doped SrTiO
3
is shown in Fig. 9(a), where some
oscillating components appear. As the temperature is decreased, the amplitudes of these
oscillating components are increased. These oscillations are considered to be caused by the
doped Ca ions because they are not observed in pure SrTiO
3
but only in Ca-doped SrTiO
3
.
The change in birefringence induced by the electric-field pulse is increased as the
temperature is decreased, as well as in SrTiO
3
, which means that the dielectric polarization
is increased at low temperatures. Figure 9(b) shows the change in birefringence in Ca-doped
SrTiO
3
under the UV illumination. In Ca-doped SrTiO
3
, the dielectric response of relaxation
type appears only above the ferroelectric phase transition temperature T
c2
, and the
oscillating components also disappear above T
c2
.
Fig. 9. Temperature dependence of the transient birefringence signal Δn(t) in Ca-SrTiO
3
in a pulsed electric field under the (a) dark and (b) UV illumination. The polarization
plane of the probe light is along the [110] axis. The electric field of 150 V/mm is turned on
at t = 0.
Ferroelectrics – Physical Effects
612
3.4 Temperature dependence of the transient birefringence amplitude
The temperature dependences of the transient birefringence amplitude Δn
S
for pure and Ca-
doped SrTiO
3
are shown in Fig. 10, where Δn
S
is obtained from the value of Δn(t) at large
enough time t in Figs. 8 and 9.
Fig. 10. Temperature dependence of the transient birefringence amplitude Δn
S
induced by
the electric-field pulse under the dark and UV illumination (a) in SrTiO
3
and (b) in Ca-
doped SrTiO
3
.
For both samples, it is clear that the transient birefringence amplitude for the probe
polarization along the [110] axis is reduced by the UV illumination, which indicates that the
lattice deformation is reduced by the UV illumination and that the lattice distortion
generated by the UV illumination is not affected by the electric field. This result is not
consistent with the ferroelectric cluster model, where a large change in birefringence is
expected in the pulsed electric field.
In Ca-doped SrTiO
3
, judging from the rising temperature of the transient birefringence
amplitude, the ferroelectric phase transition temperature is shifted toward the lower
temperature side under the UV illumination. This is consistent with the dielectric
measurement (Yamada & Tanaka, 2008) and the coherent phonon experiment (Koyama et
al., 2010). The doped Ca ions behave as permanent dipoles, and ferroelectric clusters are
formed around the Ca dipoles with the high polarizability of the host crystal. The
ferroelectric transition is caused by the ordering of the randomly distributed Ca dipoles. The
ordering is prevented by the photo-excited carriers generated by the UV illumination.
4. Dynamics of the relaxed excited state after the optical pulse
excitation in SrTiO
3
Figure 11 illustrates the electronic states in SrTiO
3
. The UV illumination, whose photon energy
is larger than the band-gap energy of SrTiO
3
(3.2 eV), excites the electrons from the ground
Photo-induced Effect in Quantum Paraelectric
Materials Studied byTransient Birefringence Measurement
613
state to the excited state. The excited electrons are self-trapped in the relaxed excited state
where the optically induced lattice distortion is created (Nasu, 2003). In the relaxed excited
state, a broad absorption band appears (Hasegawa & Tanaka, 2001; Okamura et al., 2006).
Fig. 11. Schematic diagram of the electronic states in SrTiO
3
.
Figure 12 shows the emission spectra observed under two types of optical excitation; the pulse
excitation of 790 nm and the UV illumination of 380 nm. As is seen, the two spectra are almost
the same as each other. This result indicates that the same relaxed excited state is generated by
the pulse excitation through a multi-photon absorption process. We observed the dynamics of
the optically induced lattice distortion in the relaxed excited state generated by ultrashort
pump pulses. The transient absorption and birefringence after the optical pulse excitation,
which is originated in the generation of the relaxed excited state, is studied by the pump-probe
technique to investigate the dynamical properties of the optically induced lattice distortion.
Fig. 12. Emission spectra observed (a) for the pulse excitation of 790 nm and (b) for the UV
illumination of 380 nm.