Environmental Monitoring Part 16 docx
Bạn đang xem bản rút gọn của tài liệu. Xem và tải ngay bản đầy đủ của tài liệu tại đây (2.71 MB, 13 trang )
Environmental Monitoring
516
constant, but more by qualitative expressions such as ‘immediately’ or ‘ad-hoc’, i.e.
information layers have to be created in a timely manner to serve application-specific
purposes. (Resch et al., 2009b)
3.1 Design principles
In the conception of our technical infrastructure we accounted for different design principles
(Service Oriented Architectures – SOA, modular software infrastructures etc.) to ensure
flexibility, reusability and portability of the components and the overall infrastructure.
Figure 1 shows the modular architecture and the standardised service interfaces that are
used to connect the different components in the workflow.
Fig. 1. Common Scents – Modular Standardised Infrastructure
According to principles of SOA and sustainable infrastructure development, we conceived
data collection, processing and information provision architecture, which covers the whole
process chain from sensor network development via measurement integration, data analysis
and information visualisation, as shown in Figure 1. Thus, our approach builds the
architectural bridge between domain-independent sensor network development and use
case specific requirements for end user tailored information output for environmental
monitoring purposes.
3.2 Standardised measurement infrastructure
The modules of the workflow shown in Figure 1 are separated by several interfaces, which
are defined using open standards. The first central group of standards is subsumed under
the term Sensor Web Enablement (SWE), an initiative by the OGC that aims to make sensors
discoverable, query-able, and controllable over the Internet (Botts et al., 2007). Currently, the
SWE family consists of seven standards comprising data models and service interfaces:
Standardised Geo-Sensor Webs for Integrated Urban Air Quality Monitoring
517
Sensor Model Language (SensorML) – This standard provides an XML schema for
defining the geometric, dynamic and observational characteristics of a sensor. Thus,
SensorML assists in the discovery of different types of sensors, and supports the
processing and analysis of the retrieved data, as well as the geo-location and tasking of
sensors.
Observations & Measurements (O&M) – O&M provides a description of sensor
observations in the form of general models and XML encodings. This framework labels
several terms for the measurements themselves as well as for the relationship between
them. Measurement results are expressed as quantities, categories, temporal or
geometrical values as well as arrays or composites of these.
Transducer Model Language (TML) – Generally speaking, TML can be understood as
O&M’s pendant or streaming data by providing a method and message format
describing how to interpret raw transducer data.
Sensor Observation Service (SOS) – SOS provides a standardised web service interface
allowing access to sensor observations and platform descriptions.
Sensor Planning Service (SPS) – SPS offers an interface for planning an observation
query. In effect, the service performs a feasibility check during the set up of a request
for data from several sensors.
Sensor Alert Service (SAS) – SAS can be seen as an event-processing engine whose
purpose is to identify pre-defined events such as the particularities of sensor
measurements, and then generate and send alerts in a standardised protocol format.
Web Notification Service (WNS) – The Web Notification Service is responsible for
delivering generated alerts to end-users by E-mail, over HTTP, or via SMS. Moreover,
the standard provides an open interface for services, through which a client may
exchange asynchronous messages with one or more other services.
Sensor Web Registry – The registry serves to maintain metadata about sensors and their
observations. In short, it contains information including sensor location, which
phenomena they measure, and whether they are static or mobile. Currently, the OGC is
pursuing a harmonisation approach to integrate the existing CS-W (Web Catalogue
Service) into SWE by building profiles in ebRIM/ebXML (e-business Registry
Information Model).
The functional connections between the SWE standards are illustrated in Figure 2.
It should be mentioned that the OGC is currently establishing the so-called SWE Common
namespace specification, which aims at grouping elements that are used in more than one
standard of the SWE family. In effect, this will minimise redundancy, and optimise re-
usability and efficiency of the standards. SWE Common will mainly comprise very general
elements such as counts, quantities, time elements or simple generic data representations.
More information on the Sensor Web Enablement initiative, the incorporated standards and
the efforts to embed it into the OGC standard service development can be found on the
OGC web site
1
.
Aside from the SWE standard family, which is used throughout the sensor network process
chain, other OGC standards are employed to build up the overall infrastructure. At first, the
Web Processing Service (WPS) is used for integrating measurement data with thematic
process models in order to generate contextual information layers. WPS (Schut, 2007)
basically allows for the implementation and execution of pre-defined analysis processes
1
Environmental Monitoring
518
with dedicated input and output parameters. It supports synchronous and asynchronous
data processing to enable sophisticated processing of large amounts of vector and raster
data. The WPS standard has been discussed by Resch et al. (2010a) including issues such as
input/output data definition, WPS profiling, asynchronous processing, and others.
Fig. 2. Functional Connections Between the SWE Standards. (adapted from Botts et al., 2006)
The OGC developed a set of service interfaces for standardised data provision and
visualisation dealing with various kinds of GIS data types. The Web Feature Service (WFS),
the Web Map Service (WMS) and the Web Coverage Service (WCS) standards allow for
access to geo-data such as vectors (point, line, polygon), raster images, and coverages
(surface-like structures). More information about these standards and service
implementations can be found on the OGC web site.
The essential benefit of using the OGC processing and data provision services mentioned
above is the wide variety of standardised (GML, KML etc.) and custom output formats
(GeoRSS, PDF etc.). This allows for the integration of the OGC service outputs into other
processing, visualisation or decision support services including legacy COTS and open-
source GIS analysis tools.
3.3 Data source: Geo-sensor web
In the Common Scents project, two pilot studies have been conducted. The first one used the
CitySense sensing network (Murty et al., 2008) as the underlying sensing and data collection
infrastructure. The main goal of the ongoing CitySense project is to build an urban sensor
network to measure environmental parameters and is thus the data source for further data
analysis. The project focuses on the development of a city-wide sensing system using an
optimised network infrastructure. Currently, the network consists of 16 nodes deployed
Standardised Geo-Sensor Webs for Integrated Urban Air Quality Monitoring
519
around the city of Cambridge measuring different environmental parameters such as CO
2
concentrations, air temperature, wind speed and direction, or precipitation. The final
CitySense deployment will comprise up to 100 sensing nodes to build the basis for pervasive
urban monitoring. (Resch et al., 2009b)
Another pilot experiment, which aimed at the deployment of a mobile sensor network, was
conducted in the city of Copenhagen, Denmark. Ten bicycle mounted sensors
2
were used to
collect environmental data (CO, NO
x
, noise, air temperature and relative humidity) together
with time and the geographic location using GPS – from which velocity and acceleration can
be calculated. In this experiment of ubiquitous mobile sensing, we used the Sensaris City
Senspod
3
, a relatively low-cost sensor pod. The deployment in Copenhagen was a combined
effort of the MIT SENSEable City Laboratory, and Københavns Kommune, Denmark.
To comply with the standardised infrastructure described in sub-section 3.1, we
implemented several standardised services on top of these sensor networks, in accordance
with the Live Geography approach (Resch et al., 2009a). For data access, we developed a
Sensor Observation Service (SOS), which supplies measurement data in the standardised
O&M format. It builds the O&M XML structure dynamically according to measured
parameters and filter operations. To generate alerts e.g. in case of exceedance of a threshold,
we implemented an XMPP (Extensible Messaging and Presence Protocol) based Sensor Alert
Service (SAS). It is able to detect patterns and anomalies in the measurement data and
generate alerts and trigger appropriate operations such as sending out an email or a text
message, or to start a pre-defined GIS analysis operation.
3.4 Event-based alerting
Within the workflow described in sub-section 3.1, event recognition and processing happens
in two different stages: 1.) at sensor level, Complex Event Processing (CEP) is used to detect
errors in measurement values by applying different statistical operations such as standard
deviations, spatial and temporal averaging, or outlier detection. Thus, it can be considered a
mechanism for quality control and error prevention. To be able to detect condition changes in
measurement values, we enhanced CEP and Event Stream Processing (ESP) techniques by the
location parameter. Thus, these methods can also serve for the federal organisation of pre-
defined geographical domain violations like geo-fences, and for tracing and analysing spatial
patterns. 2.) after the data harmonisation process, CEP serves for spatio-temporal pattern
recognition, anomaly detection, and alert generation in case of threshold exceedance.
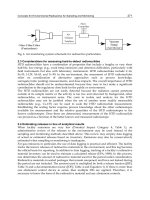
Figure 3 shows the components of the CEP-based event processing component, which is
built up in a modular structure.
Generally speaking, the event processing component serves as a connection between the
data layer (sensor measurements) and the data analysis and data visualisation components,
i.e. it prepares raw data in order to be process-able in the analysis and the visualisation
layers. The first module is the data transportation, which connects different real-time and
non-real-time data sources, i.e. it serves as an entry point into the event processing layer.
Next, the retrieved data is passed on to the data transformation module, which prepares the
data to be further processed. This ‘processing’ shall not be seen as data analysis, but more as
data preparation. Basically, the transportation module converts the byte input stream to
objects.
2
3
Environmental Monitoring
520
Fig. 3. CEP-based Event Processing Component Architecture
These objects can then be used by two higher-level components; firstly, by the data
persistence component, which establishes a static data structure from the source data;
secondly, by an event processing engine, which processes a real-time stream,
identifies/selects events and pushes them to the user-defined processing module. The latter
performs a kind of ‘event filtering’ and sends the resulting message to the service
components.
One particularity, which shall be mentioned at this point, is the connection between the
processing and the data persistence modules. The idea behind this functional link is that
data, which have been prepared by the processing components, can either be pushed to the
service components or they can be temporarily stored to be accessed by OGC services.
The two service-related components in Figure 3 (Web Service and Non-standard Service)
serve as the direct interfaces to the data integration and data analysis layers. They offer the
pre-processed raw data via a defined data structure, e.g. in a standardised output format
such as GML, KML, geoTIFF etc. or in a custom output format.
For the OGC service component, all data are served over well-established open and
standardised interfaces (OGC WFS, WMS and WCS). These XML web interfaces enable
standardised data access and guarantee combinability of the various kinds of used data for
further automated processing, as described in sub-section 3.2. In this way, pre-defined
aggregation services can be implemented in the data analysis layer offering the results to a
range of different users, i.e. platforms.
In addition to the standardised interfaces, also a non-standard service has to be created as
existing OGC services don’t support push mechanisms per se. A longer term option will
be to replace these non-standard interfaces by push-capable standard services. More
detailed information about the event processing component can be found in Resch et al.
(2010b).
Standardised Geo-Sensor Webs for Integrated Urban Air Quality Monitoring
521
3.5 Real-time sensor fusion
We are currently facing a drastic increase in the availability of geospatial real-time data
sources, and this applies especially to rapid developments and price reduction in sensing
technologies. To make use of this immense amount of data within environmental
monitoring systems, real-time data integration mechanisms have to be developed, which
harmonise and fuse the different kinds of data. Furthermore, these data have to be provided
in standardised formats in order to allow interoperability and collaboration between
different institutions and data providers.
Most current data integration systems make use of a temporary database to combine
different kinds of raw data, as stated in section 2. This approach has two distinctive
disadvantages. Firstly, it manifests data into a physical structure and thus severely limits
real-time capabilities. Secondly, the laborious operation of creating and filling a database
table adds another step in the overall workflow, which decreases performance and expands
implementation complexity and costs.
To overcome these shortcomings, we implemented the real-time data integration component
in a custom data store for the open-source server GeoServer. This solution offers two main
advantages: at first, data are fused on-the-fly in a highly dynamic, fast and parallelised
process. At second, GeoServer provides standardised WFS, WMS and WCS outputs, as
described above, which allows for simple integration into analysis and visualisation
software. More about implementation details can be found in Resch et al. (2009a).
4. Results of spatio-temporal data analysis
Using the sensor web deployments described in section 3, we implemented two spatio-
temporal data analysis modules.
The first pilot deployment has been carried out in the course of the Copenhagen Wheel project.
This project was unveiled in Copenhagen on 15 December 2009 as part of 15
th
Conference of
the Parties during the 2009 United Nations Climate Change Conference meeting. The
Copenhagen Wheel is capturing information about carbon monoxide (CO), NO
x
(NO +
NO
2
), noise, ambient temperature, relative humidity in addition to position, velocity and
acceleration.
The environmental sensors were originally intended to be placed within the hub of the
bicycle wheel however due to logistical pressure they were placed on bicycles ridden by
couriers in Copenhagen going about their normal daily routine. Thus the testing was
essentially a proof-of-concept. Ten cycles were instrumented and tested over 2 December
2009. It is believed that this was the first time multiple mobile sensors had been used in the
field with such a large variety of environmental sensors.
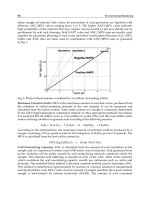
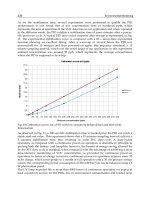
The analysis component, which processes the collected data, performs a spatial Inverse
Distance Weighting (IDW) interpolation (for a comparison with Kriging interpolation, s.
Zimmermann et al., 1999) on temperature measurements, which will be used in further
research efforts for correlation operations with emission distribution or traffic emergence,
and for the detection of urban heat islands.
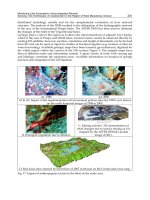
Moreover, the processing module analyses the CO distribution throughout the city of
Copenhagen. The basic CO map containing the GPS traces and the output of the
interpolation process – a navigable 3D map – are shown in Figure 4.
The second geo-processing component uses ArcGIS’s Tracking Analyst tool to perform
spatio-temporal analysis on measurement data over a period of time. In order to achieve a
coarse overview of pollutant variability, we used CO
2
data captured by the CitySense
Environmental Monitoring
522
network in Cambridge. This allows for correlating temporal measurement data fluctuation
to traffic density, weather conditions or day-time related differences in a very flexible way.
The lower left part of Figure 5 shows the temporal gradient of the measurement values.
Running the time series then changes symbologies in the map on the right side accordingly
in a dynamic manner in real-time.
Fig. 4. Spatial Distribution of CO Values in the City of Copenhagen.
Fig. 5. Spatio-temporal CO
2
Data Analysis Using Tracking Analyst.
Standardised Geo-Sensor Webs for Integrated Urban Air Quality Monitoring
523
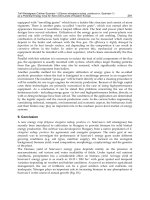
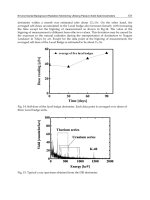
Figure 6 illustrates a time series representation of the measured parameters ambient
temperature, CO, NO
x
and noise. These measurements were taken in Copenhagen over a
period of five hours on 2 December 2009. A first assessment shows that there are strong
correlations between ambient temperature, CO and NO
x
values.
Fig. 6. Time Series Representation of Environmental Measurements.
Preliminary findings show that both CO and CO
2
are characterised by very high temporal
and spatial fluctuations, which are induced by a variety of factors including temperature
variability, time during the day, traffic emergence or ‘plant respiration’ – the fact that plants
release major amounts of CO
2
over night. Also, CO is a measure of the efficiency of
combustion in vehicles and may be used to reflect changing driving patterns and the
sensitivity of air quality to larger scale environmental features such as the wind speeds over
the city. However, the detailed interplay of these parameters still has to be investigated in a
next step. Especially CO values measured in the Copenhagen pilot have to be normalised
over humidity and temperature to perform further quantitative (absolute amounts) and
qualitative (impact on public health) analysis.
5. Potential application areas
More than ten years ago, Al Gore articulated a vision of ‘Digital Earth’ as a multi-resolution,
three-dimensional representation of the planet that would make it possible to find, visualise,
and make sense of vast amounts of geo-referenced information on the physical and social
environment (Gore 1998, for a comprehensive discussion see Craglia et al. 2008). Google
Earth, NASA World Wind and other geo-browsers brought high resolution imagery to
hundreds of millions of internet users and a major industry developed ways to explore data
geographically, and visualise overlaid information provided by both the public and private
sectors, as well as citizens who volunteer new data (Goodchild, 2007).
Generally speaking, fine-grained urban sensing greatly enhances our knowledge of the
environment by adding objective and non-visible data layers in real-time (Resch et al., 2008).
In other words, these systems help us increase our capacity to observe and understand the
city, and the impacts on and by society. This seems to be a very desirable state because more
Environmental Monitoring
524
accurate data about local air temperature, atmospheric humidity, gaseous and particulate air
pollution, and traffic emissions can positively influence areas such as public health, traffic
management or emergency response. Apart from this information enrichment, accurate
sensor measurements also have a much broader influence: considering for example that ‘air
quality’ is only a surrogate for the effects of pollutants on humans makes a fine-grained air
quality map a very sensitive information layer, as discussed in section 4.
Within the Common Scents project, we focus on the use case of air quality monitoring for
use in the public health sector. However, we designed the monitoring infrastructure in such
a modular way that it is not bound to one single application area. Below, several practically
motivated fields of real-world applications are described, which could use the same
infrastructure presented in section 3.
Public Health has been asked to participate in policymaking on ‘quality of life’ issues
increasingly over the past decade. The superimposing of the medical model to describe the
impact of conditions that have traditionally been regarded as nuisances has created a great
challenge, particularly in the field of environmental health.
One pollutant often used to serve as a proxy is NO
x
, which technically represents various
gaseous species comprised of oxygen and nitrogen molecules. Another indicator of near-
roadway effects that has gained recent attention is ultrafine particulates (UFPs), particles
that are less than 0.1 microns (100 nm) in diameter. Thus, air quality measurements of
hazardous air pollutants can be widely associated with traffic (non-point sources). A
pervasive sensor network could help capture measurements in high spatial and temporal
resolution to take short-term measures (dynamically adapt traffic management or send out
alerts to citizens in case of threshold exceedance). Also, it could support traditional long-
term studies on the impact of certain pollutants on public health.
The use case of noise mapping has received a lot of attention recently. Many disputes
within the research field emerge from noise impacts associated with construction,
excavation or some other commercial or industrial enterprise. These disputes also arise from
use of domestic landscaping equipment, like leaf blowers and snow blowers. The limits
imposed by the city on noise generation are intended to assess the background noise levels.
A source cannot be held responsible for noise levels that exceed the city’s allowable limits if
the ambient noise in that area already exceeds those limits. The development of noise ‘maps’
may not immediately result in satisfaction from aggrieved residents, but it can be used to
consider the noise impact of future development and zoning policies. It may also contribute
to efforts to reduce the number of cars travelling across the city by adding the noise impact
dimension to the discussion. This is much more likely to be given full consideration if it can
be demonstrated with highly resolved data maps, which can be generated in near real-time
using the Common Scents infrastructure.
The urban heat island effect describes the contribution of the built environment to the ambient
temperature within urban areas. While this is not likely to become a primary public health
concern, it has great bearing on efforts to limit the loss of heating energy across the city.
Different agencies have been established to work on a long-term strategy to reduce overall
energy use (e.g. Cambridge Energy Alliance: ) and
to encourage individual homeowners and building owners to evaluate their energy loss. It is
quite possible that small changes in heat loss, as described through a detailed heat map of the
city over time, could show progress towards energy efficiency in a materials way. This could
be used both as an evaluation tool in tracking the city’s progress, and as a means to engage the
public in the energy goals of the community.
Standardised Geo-Sensor Webs for Integrated Urban Air Quality Monitoring
525
6. Conclusion
Ubiquitous and continuous environmental monitoring is an enormous challenge, and this is
particularly true in the urban context, which poses very specific challenges as well
technologically as socially and politically. In this chapter we discussed several of these
issues, and outlined how our approach can meet future requirements for urban sensing.
The focus is to contribute to a ‘complete’ picture of a living city for decisions makers,
planners and operators beyond locational analysis. This may be seen distinct from a number
of citizen-centred sensor approaches and context-aware systems. While a number of people-
centric pervasive sensing systems are notable successes (Campbell et al. 2006), most of these
examples focus on localising people and objects in a defined environment to enable context
aware applications. In such projects, the notion of sensing is confined to supporting
location-based context-awareness. In our Live Geography approach a more general integrated
sensing architecture to support the diversity of applications and hardware platforms has
been developed.
Based on the Live Geography approach, we outlined the Common Scents concept, which
tries to establish an interoperable, modular and flexible sensing and data analysis
infrastructure, as opposed to hitherto monolithic sensor networks. To prove our system’s
portability, we did implementations in two different pilot deployments (Cambridge, MA US
and Copenhagen, Denmark) using the same data integration and analysis infrastructure.
Further exploitation of this approach is planned for other cities. We see more future
challenges in the socio-political domain rather in the technological development necessary.
It becomes more and more obvious that a cross-disciplinary group of researchers and
technologists needs to persistently interact with end users. Only then we may achieve a
wide appreciation of sensing which is needed to support future civic, cultural, and
community life in cities. In many parts of the world, notably Germany and some Western
European countries, attempts to ‘completely’ map cities are very sensitive. Google faces
great problems with its StreetView approach. An integrated Common Scents must provide a
clearly recognisable benefit to the citizens in order to be appreciated by all societal groups.
Public Health applications may have a good chance to get accepted although some of the
capabilities, for instance the ability to measure remotely the conditions of people in real
time, raise social concerns centred on privacy issues. Methods for sensor data fusion and
designs for human-computer interfaces are both crucial for the full realisation of the
potential of integrated and pervasive sensing.
We also believe that the impact of pervasive sensing in the city has to be carefully assessed.
We found that e.g. providing very fine-grained information layers might on the one hand be
a powerful decision support instrument, but on the other hand too detailed environmental
information might also have negative effects. As the term ‘air quality’ is just a surrogate for
more personal impacts such as life expectation or respiration diseases, this information
could yield a very broad impact in various kinds of areas such as housing market, the
insurance sector or urban planning in general.
As the Common Scents concept has been developed and implemented together with the
Public Health Department of the City of Cambridge, MA US as concrete end users, we
believe that our approach can respond to dedicated needs of the city management.
Therefore, the longer-term goal is to enhance people’s perception of their environment by
adding unseen information layers and thus changing their short-term behaviour by
providing real-time decision support.
Environmental Monitoring
526
7. Acknowledgement
The Common Scents project is a concerted effort between the Research Studio iSPACE, the
MIT SENSEable City Lab, the City of Cambridge’s Public Health Department and the
Harvard University School of Engineering and Applied Sciences. We would like to thank all
internal and external collaborators for making this project happen.
Several technical parts of this research have been funded through the European Commission
in the course of the FP7 GENESIS project. Furthermore, the Austrian Ministry of Science and
Research (BMWF) funded pieces of the efforts in the Research Studio iSPACE.
The research described in this project by one of the authors (REB) was funded in part by the
Singapore National Research Foundation (NRF) through the Singapore-MIT Alliance for
Research and Technology (SMART) Center for Environmental Sensing and Monitoring
(CENSAM).
The Copenhagen Wheel team from the SENSEable City Laboratory, MIT is composed of
Christine Outram (Project Leader), Rex Britter, Andrea Cassi, Xiaoji Chen, Jennifer Dunnam,
Paula Echeverri, Myshkin Ingawale, Ari Kardasis, E Roon Kang, Sey Min, Assaf Biderman
and Carlo Ratti The courier cyclists were organized by Signe Gaarde in Copenhagen.
8. References
Balazinska, M., Deshpande, A., Franklin, M.J., Gibbons, P.B., Gray, J., Hansen, M., Liebhold,
M., Nath, S., Szalay, A., Tao, V. (2007) Data Management in the Worldwide Sensor
Web. IEEE Pervasive Computing, vol. 6, no. 2, pp. 30-40, Apr-Jun, 2007.
Botts, M., Robin, A., Davidson, J. and Simonis, I. (Eds.) (2006) OpenGIS Sensor Web
Enablement Architecture Document. , OpenGIS
Interoperability Project Report OGC 06-021r1, Version 1.0, 4 March 2006. (12 June
2011)
Botts, M., Percivall, G., Reed, C., and Davidson, J. (Eds.) (2007) OGC Sensor Web
Enablement: Overview and High Level Architecture.
, OpenGIS White Paper OGC 07-165, Version 3, 28
December 2007. (17 June 2011)
Campell, A., Eisenman, S.B., Lane, N.D., Miluzzo and E., Peterson, R.A. (2006) People-
Centric Urban Sensing. Proceedings of the 2nd annual international Workshop on
Wireless Internet, Boston, 2006.
Center for Coastal and Land-Margin Research (2009) CORIE.
(14 June 2011)
Goodchild, M. (2007). Citizens as sensors: The world of volunteered geography. Geo-
journal, 69: 211-221.
Gore, A. (1998) The Digital Earth: Understanding Our Planet in the 21st Century. Speech
given by Vice President Al Gore at the California Science Center, Los Angeles,
California, on January 31, 1998, (27
June 2011)
Gross, N. (1999) 14: The Earth Will Don an Electronic Skin. ,
BusinessWeek Online, 30 August 1999. (20 May 2011)
Harrie, L. (2004) Using Simultaneous Graphic Generalisation in a System for Real-Time
Maps. Papers of the ICA Workshop on Generalisation and Multiple Representation,
August 20-21, 2004, Leicester (electronic version available at
Standardised Geo-Sensor Webs for Integrated Urban Air Quality Monitoring
527
Kansal, A., Nath, S., Liu, J. and Zhao, F. (2007) SenseWeb: An Infrastructure for Shared
Sensing. IEEE Multimedia. vol. 14, no. 4, pp. 8-13, October-December 2007.
Lehto, L. and Sarjakoski, L.T. (2005) Real-time Generalisation of XML-encoded Spatial Data
for the Web and Mobile Devices. International Journal of Geographical Information
Science, vol. 19, no. 8-9, pp. 957-973.
Murty, R., Mainland, G., Rose, I., Chowdhury, A., Gosain, A., Bers, J. and Welsh, M. (2008)
CitySense: A Vision for an Urban-Scale Wireless Networking Testbed. In
Proceedings of the 2008 IEEE International Conference on Technologies for
Homeland Security, Waltham, MA, May 2008.
Nagel, D. (2003) Pervasive Sensing. Proceedings of the SPIE, vol. 4126, no. 71,
doi:10.1117/12.407543, 2003.
Nath, S., Liu, J. and Zhao, F. (2006) Challenges in Building a Portal for Sensors World-Wide.
First Workshop on World-Sensor-Web: Mobile Device Centric Sensory Networks
and Applications (WSW'2006), Boulder CO, 31 October, 2006.
National Oceanic and Atmospheric Administration (2011) nowCOAST: GIS Mapping Portal
to Real-Time Environmental Observations and NOAA Forecasts.
. (15 June 2011)
Paulsen, H. and Riegger, U. (2006). SensorGIS - Geodaten in Echtzeit. In: GIS-Business, vol.
8/2006, pp. 17-19, Cologne.
Paulsen, H. (2008) PermaSensorGIS – Real-time Permafrost Data. In: Geoconnexion
International Magazine, vol. 02/2008.
Rahm, E., Thor, A. and Aumueller, D. (2007) Dynamic Fusion of Web Data. XSym 2007,
Vienna, Austria, pp.14-16.
Resch, B., Calabrese, F., Ratti, C. and Biderman, A. (2008) An Approach Towards a Real-time
Data Exchange Platform System Architecture. Sixth Annual IEEE-IARIA
International Conference on Pervasive Computing and Communications, Hong
Kong, 17-21 March 2008.
Resch, B., Mittlboeck, M., Girardin, F., Britter, R. and Ratti, C. (2009a) Live Geography –
Embedded Sensing for Standardised Urban Environmental Monitoring.
International Journal on Advances in Systems and Measurements, 2(2&3), ISSN
1942-261x, pp. 156-167.
Resch, B., Mittlboeck, M., Lipson, S., Welsh, M., Bers, J., Britter, R. and Ratti, C. (2009b)
Urban Sensing Revisited – Common Scents: Towards Standardised Geo-sensor
Networks for Public Health Monitoring in the City. In: Proceedings of the 11th
International Conference on Computers in Urban Planning and Urban
Management - CUPUM2009, Hong Kong, 16-18 June 2009.
Resch, B., Sagl, G., Blaschke, T. and Mittlboeck, M. (2010a) Distributed Web-processing for
Ubiquitous Information Services - OGC WPS Critically Revisited. In: Proceedings
of the 6th International Conference on Geographic Information Science
(GIScience2010), Zurich, Switzerland, 14-17 September 2010.
Resch, B., Lippautz, M. and Mittlboeck, M. (2010b) Pervasive Monitoring - A Standardised
Sensor Web Approach for Intelligent Sensing Infrastructures. Sensors - Special
Issue ‘Intelligent Sensors 2010’, 10(12), 2010, pp. 11440-11467.
Rittman, M. (2008) An Introduction to Real-Time Data Integration.
2008.
(22 May 2011)
Environmental Monitoring
528
Riva, O. and Borcea, C. (2007) The Urbanet Revolution: Sensor Power to the People!. IEEE
Pervasive Computing, vol. 6, no. 2, pp. 41-49, Apr-Jun, 2007.
Sarjakoski, T. et al. (2004) Geospatial Info-mobility Service by Real-time Data-integration
and Generalisation. . (22 June 2011)
Schut, P. (ed.) (2007) Web Processing Service. OpenGIS Standard, version 1.0.0, OGC 05-
007r7, 8 June 2007.
Srivastava, M., Hansen, M., Burke, J., Parker, A., Reddy, S., Saurabh, G., Allman, M., Paxson,
V. and Estrin D. (2006). Wireless Urban Sensing Systems. Technical Report 65,
Center for Embedded Network Sensing, UCLA, April 2006.
Sybase Inc. (2008) Real-Time Events Data Integration Software.
(07 July 2011)
University of Oklahoma (2009) OKCnet. . (12 March 2011)
Xu, N. (2004) A Survey of Sensor Network Applications. ,
Computer Science Department, University of Southern California, 2004. (10 July
2011)
Zimmerman, D., Pavlik, C., Ruggles, C. and Armstrong, M.P. (1999) An Experimental
Comparison of Ordinary and Universal Kriging and Inverse Distance Weighting.
Mathematical Geology, 31(4), pp. 375-390.