Environmental Impact of Biofuels Part 11 pot
Bạn đang xem bản rút gọn của tài liệu. Xem và tải ngay bản đầy đủ của tài liệu tại đây (463.46 KB, 20 trang )
Environmental Impact of Biofuels
192
as an energy carrier. Table 1 lists European data on rapeseed and rapeseed oil production,
including the top 4 producing countries.
2009
rapeseed
production
World
ranking
(a)
2009 area
harvested
2009 crop
yield
2005-2009
avg. crop yield
(b)
2009
rapeseed oil
production
(10
3
tonne)
(10
3
tonne) (10
3
ha) (tonne/ha) (tonne/ha)
Germany 6306.7 4
th
1471.2 4.29 3.80 (3.44–4.29) 3345.3
France 5584.1 5
th
1480.8 3.77 3.32 (2.90–3.77) 1742.6
Poland 2496.8 7
th
810.0 3.08 2.75 (2.64–3.08) 870.8
UK 1951.0 8
th
580.6 3.36 3.25 (3.10–3.36) 779.0
Total (EU-27) 21417.6 – 6015.9 2.92 – 8466.7
Top-4 share (%) 76.3 – 72.2 – – 79.6
(a)
World rankings for 2008;
(b)
minimum and maximum rapeseed yields in brackets.
Table 1. Rapeseed and rapeseed oil production in the EU-27, including major producers.
(FAOSTAT, 2011; EUROSTAT, 2011)
Vegetable oils are currently used as diesel fuel for automotive purposes, and in thermal and
power plants for heat and electricity production. Even though technological challenges for
the use of straight vegetable oils have been overcome, there are still several non-technical
barriers, namely the need for systems adaptation to run on SVO and the lack of a fuel
distribution network, which do not occur with fossil fuels. Moreover, higher vegetable oil
costs in comparison to fossil fuels also halt the market penetration of stationary SVO
applications, as shown by the lower prices of heavy fuel oil for industry (Tables 2 and 3). For
automotive applications, however, fuel costs work as an incentive for the promotion of SVO,
with SVO prices lower than automotive fossil diesel prices.
On the other hand, the use of SVO seems very promising in developing countries, where self
energy production at minimal costs is of greatest importance. The development of vegetable
oil production chains, combining simpler production technology with lower production
costs – e.g. mechanical oilseed presses, hand- or fuel-driven – is an approach that may
greatly contribute for the socio-economic welfare of populations in these countries.
Year Rapeseed oil
2005 669.4
2006 793.6
2007 970.0
2008 1329.2
2009 858.7
2010 951.1
(a)
Prices paid at the farm gate.
Table 2. Annual average prices (US$/tonne) of rapeseed oil
(a)
(FAOSTAT, 2011)
Uncertainty Analysis of the Life-Cycle
Greenhouse Gas Emissions and Energy Renewability of Biofuels
193
Country
Heavy fuel oil
for industry
Automotive
diesel fuel
(a)
Germany 515.2 1594.1
France 542.0 1483.5
Poland 590.0 1332.9
United Kingdom n/a 1785.9
n/a: data not available;
(a)
A density of 0.85 kg/liter for diesel fuel has been used.
Table 3. Retail prices of selected fuels (US$/tonne) for the 1
st
quarter of 2010 (IEA, 2010)
3.2 Life-cycle modeling and inventory incorporating uncertainty
3.2.1 RO life-cycle chain
The life-cycle stages of the RO chain include rapeseed cultivation, harvesting, transport and
drying of the seeds, crushing and extraction of the oil, oil degumming and refining. These
steps are illustrated in the flowchart of Fig. 1. A detailed description of the RO production
system can be found, for example, in Mortimer and Elsayed (2006), Stephenson et al. (2008)
and Malça and Freire (2009, 2010).
Rape (Brassica napus L.), also known as Rapeseed, Oilseed Rape or Canola, is a yellow-
flowered member of the family Brassicaceae widely cultivated throughout the world for the
production of vegetable oil for human food consumption, but increasingly used for energy.
Different cultivation methods may be used, namely in terms of soil management and soil
inputs, depending on the climate region, soil type, and established agricultural practices.
The cultivation step includes soil preparation, fertilization, sowing, weed control, and
harvesting. Seeds are separated from the rest of the plant during harvesting. The straw,
consisting of stalks, pods and leaves, is usually ploughed back into the field (SenterNovem,
2005; JEC, 2007; UFOP, 2008; Börjesson and Tufvesson, 2010). Several studies point out the
incorporation of straw in the soil as a farm management activity with several benefits,
namely the return and cycling of nutrients, the building of soil organic matter and the
prevention of soil erosion.
Following harvesting, oilseeds are cleaned and dried. The typical moisture content of
oilseeds is reduced, as required by oil extraction facilities and to ensure stability in storage.
Moreover, large scale oil extraction is usually preceded by grinding and cooking of the
seeds, to facilitate the oil extraction process. Vegetable oil may be extracted from the seeds
by physical and/or chemical extraction. Different types of mechanical extraction devices can
be used, namely the screw press and the ram press (Tickell et al., 2003). The first uses a
screw inside a metal housing; as the screw turns, the oil is squeezed out of the seeds. The
ram press uses a piston-cylinder set to crush the oilseeds. After mechanical pressing,
protein-rich cake is also produced and can be used in animal feed. The press cake has,
however, high oil content and a further (chemical) extraction step is usually conducted to
extract the remaining oil, in order to increase the overall vegetable oil yield. Chemical
extraction uses a petroleum-derived solvent, usually hexane; this is the extraction method
considered in this chapter.
When solvent extraction is used, the oil goes through a distillation process to recover the
hexane, which is recycled back to the oil extraction process. The final step in the
production of vegetable oils is oil refining, which includes degumming, neutralization
and drying. Gums are precipitated by the addition of hot water and phosphoric (or
Environmental Impact of Biofuels
194
equivalent) acid and separated out by centrifugal separation. Free fatty acids in the oil are
converted to soap using an alkali solution of sodium hydroxide, which is subsequently
removed by continuous centrifugation. Finally, the oil is vacuum dried to remove any
traces of water.
Rapeseed
Rape meal
(cakes)
fertilizers and
pesticides
fossil fuels
electricity
Rapeseed
Oil
Oil extractionCultivation
Combustion in
engines or boilers
straw
Cropland
Grassland
(Alternative direct
LUC scenarios)
Soy meal
(Substitution method)
Fig. 1. Flow chart illustrating the life-cycle chain (well-to-tank) of Rapeseed Oil
The multifunctionality of biofuel systems is considered a critical issue in biofuel life-cycle
studies, as discussed in section 2. For the RO production system, in particular, one valuable
co-product is obtained: rape meal. Different approaches are addressed here for dealing with
this co-production): i) the substitution method, in which the system is expanded with the
avoided process – (soy meal production); ii) allocation, i.e. splitting up the process into two
single-functional processes (RO production + rape meal production) on the basis of
underlying relationships (physical: mass, energy; and economic); and iii) the no allocation,
in which rape meal is ignored, i.e. all burdens (energy and material inputs, and related
emissions) are fully allocated to RO.
Concerning the application of the substitution method, it is considered that the RO co-
product rapeseed meal replaces imported soybean meal in animal feed. The technical
feasibility of replacing soybean meal with rapeseed meal for feeding pigs and piglets has
already been demonstrated (e.g. Kracht et al., 2004). Research recently conducted in France
has also concluded that replacing soybean meal with rapeseed meal in the feed rations for
dairy cows and for fattening beef cattle is technically feasible (GAIN, 2005). Actually, rape
meal from oilseed crushing is replacing soybean meal imports as a high-protein animal feed
(GAIN, 2007; Ceddia and Cerezo, 2008). This substitution approach is also considered in
other works (e.g. Bernesson et al., 2004; JEC, 2007; Lechón et al., 2009; Soimakallio et al.,
2009).
3.2.2 Key issues affecting soil carbon exchange
Several issues influence soil carbon exchange, namely land use change scenarios,
agricultural practices and geographic region. Concerning land use change, two reference
land uses have been considered in this article: (i) grassland; and (ii) long-term cultivated
cropland. Appropriate land use factors F
LU
, which reflect the difference in soil organic
Uncertainty Analysis of the Life-Cycle
Greenhouse Gas Emissions and Energy Renewability of Biofuels
195
carbon associated with the type of land use compared to a standard soil organic carbon
SOC
ST
, have been taken from EC (2010), IPCC (2006).
EC (2010) differentiates three alternative management practices for cropland – full-tillage;
reduced or low-tillage; and no-till – based on the level of soil disturbance during cultivation,
respectively substantial, reduced or minimal. Full- and reduced-tillage have been
considered for the reference land use, whereas low-tillage has been assumed for the actual
land use (rapeseed cultivation). Concerning grassland, the management scenario that most
contributes to carbon sequestration in the soil is improved grassland (according to EC 2010),
which has been used in our assessment. The alternatives in soil management practices have
been quantified through F
MG
, a factor that reflects the difference between the soil organic
carbon associated with the main management practice and the standard soil organic carbon
SOC
ST
(EC, 2010a).
The level of carbon input to the soil may also differ depending on the return of crop residues
to the field and the adoption of other agricultural practices (EC, 2010a). To quantify extreme
scenarios in terms of soil carbon content in the reference land use, high and low carbon
inputs have been considered, respectively for grassland and cropland, whereas in the actual
land use the option for medium inputs to rapeseed cultivation has been selected. The input
factor F
I
, which reflects the difference in soil organic carbon associated with different levels
of carbon input to soil compared to the standard soil organic carbon SOC
ST
, has been used
(EC, 2010a; IPCC, 2006).
The geographic region is another key aspect for assessing the GHG emissions of a specific
crop, since climate and soil type are two important factors affecting the calculation of land
carbon stocks. Main rapeseed oil producers in Europe are France and Germany (see Table 1).
A cool temperate moist climate has been selected as representative of main rapeseed
production in Europe, according to the classification made in EC (2010). Concerning soil
type, EC (2010) shows that high activity clay soil is the most representative soil type for
countries involved in rapeseed cultivation. Active soils are also indicated in JEC (2007) as
the most likely soil type to be converted to arable cropping.
-2
-1
0
1
2
3
4
Improved grassland
to rapeseed cultiv.
Low-tillage cropland
to rapeseed cultiv.
Full-tillage cropland
to rapeseed cultiv.
∆C
LUC-a
[tC ha
-1
yr
-1
]
Fig. 2. Soil carbon exchange associated with LUC scenarios for Rapeseed Oil. The boxes
show the interquartile range, the mark is the median and the ends of the whiskers are the 5
th
and 95
th
percentiles. Same notation is used in figs. 3 and 5
As shown in the above discussion, a large degree of variability exists concerning the
management practices and input levels associated with rapeseed cultivation. The guidance
Environmental Impact of Biofuels
196
provided in EC (2010) concerning the selection of the appropriate coefficients F
LU
, F
MG
and
F
I
for land use and management has been followed in this article. Moreover, appropriate
probability distributions have been assigned to ΔC
LUC-a
, based on the error ranges provided
in IPCC (2006) for each LUC scenario (Fig. 2).
3.3 Results and discussion
Rapeseed oil life-cycle energy renewability efficiency and GHG intensity incorporating
uncertainty are presented in section 3.3. GHG emission savings of displacing petroleum
diesel are also evaluated. As discussed in section 2, a “well-to-tank” approach has been
used, in which energy and GHG emissions are assessed from the very first production stage
until the final fuel distribution depot. The functional unit chosen is 1 MJ of fuel energy
content (FEC), measured in terms of the lower heating value (LHV).
3.3.1 Energy Renewability Efficiency
The life-cycle energy renewability efficiency ERenEf of rapeseed oil is displayed in the box
plot of Fig. 3. The output distributions are divided in the 5
th
, 25
th
, 50
th
, 75
th
, and 95
th
percentiles. Scenario uncertainty has been considered regarding the modeling choice of how
co-product credits are accounted for, namely using mass, energy and market value
allocation approaches and the substitution method. A comparison with fossil diesel shows
that rapeseed oil clearly contributes to non-renewable primary energy savings as opposed to
its fossil reference. RO ERenEf is clearly positive, which indicates that an important fraction
of the biofuel energy content (from 60% to 85%, depending on the approach for dealing with
co-products, Fig. 3) comes from renewable energy sources.
Comparing the three allocation methods used, Fig. 3 shows that mass allocation results have
the lowest uncertainty range, whereas economic allocation results are more uncertain
because they depend on the variability of market prices. System expansion shows the
highest degree of uncertainty due to differences in credits for soy meal substitution by rape
meal.
-40
-20
0
20
40
60
80
100
no alloc mass energy economic substitution FD
ERenEf [%]
Fig. 3. RO life-cycle ERenEf results: scenario and parameter uncertainty
Uncertainty Analysis of the Life-Cycle
Greenhouse Gas Emissions and Energy Renewability of Biofuels
197
Moreover, mass allocation shows the highest results, which is explained by the relatively
high mass share of rape meal in the oil extraction stage (approximately 1.5 kg of rape meal
per kg of RO produced). Although it is a straightforward method, mass allocation is very
often a meaningless approach, namely when energy systems or market principles come into
play. Allocations based on energy and economic value show lower ERenEf values, due to
the higher heating value and market price of RO in comparison to rape meal.
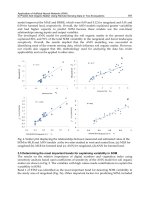
Figure 4 shows which parameters are most significant in the overall uncertainty of RO
ERenEf. The uncertainty importance analysis that has been conducted shows that several
parameters have important contributions in the uncertainty, namely diesel fuel use in
agricultural machinery, N fertilizer application rate and energy use in N fertilizer
production. In particular, Fig. 4(b) for economic allocation shows that market prices (and
their inherent volatility) also affect the variance of ERenEf.
20,8%
19,6%
19,4%
14,4%
10,2%
7,7%
2,7%
5,2%
0% 20% 40% 60% 80% 100%
Fuel agric mach N fer t app rate Energy N fer t prod Rapeseed yield Oil e xtr rate Energy soy meal prod Rape meal/soy meal ratio Other
(a)
24,6%
14,7%
14,6%
13,6%
10,6%
9,7%
8,0%
4,2%
0% 20% 40% 60% 80% 100%
RO price Fuel agric mach N fert app rate Energy N fer t prod Rapeseed yield Rape meal price Oil extraction r ate Other
(b)
Fig. 4. Contribution of input data to the variance of RO life-cycle ERenEf: (a) substitution
method; (b) economic allocation
3.3.2 GHG savings
Life-cycle GHG emission savings of RO displacing petroleum diesel are shown in Fig. 5. The
uncertainty associated with the life-cycle GHG emissions of petroleum diesel has been
considered using a normal probability distribution (μ=82 g CO
2
eq MJ
-1
; σ=3 g CO
2
eq MJ
-1
).
An important conclusion from Fig. 5 is that parameter uncertainty is significantly higher in
the case of RO GHG emissions when compared to ERenEf values of Fig. 3. An uncertainty
importance analysis will put into evidence the parameters that most contribute to this
higher magnitude of uncertainty.
Figure 5 shows that RO GHG emissions are considerably higher than fossil diesel (FD) GHG
emissions if the most severe land use change scenario (improved grassland to rapeseed
cultivation) is considered, i.e. FD substitution by RO results in negative GHG savings. This
outcome contrasts with the other two LUC scenarios (conversion from full-tillage or low-
Environmental Impact of Biofuels
198
tillage croplands) in which rapeseed oil GHG savings are positive. Moreover, these savings
are above the 35% GHG saving target of the European renewable energy directive (EPC,
2009), regardless of the co-product method used.
Fig. 5 also shows that in the “low-tillage cropland to rapeseed cultivation” LUC scenario, the
parameter uncertainty range overcomes the differences between calculated median values
for the various scenarios of co-product treatment. Soil carbon sequestration associated with
conversion of “full-tillage cropland to rapeseed cultivation” results in very low RO life-cycle
GHG emissions, complying with the 2018 target of 60% GHG savings over fossil diesel of
EPC (2009). In this scenario, differences between co-product approaches become negligible.
-300
-250
-200
-150
-100
-50
0
50
100
150
n/a m en ec su n/a m en ec su n/a m en ec su
Improved grassland
to rapeseed cultiv.
Low-tillage cropland
to rapeseed cultiv.
Full-tillage cropland
to rapeseed cultiv.
GHG savings [%]
35%
50%
60%
Fig. 5. RO life-cycle GHG emission savings: LUC scenarios and co-product approaches (n/a:
no allocation; m: mass; en: energy; ec: economic; su: substitution). Dashed lines indicate
minimum levels of GHG savings (EPC, 2009)
Figure 6 shows which parameters are most significant in the overall uncertainty of RO GHG
emissions for the three LUC scenarios considered. The highest sources of uncertainty arise
in the cultivation stage. Soil carbon emissions from land use change are the main contributor
to the uncertainty of RO GHG intensity, with nitrous oxide emissions from cultivated soil as
the second most important aspect. Agricultural yield and oil extraction efficiency (amount of
rapeseed oil that can be extracted per kg of processed seed) are also important in the
“grassland to rapeseed” LUC scenario. The remaining parameters hardly contribute to the
variance of GHG emissions. Further research work must focus on the most important
sources of uncertainty, in order to reduce the overall uncertainty of the rapeseed oil chain
and improve the reliability of RO life-cycle studies outcomes.
Uncertainty Analysis of the Life-Cycle
Greenhouse Gas Emissions and Energy Renewability of Biofuels
199
67,9%
11,1%
9,4%
4,7%
3,7%
0,9%
2,3%
0% 20% 40% 60% 80% 100%
Soil carbon emissions Soil N2O emissions Rapeseed yield FD life-cycle Oil extr action rate N fertilizer production Other
(a)
72,3%
19,3%
2,1%
6,3%
0% 20% 40% 60% 80% 100%
Soil carbon emissions Soil N2O emissions N fertilizer production Other
(b)
76,8%
17,7%
1,5%
4,0%
0% 20% 40% 60% 80% 100%
Soil carbon emissions Soil N2O emissions N fertilizer production Other
(c)
Fig. 6. Contribution of input data to the variance of RO life-cycle GHG emission savings
(substitution method). Land use change scenarios: (a) improved grassland to rapeseed
cultivation; (b) low-tillage cropland to rapeseed cultivation; (c) full-tillage cropland to
rapeseed cultivation
4. Conclusions
This chapter has two main goals: i) to present a robust framework to incorporate uncertainty
in the life-cycle modeling of biofuel systems; and ii) to describe the application of the
framework to vegetable oil fuel in Europe. The chapter also compares rapeseed oil life-cycle
results (energy renewability efficiency and GHG emissions) with its fossil fuel equivalent
(diesel), in order to evaluate potential savings achieved through displacement.
A comprehensive assessment of uncertainty in the life-cycle of rapeseed oil has been
conducted. Several sources of uncertainty have been investigated, namely related to
parameters, global warming potentials and concerning how co-product credits are
accounted for. It has been shown that depending on whether or not uncertainty in
parameters is taken into account, and what modeling choices are made, results and
conclusions from the life-cycle study may vary quite widely. In particular, it has been
reported that the net GHG balance is strongly influenced by soil carbon stock variations due
to land use change and by the magnitude of nitrous oxide emissions from cultivated soil.
Environmental Impact of Biofuels
200
Depending on prior land use, GHG emissions may comply with the European directive
target of 35% GHG emission savings or, conversely, may completely offset carbon gains
attributed to rapeseed oil production. These results contrast with the energy balance of
rapeseed oil, which shows a high degree of energy renewability efficiency, regardless of
parameter uncertainty and modeling choices made. Moreover, non-renewable primary
energy savings are always achieved with rapeseed oil use, as opposed to fossil diesel use.
The benefits of using rapeseed oil to displace fossil diesel have been demonstrated, but
special attention is needed to reduce emissions from carbon stock changes and nitrogen
fertilizer application, in order to ensure that rapeseed oil use avoids GHG emissions. Only
through a comprehensive evaluation of the life-cycle of biofuels, capturing uncertainty
issues, it is possible to ensure reliable outcomes and guarantee the environmental
sustainability of biofuel production systems.
5. Acknowledgements
The research presented in this article has been supported by the Portuguese Science and
Technology Foundation (FCT) projects PTDC/TRA/72996/2006 “
Biofuel systems for
transportation in Portugal: a well-to-wheels integrated multi-objective assessment”,
MIT/SET/0014/2009 “
Biofuel capturing uncertainty in biofuels for transportation: resolving
environmental performance and enabling improved use”
, and MIT/MCA/0066/2009 “Economic
and Environmental Sustainability of Electric Vehicle Systems”.
6. References
ADEME (Agence de l’Environnement et de la Maitrise de l’Energie). Energy and greenhouse
gas balances of biofuels’ production chains in France, executive summary, Paris;
December 2002.
Anex R, Lifset R. 2009. Assessing Corn Ethanol: Relevance and Responsibility.
Journal of
Industrial Ecology
13(4):479-482.
Armstrong A, Baro J, Dartoy J, Groves A, Nikkonen J, Rickeard D, Thompson D, & Larivé J.
Energy and greenhouse gas balance of biofuels for Europe - an update, report no.
2/02. Brussels: CONCAWE, 2002.
Bernesson S, Nilsson D, & Hansson PA. 2004. A limited LCA comparing large- and small-
scale production of rape methyl ester (RME) under Swedish conditions.
Biomass &
Bioenergy 26(6):545–559.
Björklund A. 2002. Survey of Approaches to Improve Reliability in LCA.
Int. Journal of Life
Cycle Assessment 7(2):64-72.
Börjesson P, & Tufvesson L. 2011. Agricultural crop-based biofuels – resource efficiency and
environmental performance including direct land use changes.
Journal of Cleaner
Production 19:108-120.
Boustead I, & Hancock G. Handbook of Industrial Energy Analysis. Ellis Horwood ltd, John
Wiley and Sons, 1979.
Boustead I. Eco-Profiles of the European plastics industry. Methodology. Report. Brussels:
Association of Plastics Manufacturers in Europe, 2003.
Bowyer C. 2010. Anticipated Indirect Land Use Change Associated with Expanded Use of
Biofuels and Bioliquids in the EU – An Analysis of the National Renewable Energy
Action Plans. Institute for European Environmental Policy, London, UK.
Uncertainty Analysis of the Life-Cycle
Greenhouse Gas Emissions and Energy Renewability of Biofuels
201
Ceddia M, & Cerezo E. A Descriptive Analysis of Conventional Organic and GM crop and
Certified Seed Production in the EU. Luxembourg: Joint Research Centre of the
European Commission; 2008.
Cherubini F, Birda N, Cowie A, Jungmeier G, Schlamadinger B, & Woess-Gallasch S. 2009.
Energy- and greenhouse gas- based LCA of biofuel and bioenergy systems: Key
issues, ranges and recommendations.
Resources Conservation & Recycling 53(8):434-
447.
Cherubini F. 2010. GHG balances of bioenergy systems – Overview of key steps in the
production chain and methodological concerns. Renewable Energy 35:1565–1573.
Cherubini F, & Strømman AH. 2011. Life cycle assessment of bioenergy systems: State of the
art and future challenges.
Bioresource Technology 102:437-451.
Chiaramonti D, & Tondi G. Stationary Applications of Liquid Biofuels, Final Report, ETA
Renewable Energies, December, Firenze, 2003.
Ciroth A, Fleischer G, & Steinbach J. 2004. Uncertainty Calculation in Life Cycle
Assessments: A Combined Model of Simulation and Approximation.
International
Journal of Life Cycle Assessment
9(4): 216-226.
Cocco D. 2009. Predicted performance of integrated power plants based on diesel engines
and steam cycles fuelled with a rapeseed oil chain. Proceedings of the Institution of
Mechanical Engineers Part A –
Journal of Power and Energy 223(A5):477–485.
Croezen H, Bergsma G., Otten M., & van Valkengoed M. Biofuels: indirect land use change
and climate impact. CE Delft, Delft, the Netherlands, June 2010.
Crutzen PJ, Mosier AR, Smith KA, & Winiwarter W. 2008. N2O release from agro-biofuel
production negates global warming reduction by replacing fossil fuels.
Atmospheric
Chemistry and Physics
8(2):389–395.
DCENR (Department of Communications, Energy and Natural Resources). Report on
measures taken to promote the use of biofuels or other renewable fuels to replace
diesel or petrol: compliance with Directive 2003/30/EC. July, Ireland, 2007.
Dewulf A, van Langenhove H, & van de Velde B. 2005. Exergy-Based Efficiency and
Renewability Assessment of Biofuel Production.
Environmental Science & Technology
39:3878-3882.
DMFA (Dutch Ministry of Foreign Affairs). Report from the Netherlands for 2006 pursuant
to Article 4(1) of Directive 2003/30/EC on the promotion of the use of biofuels or
other renewable fuels for transport. July, The Netherlands, 2007.
EC (European Commission). 2010a. Commission decision 2010/335/EU of 10 June 2010 on
guidelines for the calculation of land carbon stocks for the purpose of Annex V to
Directive 2009/28/EC.
EC 2010b. Report from the Commission on indirect land-use change related to biofuels and
bioliquids. COM(2010) 811 final, December 22.
EPA (Environmental Protection Agency). Regulation of Fuels and Fuel Additives:
Modifications to Renewable Fuel Standard Program. Federal Register, Vol. 75, No.
244, December 21, 2010.
EPC. Directive 2009/28/EC of the European Parliament and of the Council of 23 April 2009
on the promotion of the use of energy from renewable sources and amending and
subsequently repealing Directives 2001/77/EC and 2003/30/EC; 2009.
EurObserv’ER. Biofuels Barometer. Systèmes Solaires - Le journal des énergies
renouvelables 185; June 2008, p. 49-66.
Environmental Impact of Biofuels
202
Eurostat (Statistical Office of the European Communities).
(accessed March 2011).
FAOSTAT (FAO statistical database). (accessed January 2011).
Fargione J, Hill J, Tilman D, Polasky S, & Hawthorne P. 2008. Land Clearing and the Biofuel
Carbon Debt.
Science 319(5867):1235-1238.
Farrell AE, Plevin RJ, Turner BT, Jones AD, O’Hare M, & Kammen DM. 2006. Ethanol Can
Contribute to Energy and Environmental Goals.
Science 311, pp. 506-508, Jan 27.
Frischknecht R. 2000. Allocation in Life Cycle Inventory Analysis for Joint Production.
Int.
Journal of Life Cycle Assessment
5 (2):85-95.
Fritsche U, Sims R, & Monti A. 2010. Direct and indirect land-use competition issues for
energy crops and their sustainable production – an overview.
Biofuels, Bioproducts &
Biorefining
4:692–704.
GAIN (Global Agriculture Information Network). 2005. France explores substituting
soybean meal with rapeseed meal. USDA Foreign Agricultural Service. Paris.
GAIN (Global Agriculture Information Network). Impacts on Oilseed Industry following
Biofuel Boom. Paris: USDA Foreign Agricultural Service; 2007.
Geisler G, Hellweg S, & Hungerbuhler K. 2005. Uncertainty Analysis in Life Cycle
Assessment (LCA): Case Study on Plant-Protection Products and Implications for
Decision Making.
International Journal of Life Cycle Assessment 10(3): 184-192.
Gnansounou E, Dauriat A, Villegas J, & Panichelli L. 2009. Life cycle assessment of biofuels:
Energy and greenhouse gas balances.
Bioresource Technology 100(21):4919-4930.
Guinée JB, Heijungs R, & Huppes G. 2004. Economic Allocation: Examples and Derived
Decision Tree.
Int Journal of Life Cycle Assessment 9(1):23-33.
Guinée JB, Heijungs R, & van der Voet E. 2009. A greenhouse gas indicator for bioenergy:
some theoretical issues with practical implications.
Int Journal of Life Cycle
Assessment
14(4):328-339.
Heijungs R, & Huijbregts M. 2004. A Review of Approaches to Treat Uncertainty in LCA. In:
C. Pahl-Wostl, S. Schmidt, A.E. Rizzoli, and A.J. Jakeman (Eds). Complexity and
Integrated Resources Management. Transactions of the 2nd Biennial Meeting of the
International Environmental Modelling and Software Society, Vol 1, Osnabrück.
Heijungs, R. 1996. Identification of key issues for further investigation in improving the
reliability of life-cycle assessments.
Journal of Cleaner Production 4(3–4):159–166.
Hekkert M, Hendriks F, Faaij A, & Neelis M. 2005. Natural gas as an alternative to crude oil
in automotive fuel chains well-to-wheel analysis and transition strategy
development.
Energy Policy 33:579–594.
Heller M, Keoleian G, & Volk T. 2003. Life cycle assessment of a willow bioenergy cropping
system.
Biomass and Bioenergy 25:147–165.
Hoefnagels R, Smeets E, & Faaij A. 2010. Greenhouse gas footprints of different biofuel
production systems.
Renewable & Sustainable Energy Reviews 14:1661-1694.
Huijbregts, M. 1998. Application of uncertainty and variability in LCA. Part I: A General
Framework for the Analysis of Uncertainty and Variability in Life Cycle
Assessment.
International Journal of Life Cycle Assessment 3(5): 273–280.
Huijbregts M, Gilijamse W, Ragas A, & Reijnders L. 2003. Evaluating Uncertainty in
Environmental Life-Cycle Assessment. A Case Study Comparing Two Insulation
Options for a Dutch One-Family Dwelling.
Environmental Science & Technology
37:2600-2608.
Uncertainty Analysis of the Life-Cycle
Greenhouse Gas Emissions and Energy Renewability of Biofuels
203
Huijbregts M, Rombouts L, Hellweg S, Frischknecht R, Hendriks A, van de Meent D, Ragas
A, Reijnders L, & Struijs J. 2006. Is Cumulative Fossil Energy Demand a Useful
Indicator for the Environmental Performance of Products?
Environmental Science &
Technology
40(3):641-648.
Huo H, Wang M, Bloyd C, & Putsche V. 2009. Life-Cycle Assessment of Energy Use and
Greenhouse Gas Emissions of Soybean-Derived Biodiesel and Renewable Fuels.
Environmental Science & Technology 43:750-756.
IEA (International Energy Agency). 2010 key world energy statistics, Paris, 2010.
IPCC (Intergovernmental Panel on Climate Change). Climate Change 2007 - The Physical
Science Basis. Fourth Assessment Report. New York: Cambridge University Press;
2007.
IPCC. 2006 IPCC Guidelines for National Greenhouse Gas Inventories. Vol.4, Ch. 11: N2O
Emissions from Managed Soils and CO
2
Emissions from Lime and Urea
Application. Prepared by the National Greenhouse Gas Inventories Programme,
Eggleston HS, Buendia L, Miwa K, Ngara T, Tanabe K, editors. Japan: Institute for
Global Environmental Strategies; 2006.
ISO (International Organization for Standardization). ISO 14040: Environmental
management – Life cycle assessment – Principles and framework. Genève,
Switzerland; 2006.
ISO. ISO 14044: Environmental management – Life cycle assessment – Requirements and
guidelines. Genève, Switzerland; 2006.
Janulis P. 2004. Reduction of energy consumption in biodiesel fuel life cycle.
Renewable
Energy 29:861-871.
JEC (JRC/EUCAR/CONCAWE Consortium; CONCAWE: The oil companies’ European
association for environment, health and safety in refining and distribution; EUCAR:
European Council for Automotive R&D; JRC: Joint Research Centre of the
European Commission). Well-to-wheels analysis of future automotive fuels and
powertrains in the European context. Well-to-tank and Well-to-wheels report,
Version 2c, Brussels; March 2007.
Kaiser E, Kohrs K, Kucke M, Schnug E, Heinemeyer O, & Munch J. 1998. Nitrous oxide
release from arable soil: importance of N-fertilization, crops and temporal
variation.
Soil Biology & Biochemistry 30(12):1553-1563.
Kim S, & Dale B. 2002. Allocation Procedure in Ethanol Production System from Corn Grain.
I-System Expansion.
Int. Journal of Life Cycle Assessment 7(4):237-243.
Kløverpris J, Wenzel H, Banse M, Milà i Canals L, & Reenberg A. 2008. Conference and
Workshop on Modelling Global Land Use Implications in the Environmental
Assessment of Biofuels.
Int Journal of Life Cycle Assessment 13(3):178-183.
Knothe G. Historical perspectives on vegetable oil-based diesel fuels.
Industrial Oils 12: 1103-
1107, 2001.
Kracht W, Nicke S, Kluge H, Keller K, Matzke W, Hennig U & Schumann W. 2004. Effect of
Dehulling of Rapeseed on Feed Value and Nutrient Digestibility of Rape Products
in Pigs.
Archives of Animal Nutrition 58(5):389-404.
Krupnick A, Morgenstern R, Batz M, Nelson P, Burtraw D, Shih J, & McWilliams M. 2006.
Not a sure thing: Making regulatory choices under uncertainty. Technical report,
Resources for the Future, Washington DC.
Environmental Impact of Biofuels
204
Larson E. 2006. A review of life-cycle analysis studies on liquid biofuel systems for the
transport sector.
Energy & Sustainable Development 10(2):109–126.
Lechón Y, Cabal H, de la Rúa C, Caldés N, Santamaría M, & Sáez R. 2009. Energy and
greenhouse gas emission savings of biofuels in Spain’s transport fuel. The adoption
of the EU policy on biofuels.
Biomass & Bioenergy 33(6-7):920-932.
Liska AJ, & Cassman KG. 2008. Towards Standardization of Life-Cycle Metrics for Biofuels:
Greenhouse Gas Emissions Mitigation and Net Energy Yield.
Journal of Biobased
Materials and Bioenergy
2:187–203.
Liska AJ, & Perrin RK. 2009. Indirect land use emissions in the life cycle of biofuels:
regulations vs science.
Biofuels, Bioproducts & Biorefining 3:318–328.
Lloyd S, & Ries R. 2007. Characterizing, Propagating, and Analyzing Uncertainty in Life-
Cycle Assessment: A Survey of Quantitative Approaches,
Journal of Industrial
Ecology
11(1): 161–179.
Luque R, Davila L, Campelo JM, Clark JH, Hidalgo JM, Luna D et al. 2008. Biofuels: a
technological perspective.
Energy and Environmental Science 1(5):542-564.
Luo L, van der Voet E, Huppes G, & Udo de Haes H. 2009 Allocation issues in LCA
methodology: a case study of corn stover-based fuel ethanol.
Intl Journal of Life Cycle
Assessment 14:529-539.
Malça J, & Freire F. 2004. Life cycle energy analysis for bioethanol: allocation methods and
implications for energy efficiency and renewability. 17th International Conference
on Efficiency, Costs, Optimization, Simulation and Environmental Impact of
Energy and Process Systems (ECOS 2004), July 07-09, Guanajuato Mexico.
Malça J, & Freire F. 2006. Renewability and life-cycle energy efficiency of bioethanol and
bioethyl tertiary butyl ether (bioETBE): Assessing the implications of allocation.
Energy 31(15):3362-3380.
Malça J, & Freire F. 2009. Energy and environmental benefits of rapeseed oil replacing
diesel.
International Journal of Green Energy 6(3):287-301.
Malça J, & Freire F. 2010. Uncertainty Analysis in Biofuel Systems: An Application to the
Life Cycle of Rapeseed Oil
. Journal of Industrial Ecology 14(2):322-334.
Malça J, & Freire F. 2011. Life-cycle studies of biodiesel in Europe: A review addressing the
variability of results and modeling issues.
Renewable & Sustainable Energy Reviews
15(1):338-351.
Menichetti E, & Otto M. 2008. Energy Balance & Greenhouse Gas Emissions of Biofuels from
a Life Cycle Perspective. In: R.W. Howarth and S. Bringezu (eds) Biofuels:
Environmental Consequences and Interactions with Changing Land Use.
Proceedings of the Scientific Committee on Problems of the Environment (SCOPE)
International Biofuels Project Rapid Assessment, September 22-25 2008,
Gummersbach, Germany.
Misra R, & Murthy M. 2010. Straight vegetable oils usage in a compression ignition engine—
A review.
Renewable and Sustainable Energy Reviews 14:3005–3013.
Mondal P, Basu M, & Balasubramanian N. 2008. Direct use of vegetable oil and animal fat as
alternative fuel in internal combustion engine.
Biofuels, Bioproducts & Biorefining
2:155–174.
Morgan MG & Henrion M. 1990. A Guide to Dealing with Uncertainty in Quantitative Risk
and Policy Analysis. New York: Cambridge University Press.
Uncertainty Analysis of the Life-Cycle
Greenhouse Gas Emissions and Energy Renewability of Biofuels
205
Mortimer N, Cormack P, Elsayed M, & Horne R. Evaluation of the Comparative Energy,
Global Warming and Social Costs and Benefits of Biodiesel, report. UK: Resource
Research Unit, Sheffield Hallam University, 2003.
Mortimer ND, Elsayed MA. North East Biofuel Supply Chain Carbon Intensity Assessment.
Sheffield, UK: North Energy Associates Ltd; 2006.
Neupane B, Halog A, & Dhungel S. 2011. Attributional life cycle assessment of woodchips
for bioethanol production.
Journal of Cleaner Production 19:733-741.
Oracle. 2010. Oracle Crystal Ball software v.11.1.
Papong S, & Malakul P. 2010. Life-cycle energy and environmental analysis of bioethanol
production from cassava in Thailand.
Bioresource Technology 101:S112–S118.
Plevin R. 2010. Life Cycle Regulation of Transportation Fuels: Uncertainty and its Policy
Implications. PhD thesis. University of California, Berkeley, USA.
Poldy F. 2008. Net energy and strategic decision-making.
Biofuels, Bioproducts & Biorefining
2:389–392.
Rabl A, Benoist A, Dron D, Peuportier B, Spadaro J, & Zoughaib A. 2007. How to Account
for CO
2
Emissions from Biomass in an LCA. Intl Journal of Life Cycle Assessment
12(5):281.
Reijnders L, & Huijbregts M. 2008. Biogenic greenhouse gas emissions linked to the life
cycles of biodiesel derived from European rapeseed and Brazilian soybeans.
Journal
of Cleaner Production 16(18):1943–1948.
Reijnders L. 2009. Transport biofuels: Can they help limiting climate change without an
upward impact on food prices?
Journal of Consumer Protection and Food Safety 4:75-
78.
Saltelli A, Ratto M, Tarantola S, & Campolongo F. 2006. Sensitivity analysis practices:
Strategies for model-based inference.
Reliability Engineering & System Safety 91(10-
11):1109–1125.
Schade B, & Wiesenthal T. 2011. Biofuels: A model based assessment under uncertainty
applying the Monte Carlo method.
Journal of Policy Modeling 33:92–126.
Searchinger T, Heimlich R, Houghton RA, Dong F, Elobeid A, Fabiosa J, et al. 2008. Use of
U.S. Croplands for Biofuels Increases Greenhouse Gases through Emissions from
Land-Use Change.
Science 319(5867):1238-1240.
SenterNovem (Agency of the Dutch Ministry of Economic Affairs for Innovation and
Sustainable Development). The road to pure plant oil? The technical, environment-
hygienic and cost-related aspects of pure plant oil as a transport fuel. Report
2GAVE-05.05. The Netherlands, 2005.
Shapouri H, Duffield J, & Graboski M. Estimating the Net Energy Balance of Corn Ethanol,
report no. 721. US Dept. of Agriculture, 1995.
Shapouri H, Duffield J, & Wang M. The Net Energy Balance of Corn Ethanol: an Update,
report no. 813. US Dept. of Agriculture, 2002.
Sheehan J, Camobreco V, Duffield J, Graboski M, & Shapouri H. Life Cycle Inventory of
Biodiesel and Petroleum Diesel for Use in an Urban Bus, Final Report. Golden, CO:
National Renewable Energy Laboratory, 1998.
Sidibé S, Blin J, Vaitilingom G, & Azoumah Y. 2010. Use of crude filtered vegetable oil as a
fuel in diesel engines state of the art: Literature review.
Renewable and Sustainable
Energy Reviews 14:2748–2759.
Environmental Impact of Biofuels
206
Soimakallio S, Makinen T, Ekholma T, Pahkala K, Mikkola H, & Paappanen T. 2009.
Greenhouse gas balances of transportation biofuels, electricity and heat generation
in Finland: Dealing with the uncertainties.
Energy Policy 37:80-90.
Stephenson AL, Dennis JS, & Scott SA. 2008. Improving the sustainability of the production
of biodiesel from oilseed rape in the UK.
Process Safety and Environmental Protection
86:427-440.
Tickell J. 2003. From the fryer to the fuel tank – The complete guide to using vegetable oil as
an alternative fuel, 3rd ed., Joshua Tickell Publications, New Orleans, Louisiana.
UFOP (Union zur Förderung von Oel-und Proteinpflanzen e.V.).
Rapeseed Magazine, Rape
Blossom, 2008.
van der Voet E, Lifset RJ, & Luo L. 2010. Life-cycle assessment of biofuels, convergence and
divergence.
Biofuels 1(3):435-449.
Wagner U, Eckl R, & Tzscheutschler P. 2006. Energetic life cycle assessment of fuel cell
powertrain systems and alternative fuels in Germany.
Energy 31(14):3062-3075.
Weidema B, Fress N, Petersen E, & Ølgaard H. Reducing Uncertainty in LCI: Developing a
Data Collection Strategy, Environmental Project No. 862. Denmark, 2003.
Whitaker J, Ludley KE, Rowe R, Taylor G, & Howard DC. 2010. Sources of variability in
greenhouse gas and energy balances for biofuel production: a systematic review.
Global Change Biology Bioenergy 2, pp. 99–112.
Wicke B, Dornburg V, Junginger M, & Faaij A. 2008. Different palm oil production systems
for energy purposes and their greenhouse gas implications.
Biomass & Bioenergy
32(12):1322–1337.
Wilting H. An energy perspective on economic activities. PhD thesis. Groningen, 1996.
Zah R, H Böni, M Gauch, R Hischier, M Lehmann, & P Wäger. Ökobilanz von
Energieprodukten: Ökologische Bewertung von Biotreibstoffen (Life Cycle
Assessment of Energy Products: Environmental Impact Assessment of Biofuels).
EMPA, St. Gallen, Switzerland, 2007.
11
Biofuel Programs in East Asia: Developments,
Perspectives, and Sustainability
Tatsuji Koizumi
Policy Research Institute, Ministry of Agriculture, Forestry and Fisheries
Japan
1. Introduction
The governments of East Asian countries and the region are promoting biofuel programs to
address energy security and environmental problems as well as to increase farm income.
This chapter covers East Asian biofuel programs, including China (People’s Republic of
China), Japan, Korea (Republic of Korea), and Taiwan. China has 205 thousand kℓ of fuel
bioethanol. It is the third-largest biofuel producing country after the U.S. and Brazil
(F.O.Licht, 2010). Verification tests and large-scale projects for biofuel production are
currently underway in China. With Chinese oil imports rising rapidly as a result of
motorization, the Chinese government is expected to expand its bioethanol program in the
future. This expansion is expected to mitigate the country’s dependence on oil imports and
reduce air pollution problems. Although corn is the main feedstock for bioethanol
production, the Chinese government aims to diversify bioethanol production, especially
from cassava, instead of relying on expanded grain-based bioethanol production.
Japan has a long history of producing bioethanol. However, the technologies it once used
were forgotten and remained unused for more than half a century. The enforcement of the
Kyoto Protocol required Japan to start a biofuel program and influenced the start of biofuel
programs in Korea and Taiwan. Japan promotes biofuel production from rice straw, wooden
biomass, and algae. The R&D of second-generation biofuel that is developing in Japan
includes improving varieties of energy resource crops, developing technologies for
manufacturing biofuel, and developing cultivation methods.
The governments of East Asian countries and the region are promoting biofuel programs
that rely on various feedstocks (Table 1), but this reliance and the escalating consumption of
biofuel is competing with food and feed in these countries and the region. Consequently, the
governments of East Asian countries and the region are developing biofuel programs that
will not compete with their food availability.
Several studies have addressed East Asian biofuel production and programs. Koizumi
and Ohga (2007) and Koizumi (2008) examined an economic analysis of the available
supplies of domestically produced biofuel in Asian countries. Wang et al., (2009)
examined the distribution and development of biofuel crops and the bioenergy industry
in China. Chaves et al., (2010) reviewed technical and policy development of Chinese
biofuel, while more recently Wang (2011) reviewed non-food biofuel commercialization in
China.
Environmental Impact of Biofuels
208
Matsumoto et al., (2009) reviewed biofuel initiatives, strategies, policies, and the future
potential of biofuel in Japan. Koizumi (2009) used econometric models to examine how
Chinese bioethanol imports would impact the Brazilian and world sugar markets.
However, these studies for Japan and Asian countries need to update R&D for second-
generation biofuel production. In addition, none of these studies has covered sustainability
criteria for biofuel production. This chapter reviews not only East Asian biofuel production
and programs, but also R&D for second-generation biofuel production and sustainability
criteria for biofuel production in East Asian countries and the region. It also examines the
impacts Chinese and Japanese biofuel import expansion would have on world sugar
markets by applying developed econometric models. The next section covers biofuel
production and policies in East Asian countries and the region. The third section discusses
the impact of biofuel programs on agricultural markets. The fourth section discusses
securing biofuel production, R&D for second-generation biofuel, and the sustainability of
biofuel production. The last section summarizes the conclusion.
Annual Production
(1,000k
Curre nt Main Fe e ds tock
Annual Production
(1,000k
Curre nt Main
Fee dstock
China 2,050 Corn, Wheat and Cassava 191 Used cooking oil
Japan 0.2
Sugarcane molasses, wheat
unsuita ble for food
consumption, and others
10 Used cooking oil
Korea
--
300
Soybean oil, palm oil and
used cooking oil
Taiwan
--
36 Used cooking oil
biodie s e lFuel Bioe thanol
Table 1. Fuel biofuel production and feedstock in East Asia
Source: Chinese and Taiwan’s biofuel production data were derived from F.O.Licht (2010), Japanese
biofuel production data were derived from Ministry of Agriculture, Forestry and Fisheries (2010), and
Korean biofuel data were derived from USDA-FAS (2010).
Note:
1. Chinese bioethanol production was 7.3 million kℓ, Japanese bioethanol production was 100 thousand
kℓ, Korean bioethanol production was 169 thousand kℓ and Taiwan’s bioethanol production was 10
thousand kℓ in 2009 (F.O.Licht, 2010). However, these data nclude industrial, fuel, and other uses.
2. “- ” means unknown.
2. Biofuel production and policies in East Asia
2.1 China
2.1.1 Chinese biofuel program
In China, petroleum consumption is increasing rapidly and imports of crude oil are rising.
The increase in petroleum consumption is causing a serious air pollution problem. In
addition, excessive stocks of grain, especially corn, were crucial problems from 1996 to 2000.
To deal with energy security, air pollution, and excessive grain stocks, the Chinese
government strongly promoted the national bioethanol program.
As a result of high economic growth in China, the number of cars there is increasing rapidly.
From 1990 to 2008, the market for passenger cars grew from 0.51 to 9.38 million. The Chinese
car market has overtaken that of Japan to become the second-largest car market in the
world, with sales of 7.28 million vehicles in 2006 (Wang, 2011). Chinese petroleum
Biofuel Programs in East Asia: Developments, Perspectives, and Sustainability
209
consumption increased from 164 million tons in 1990 to 553 million tons in 2008; and crude
oil imports rose from 2.9 million tons in 1990 to 178.9 million tons in 2008 (National Bureau
of Statistics of China, 2009). After the USA, China is the second-largest petroleum consumer
in the world (International Energy Agency (IEA), 2008). Increasing oil consumption led
China to become a net oil importer from 1994. The IEA has projected that Chinese oil
consumption for transportation use would increase by 5.3% per annum from 2006 to 2030
(IEA, 2008). It is assumed that Chinese oil consumption will expand in the future. However,
a shortage of energy, including petroleum, has been a serious problem since the 1990s.
Proved oil reserves in China amounted to only 1.2% of the total world proved oil reserves at
the end of 2008 (BP, 2009). In addition, rising crude oil prices since 2003 have had a negative
impact on Chinese energy markets, as well as other regions.
The increase in petroleum consumption has caused air pollution problems. Next to the USA,
China is the largest CO
2
emission country in the world (IEA, 2008). The Chinese
Environmental Protection Agency estimated that 79 percent of air pollution originated from
vehicle exhausts (Institute of Chinese Affairs, 2010). The Chinese government wants to
improve the air pollution situation. From 1996 to 2000, it is estimated China had excessive
ending stocks for grain, especially for corn. China is now estimated to have 123.8 million
tons of corn ending stock, which is equivalent to 92.6% of the production level in 1999/2000
(USDA-FAS, 2011). Dealing with excessive ending stocks was one of the crucial problems for
the Chinese government at that time.
In China, the concept of alternative energy was expressly stated in the Five-Year Plan of
1982. In 2001, the promotion of biomass energy was expressly stated in the Five-Year Plan
for the period 2001-2005. In June 2002, the Chinese government started to mandate the use
of bioethanol blend gasoline in five cities of Heilongjiang and Hernan. In October 2004, the
government introduced the compulsory use of a 10 percent blend of bioethanol to gasoline
(E10) in all areas of Heilongjiang, Jilin, Liaoning, Hernan, and Anhui. The government
expanded the E10 program in 27 cities of Shandong, Jiangsu, Hebei, and Hubei from 2006.
2.1.2 Biofuel production
In the Chinese government, the Energy Bureau of the National Development and Reform
Commission (NDRC) leads this whole program; the Ministry of Science and Technology
takes part in technical affairs; the State Grain Administration takes part in the supply of
agricultural feedstock; and the Ministry of Agriculture participates in the rural energy
policy. In China, corn and wheat comprise a major part of the feedstock for bioethanol.
Bioethanol is produced from corn in Heilongjiang, Jilin, and Anhui. It is also produced from
wheat in Hernan. In addition, bioethanol is produced from cassava in Guangxi. Currently,
five bioethanol production plants in China (Table 1) have operating licenses from the
government.
China also produces biodiesel for fuel use. There are four major plants in Fujiang, Jiangsu,
Hebei, and Beijing. Although China’s production capacity has been estimated at 954.2
thousand kℓ (USDA-FAS, 2009a), it produced only 191 thousand kℓ in 2009, because of a
lack of feedstock availability. The main feedstock for biodiesel is used cooking oil. Although
Chinese mills prefer to produce biodiesel from vegetable oil, securing vegetable oil for
biodiesel use can be difficult because China is a net importer of oilseed and vegetable oil.
Securing feedstock is a crucial problem for expanding biodiesel production in China. Biofuel
is sold only to two state-owned companies, China Petroleum and Chemical Corporation
Environmental Impact of Biofuels
210
(Sinopec) and China National Petroleum Corporation (CNPC) for blending with gasoline
(Zhou and Thomson, 2009).
Location Company Main Feedstock
2008 Production
(Estimated:tons)
2009 Production
Capacity (tons)
Supply Location
Heilongjiang,
Zhaodon
g
China Resources
Alcohol Co.
Corn 163,296 163,296 Heilongjiang
Jilin, Jilin Jilin Fuel Ethanol Co. Corn 426,384 453,600 Jilin and Liaoning
Henan, Nanyang
Henan Tian Guan
Fuel-Ethanol Co.
Wheat 371,952 408,240
Henan, Hubei (9 Cities) and
Hebei
(
4Cities
)
Anhui, Bengbu
Anhui BBCA
Biochemical Co.
Corn 362,880 399,168
Anhui, Shandong (7 Cities),
Jiangsu (5 Cities) and Hebei
(
2 Cities
)
Guangxi
Guangxi COFCO
Bioenegry Co.
Cassava 108,864 181,440 Guangxi
Total 1,433,376 1,605,744
Table 2. Current Bioethanol Production
Source: USDA-FAS (2009a).
Note: Rice is partly used for bioethanol production in Heilongjiang.
2.1.3 Production costs and subsidies
In China, the cost of corn-based bioethanol is 4,937 Yuan/ton and the feedstock cost of corn
is 3,456 Yuan/ton (Table 3). The feedstock cost of cassava is 1,716 Yuan/ton and the cost of
cassava-based bioethanol is 4,259 Yuan/ton. The feedstock cost of corn stover is 1,500
Yuan/ton and total cost is 5,800 Yuan/ton. The Chinese bioethanol production cost from
corn is equivalent to 1.022 US$/ℓ
1
, while the U.S. bioethanol production cost from corn was
0.492 US$/ℓ (F.O.Licht, 2008). The cost of Chinese bioethanol production from cassava is
equivalent to 0.882 US$/ℓ
1
, while Thailand’s bioethanol production cost from cassava is
0.300 US$/ℓ (F.O.Licht, 2008). Thus, the cost of Chinese bioethanol production is much
higher than that of the U.S. and Thailand.
Because of high feedstock prices, all bioethanol producers receive subsidies to cover
operating losses. The government subsidy is necessary to produce bioethanol. The average
subsidy for fuel bioethanol production set by the government reached 1,836 Yuan/ton in
2005, 1,625 Yuan/ton in 2006, 1,374 Yuan/ton in 2007, and 1,754 Yuan/ton in 2008
2
. The
average subsidy decreased gradually between 2005 and 2007. However, it increased from
2007 to 2008 because of high feedstock prices resulting from soaring international grain
prices at that time.
In addition, value-added tax (17%) of these plants has been removed (Wang, 2011), five
percent consumption tax on bioethanol has been exempted, and approximately 100 Yuan in
profit is guaranteed for each stock on a preferential basis. Stock grain subsidies are
determined by referencing market prices in each relevant area. The government will cover
any loss incurred as a result of adjustment, transportation, or sale of E10. The Ministry of
Finance will provide a specified amount of compensation. It is estimated that the removal of
Value Added Tax and Consumption Tax totaled 190 million Yuan (US$28 million), and the
1
It is calculated that 1US$ is equivalent to 6.57 Yuan (2011.3).
2
This bioethanol cost is estimated from USDA-FAS (2009a).