Chap 2: Graphical descriptive methods
Bạn đang xem bản rút gọn của tài liệu. Xem và tải ngay bản đầy đủ của tài liệu tại đây (1.19 MB, 77 trang )
Chapter 2
Graphical descriptive methods
Introduction and Re-cap…
Descriptive statistics
involves arranging, summarising, and presenting a
set of data in such a way that useful information is
produced.
Its methods make use of graphical techniques and
numerical descriptive measures (such as averages)
to summarise and present the data.
Data
Statistics
Information
3
Populations and Samples
The graphical and tabular methods presented here apply
to both entire populations and samples drawn from
populations.
Population
Sample
Subset
4
Definitions…
A variable is some characteristic of a population
or sample.
E.g. student grades.
Typically denoted with a capital letter: X, Y, Z…
The values of the variable are the range of
possible values for a variable.
E.g. student marks (0…100)
Data are the observed values of a variable.
E.g. student marks: {67, 74, 71, 83, 93, 55, 48}
5
2.1 Types of Data
Data (at least for purposes of Statistics) fall into
three main groups:
•
Numerical (interval or quantitative) data
•
Nominal (categorical or qualitative) data
•
Ordinal (ranked) data
6
Numerical Data…
Numerical data
•
Real numbers, i.e. heights, weights, prices,
waiting time at a medical practice, etc.
•
Also referred to as quantitative or interval.
•
Arithmetic operations can be performed on
numerical data, thus its meaningful to talk
about 2*Height, or Price + $1, and so on.
7
Nominal Data
•
The values of nominal data are categories.
E.g. responses to questions about marital status are
categories, coded as: Single = 1, Married = 2,
Divorced = 3, Widowed = 4
These data are categorical in nature; arithmetic
operations don’t make any sense (e.g. does
Divorced ÷ 2 = Married?!)
Nominal data are also called qualitative or
categorical.
Nominal Data…
8
Ordinal Data
•
Ordinal data appear to be categorical in
nature, but their values have an order; a
ranking to them:
E.g. University course evaluation system: poor = 1,
fair = 2, good = 3, very good = 4, excellent = 5
While its still not meaningful to do arithmetic on
this data (e.g. does 2*fair = very good?!), we
can say things like:
excellent > poor or fair < very good
That is, order is maintained no matter what
numeric values are assigned to each category.
Ordinal Data…
9
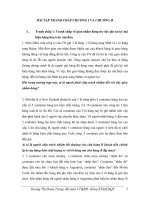
Types of data – Examples
Numerical data Nominal data
age income
55 75 000
42 68 000
. .
. .
age income
55 75 000
42 68 000
. .
. .
weight gain
+10
+5
.
.
weight gain
+10
+5
.
.
person married
1 yes
2 no
3 no
. .
. .
person married
1 yes
2 no
3 no
. .
. .
computer brand
1 IBM
2 Dell
3 Compaq
4 IBM
. .
computer brand
1 IBM
2 Dell
3 Compaq
4 IBM
. .
IBM Dell Compaq other total
25 11 8 6 50
50% 22% 16% 12%
IBM Dell Compaq other total
25 11 8 6 50
50% 22% 16% 12%
With nominal data, all we
can calculate is the
proportion of data that
falls into each category.
exam grade
HD
D
C
P
F
exam grade
HD
D
C
P
F
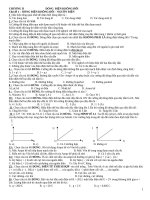
Ordinal data
Food quality
Excellent
Good
Satisfactory
Poor
Food quality
Excellent
Good
Satisfactory
Poor
With ordinal data, all we
can use is computations
involving the ordering
process.
10
Calculations for Types of Data
As mentioned above,
• All calculations are permitted on interval data.
•
No calculations are allowed for nominal data,
except counting the number of observations in
each category and calculating their proportions.
•
Only calculations involving a ranking process
are allowed for ordinal data.
This lends itself to the following ‘hierarchy of
data’…
11
Hierarchy of Data…
Numerical
•
Values are real numbers.
•
All calculations are valid.
•
Data may be treated as ordinal or nominal.
Nominal
•
Values are the arbitrary numbers that represent
categories.
•
Only calculations based on the frequencies of occurrence
are valid.
•
Data may not be treated as ordinal or numerical.
Ordinal
•
Values must represent the ranked order of the data.
•
Calculations based on an ordering process are valid.
•
Data may be treated as nominal but not as numerical.
12
Other Forms of Data
•
Cross-sectional data is collected at a certain
point in time across a number of units of
interest
–
marketing survey (observe preferences by
gender, age)
–
test score in a statistics course exam
–
starting salaries of graduates of an MBA
program in a particular year.
•
Time-series data is collected over successive
points in time
–
weekly closing price of gold
–
monthly tourist arrivals in Australia.
13
2.2 Graphical and tabular
techniques for nominal data
The only allowable calculation on nominal data is
to count the frequency of each value of the
variable.
We can summarise the data in a table that
presents the categories and their counts called a
frequency distribution.
A relative frequency distribution lists the
categories and the proportion with which each
occurs.
14
Introduction
•
The methods presented apply to both
–
the entire population, and
–
a sample selected from the population.
15
Graphical techniques
for nominal data
•
The graphical presentations shown here
are used primarily for nominal data.
• These graphical tools are most appropriate
when the raw data can be naturally
categorised in a meaningful manner.
16
Bar charts
• The bar chart is mainly used for nominal
data.
•
A bar chart graphically represents the
frequency of each category as a bar rising
vertically from the horizontal axis
• The height of each bar is proportional to the
frequency of the corresponding category.
17
•
Another useful chart to present nominal
data is the pie chart.
•
The pie chart is a very popular tool used to
represent the proportions of appearance for
nominal data.
•
A pie chart is a circle that is subdivided into
slices whose areas are proportional to the
frequencies (or relative frequencies),
thereby displaying the proportion of
occurrences of each category.
Pie charts
18
Example 2.1
•
To determine the approximate market share of
various women’s magazines in New Zealand, a
women’s magazine readership survey was
conducted using a sample of 200 readers.
•
Data was collected and the count of the
occurrences (frequencies) was recorded for each
magazine.
•
The frequencies were presented in a bar chart.
•
Then the frequencies were converted to
proportions and the results were presented in a
pie chart.
19
Example 2.1
1 = Australian Women’s Weekly (NZ Edition); 2 = Next;
3 = NZ New Idea; 4 = NZ Woman’s Day; 5 = NZ Women’s
Weekly; and 6 = That’s Life.
20
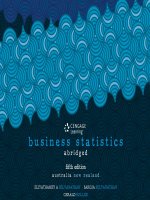
Example 2.1 cont. (Excel representation)
21
The size of each slice in a pie chart is proportional
to the percentage corresponding to the category it
represents.
(10/100)(360
0
) = 36
0
22
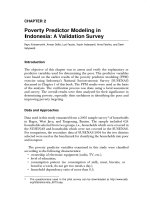
–
Use bar charts also when the order in which
data are presented is meaningful.
Trend in total exports, Australia, 1992–2009
Trend in total exports, Australia, 1992–2009
23
24
2.3 Graphical Techniques for
Numerical Data
There are several graphical methods that are
used when the data are numerical (i.e.
quantitative, non-categorical).
The most important of these graphical methods
is the histogram.
The histogram is not only a powerful graphical
technique used to summarise interval data, but
it is also used to help explain probabilities.
Example 2.5
•
Providing information concerning the
monthly bills of new subscribers in the
first month after signing on with a
telephone company
–
collect data
–
prepare a frequency distribution
– draw a histogram.
25