Astm e 1808 96 (2015)
Bạn đang xem bản rút gọn của tài liệu. Xem và tải ngay bản đầy đủ của tài liệu tại đây (134.81 KB, 8 trang )
Designation: E1808 − 96 (Reapproved 2015)
Standard Guide for
Designing and Conducting Visual Experiments1
This standard is issued under the fixed designation E1808; the number immediately following the designation indicates the year of
original adoption or, in the case of revision, the year of last revision. A number in parentheses indicates the year of last reapproval. A
superscript epsilon (´) indicates an editorial change since the last revision or reapproval.
E1499 Guide for Selection, Evaluation, and Training of
Observers
1. Scope
1.1 This guide is intended to help the user decide on the type
of viewing conditions, visual scaling methods, and analysis
that should be used to obtain reliable visual data.
3. Terminology
3.1 The terms and definitions in Terminology E284 are
applicable to this guide.
1.2 This guide is intended to illustrate the techniques that
lead to visual observations that can be correlated with objective
instrumental measurements of appearance attributes of objects.
The establishment of both parts of such correlations is an
objective of Committee E12.
3.2 Definitions:
3.2.1 appearance, n—in psychophysical studies, perception
in which the spectral and geometric aspects of a visual stimulus
are integrated with its illuminating and viewing environment.
1.3 Among ASTM standards making use of visual observations are Practices D1535, D1729, D3134, D4086, and E1478;
Test Methods D2616, D3928, and D4449; and Guide E1499.
1.4 This standard does not purport to address all of the
safety concerns, if any, associated with its use. It is the
responsibility of the user of this standard to establish appropriate safety and health practices and determine the applicability of regulatory limitations prior to use.
3.2.2 observer, n—one who judges visually, qualitatively or
quantitatively, the content of one or more appearance attributes
in each member of a set of stimuli.
3.2.3 sample, n—a small part or portion of a material or
product intended to be representative of the whole.
3.2.4 scale, v—to assess the content of one or more appearance attributes in the members of a set of stimuli.
3.2.4.1 Discussion—Alternatively, scales may be determined by assessing the difference in content of an attribute
with respect to the differences in that attribute among the
members of the set.
2. Referenced Documents
2.1 ASTM Standards:2
D1535 Practice for Specifying Color by the Munsell System
D1729 Practice for Visual Appraisal of Colors and Color
Differences of Diffusely-Illuminated Opaque Materials
D2616 Test Method for Evaluation of Visual Color Difference With a Gray Scale
D3134 Practice for Establishing Color and Gloss Tolerances
D3928 Test Method for Evaluation of Gloss or Sheen
Uniformity
D4086 Practice for Visual Evaluation of Metamerism
D4449 Test Method for Visual Evaluation of Gloss Differences Between Surfaces of Similar Appearance
E284 Terminology of Appearance
E1478 Practice for Visual Color Evaluation of Transparent
Sheet Materials
3.2.5 specimen, n—a piece or portion of a sample used to
make a test.
3.2.6 stimulus, n—any action or condition that has the
potential for evoking a response.
3.3 Definitions of Terms Specific to This Standard:
3.3.1 anchor, n—the stimulus from which a just-perceptible
difference is measured.
3.3.2 anchor pair, n—a pair of stimuli differing by a defined
amount, to which the difference between two test stimuli is
compared.
3.3.3 interval scale, n—a scale having equal intervals between elements.
3.3.3.1 Discussion—Logical operations such as greaterthan, less-than, equal-to, and addition and subtraction can be
performed with interval-scale data.
1
This guide is under the jurisdiction of ASTM Committee E12 on Color and
Appearance and is the direct responsibility of Subcommittee E12.11 on Visual
Methods.
Current edition approved Nov. 1, 2015. Published November 2015. Originally
approved in 1996. Last previous edition approved in 2009 as E1808 – 96 (2009).
DOI: 10.1520/E1808-96R15.
2
For referenced ASTM standards, visit the ASTM website, www.astm.org, or
contact ASTM Customer Service at For Annual Book of ASTM
Standards volume information, refer to the standard’s Document Summary page on
the ASTM website.
3.3.4 law of comparative judgments—an equation relating
the proportion of times any stimulus is judged greater, according to some attribute, than any other stimulus in terms of
just-perceptible differences.
Copyright © ASTM International, 100 Barr Harbor Drive, PO Box C700, West Conshohocken, PA 19428-2959. United States
1
E1808 − 96 (2015)
the experiments. To achieve this, it is essential to control both
the spectral character and the amount of illumination closely in
both space and time. Failure to accomplish this can seriously
undermine the integrity of the experiments. The spectral power
distribution of the illumination should be known or, if this is
not possible, the light source should be identified as to type and
manufacturer. Information such as daylight-corrected fluorescent light, warm-white fluorescent light, daylight-filtered incandescent light, incandescent light, etc., together with parameters such as correlated color temperature and color rendering
index, if available, should be noted in the report of the
experiment.
3.3.5 nominal scale, n—scale in which items are scaled
simply by name.
3.3.5.1 Discussion—Only naming can be performed with
nominal-scale data.
3.3.6 ordinal scale, n—a scale in which elements are sorted
in order based on more or less of a particular attribute.
3.3.6.1 Discussion—Logical operations such as greaterthan, less-than, or equal-to can be performed with ordinal-scale
data.
3.3.7 psychometric function, n—the function, typically
sigmoidal, relating the probability of detecting a stimulus to the
stimulus intensity.
3.3.8 psychophysics, n—the study of the functions relating
the physical measurements of stimuli and the sensations and
perceptions the stimuli evoke.
3.3.9 ratio scale, n—a scale which, in addition to the
properties of other scales, has a meaningfully defined zero
point.
3.3.9.1 Discussion—In addition to the logical operations
performable with other types of data, multiplication and
division can be performed with ratio-scale data.
3.3.10 scale, n—a defined arrangement of the elements of a
set of stimuli or responses.
5.2 Viewing Geometry—Almost all specimens exhibit some
degree of gonioapparent or goniochromatic variation; therefore
the illuminating and viewing angles must be controlled and
specified. This is particularly important in the study of specimens exhibiting gloss variations, textiles showing
directionality, or gonioapparent (containing metallic or pearlescent pigments) or retroreflective specimens, among others.
This control and specification can range from correct positioning of the source and observer and the elimination of any
secondary light sources visible in the specimens, for the
judgment of gloss specimens at and near the specular angle, to
more elaborate procedures specifying a range of angles and
aperture angles of illumination and viewing for gonioapparent
and retroreflective specimens. When fluorescent specimens are
studied, the spectral power distribution of the source must
closely match that of a designated standard source.
4. Summary of Guide
4.1 This guide provides an overview of experimental design
and data analysis techniques for visual experiments. Carefully
conducted visual experiments allow accurate quantitative
evaluation of perceptual phenomena that are often thought of
as being completely subjective. Such results can be of immense
value in a wide variety of fields, including the formulation of
colored materials and the evaluation of the perceived quality of
products.
5.3 Surround and Ambient Field—For critical visual scaling
work, the surround, the portion of the visual field immediately
surrounding the specimens, should have a color similar to that
of the specimens. The ambient field, the field of view when the
observer glances away from the specimens, should have a
neutral color (Munsell Chroma less than 0.2) and a Munsell
Value of N6 to N7 (luminous reflectance 29 to 42); see Practice
D1729).
4.2 This guide includes a review of issues regarding the
choice and design of viewing environments, an overview of
various classes of visual experiments, and a review of experimental techniques for threshold, matching, and scaling experiments. It also reviews data reduction and analysis procedures.
Three different threshold and matching techniques are
explained, the methods of adjustment, limits, and constant
stimuli. Perceptual scaling techniques reviewed include
ranking, graphical rating, category scaling, paired
comparisons, triadic combinations, partitioning, and magnitude
estimation or production. Brief descriptions and examples,
along with references to more detailed literature, are given on
the appropriate types of data analysis for each experimental
technique.
5.4 Observers—Guide E1499 describes the selection,
evaluation, and training of observers for visual scaling work.
Of particular importance is the testing of the observers’ color
vision and their color discrimination for normality. Color
vision tests for this purpose are described in Guide E1499.
6. Categories of Visual Experiments
6.1 Visual experiments tend to fall into two broad classes:
(1) threshold and matching experiments designed to measure
visual sensitivity to small changes in stimuli (or perceptual
equality), and (2) scaling experiments intended to generate a
psychophysical relationship between the perceptual and physical magnitudes of a stimulus. It is critical to determine first
which class of experiment is appropriate for a given application.
6.1.1 Threshold and Matching Experiments—Threshold experiments are designed to determine the just-perceptible difference in a stimulus, or JPD. Threshold techniques are used to
measure the observers’ sensitivity to a given stimulus. Absolute
thresholds are defined as the JPD for a change from no
stimulus, while difference thresholds represent the JPD from a
4.3 For reviews of topics in other than visual sensory testing
within ASTM, see Refs (1, 2).3
5. Viewing Conditions
5.1 Light Source—The illumination of the specimens in
scaling experiments must be reproducible over the course of
3
The boldface numbers in parentheses refer to a list of references at the end of
this guide.
2
E1808 − 96 (2015)
meaningful zero point on an interval scale. A common example
of an interval scale is the Celsius temperature scale. In addition
to the mathematical operations listed for nominal and ordinal
scales, addition and subtraction can be performed with
interval-scale data.
6.1.2.4 Ratio Scales—Ratio scales have all the properties of
the above scales plus a meaningfully defined zero point. Thus
it is possible to equate ratios of numbers meaningfully with a
ratio scale. Ratio scales are often impossible to obtain in visual
work. An example of a ratio scale is the absolute, or Kelvin,
temperature scale. All of the mathematical operations that can
be performed on interval-scale data can also be performed on
ratio-scale data, and in addition, multiplication and division
can be performed.
particular stimulus level greater than zero. The stimulus from
which a difference threshold is measured is known as an anchor
stimulus. Often, thresholds are measured with respect to the
difference between two stimuli. In such cases, the difference of
a pair of stimuli is compared to the difference in an anchor pair.
Absolute thresholds are reported in terms of the physical units
used to measure the stimulus, for example, a brightness
threshold might be measured in luminance units of candelas
per square metre. Sensitivity is measured as the inverse of the
threshold, since a low threshold implies high sensitivity.
Threshold techniques are useful for defining visual tolerances,
such as color-difference tolerances. Matching techniques are
similar, except that the goal is to determine when two stimuli
are not perceptibly different. Measures of the variability in
matching can be used to estimate thresholds. Matching experiments provided the basis for CIE colorimetry through the
metameric matches used to derive the color-matching functions
of the CIE standard observers.
6.1.2 Scaling Experiments—Scaling experiments are intended to derive relationships between perceptual magnitudes
and physical magnitudes of stimuli. Several decisions must be
made, depending on the type and dimensionality of the scale
required. It is important to identify the type of scale required
and decide on the scaling method to be used before any scaling
data are collected. This seems to be an obvious point, but in the
rush to acquire data it is often overlooked, and later it may be
found that the data obtained do not yield the answer required or
cannot be used to perform desired mathematical operations.
See Refs (3, 4) for further details. Scales are classified into the
following four classes:
6.1.2.1 Nominal Scales—Nominal scales are relatively
trivial in that they scale items simply by name. For color, a
nominal scale might consist of reds, yellows, greens, blues, and
neutrals. Scaling in this case would simply require deciding
which color belonged in which category. Only naming can be
performed with nominal data.
6.1.2.2 Ordinal Scales—Ordinal scales are scales in which
elements are sorted in ascending or descending order based on
more or less of a particular attribute. A box of multicolored
crayons could be sorted by hue, and then in each hue family,
say red, the crayons could be sorted from the lightest to the
darkest. In a box of crayons the colors are not evenly spaced,
so one might have, for example, three dark, one medium, and
two light reds. If these colors were numbered from one to six
in increasing lightness, an ordinal scale would be created. Note
that there is no information on such a scale as to the magnitude
of difference from one of the reds to another, and it is clear that
they are not evenly spaced. For an ordinal scale, it is sufficient
that the specimens be arranged in increasing or decreasing
amounts of an attribute. The spacing between specimens can be
large or small and can change up and down the scale. Logical
operations such as greater-than, less-than, or equal-to can be
performed with ordinal-scale data.
6.1.2.3 Interval Scales—Interval scales have equal intervals.
On an interval scale, if a pair of specimens were separated by
two units, and a second pair at some other point on the scale
were also separated by two units, the differences between the
pair members would appear equal. However, there is no
7. Threshold and Matching Methods
7.1 Several basic types of threshold experiments are presented in this section in order of increasing complexity of
design and utility of the data generated. Many modifications of
these techniques have been developed for specific applications.
Experimenters should strive to design an experiment that
removes as much control of the results from the observers as
possible, thus minimizing the influence of variable observer
judgment criteria. Generally, this comes at the cost of implementing a more complicated experimental procedure.
7.1.1 Method of Adjustment—The method of adjustment is
the simplest and most straightforward technique for deriving
threshold data. In it, the observer controls the stimulus magnitude and adjusts it to a point that is just perceptible (absolute
threshold) or just perceptibly different (difference threshold).
The threshold is taken to be the mean setting across a number
of trials by one or more observers. The method of adjustment
has the advantage that it is quick and easy to implement.
However, it has a major disadvantage in that the observer is in
control of the stimulus. This can bias the results due to
variability of observers’ criteria and adaptation effects. If an
observer approaches the threshold from above, adaptation
might result in a higher threshold than if it were approached
from below. Often the method of adjustment is used to obtain
a first estimate of the threshold, to be used in the design of
more sophisticated experiments. The method of adjustment is
also commonly used in matching experiments.
7.1.2 Method of Limits—The method of limits is only
slightly more complex than the method of adjustment. In the
method of limits, the experimenter presents the stimuli at
predefined discrete magnitude levels in either ascending or
descending series. For an ascending series, the experimenter
presents a stimulus, beginning with one that is certain to be
imperceptible, and asks the observer if it is visible. If the
observer responds no, the experimenter increases the stimulus
magnitude and presents another trial. This continues until the
observer responds yes. A descending series begins with a
stimulus magnitude that is clearly perceptible and continues
until the observer responds no, the stimulus cannot be perceived. The threshold is taken to be the average stimulus
magnitude at which the transition between yes and no responses occurs for a number of ascending and descending
3
E1808 − 96 (2015)
the response is correct, the same stimulus magnitude is
presented again. If the response is incorrect, the stimulus
magnitude is increased for the next trial. Generally, if the
observer responds correctly on three consecutive trials, the
stimulus magnitude is decreased. The stimulus magnitude steps
are decreased until some desired precision in the threshold is
reached. The sequence of 3-correct or 1-incorrect response
prior to changing the stimulus magnitude results in convergence to a stimulus magnitude that is correctly identified in
79 % of the trials, very close to the nominal threshold of 75 %.
Often several independent staircase procedures are run simultaneously to randomize the experiment further. A staircase
procedure can also be run with yes-no or pass-fail responses.
series. Averaging over both types of series minimizes adaptation effects. However, the observers are still in control of their
criteria since they can respond yes or no at their own
discretion.
7.1.3 Method of Constant Stimuli—In the method of constant stimuli, the experimenter chooses several stimulus magnitude levels (usually five or seven) around the level of the
threshold. These stimuli are each presented to the observer
several times, in random order. The frequency, over the trials,
with which each stimulus is perceived is determined. From
such data, a “frequency-of-seeing” curve, or psychometric
function, can be derived that allows determination of the
threshold and its uncertainty. The threshold is generally taken
to be the stimulus magnitude at which it is perceived in 50 %
of the trials. Psychometric functions can be derived for either
a single observer (through multiple trials) or a population of
observers (one or more trials per observer). Two types of
response can be obtained: yes-no (or pass-fail) and forced
choice.
7.1.3.1 Yes-No Procedures—In a yes-no or pass-fail method
of constant stimuli procedure, the observers are asked to
respond yes if they detect the stimulus (or stimulus change) and
no if they do not. The psychometric function is the percent of
yes responses as a function of stimulus magnitude. Fifty
percent yes responses would be taken as the threshold level.
Alternatively, this procedure can be used to measure visual
tolerances above threshold by providing a reference stimulus
magnitude (for example, a color-difference anchor pair) and
asking the observers to pass stimuli that fall below the
magnitude of the reference (have a smaller color difference
than the anchor pair), and fail those that fall above it (have a
larger color difference). The psychometric function is the
percent of fail responses as a function of stimulus magnitude
and the 50 % fail level is taken as the point of visual equality.
7.1.3.2 Forced-Choice Procedures—A forced-choice procedure eliminates the influence of varying observer criteria on the
results, by presenting the stimulus in one of two intervals with
a defined boundary between them. The observers are asked to
indicate in which of the two intervals the stimulus was
presented. They are not allowed to respond that the stimulus
was not present in either interval, and are forced to guess which
interval it was in if they are unsure, hence the name “forced
choice.” The psychometric function is the percent of correct
responses as a function of stimulus magnitude. The psychometric function ranges from 50 % correct when the observers
are simply guessing to 100 % correct for stimulus magnitudes
at which the stimulus can always be detected. Thus the
threshold is defined as the stimulus magnitude at which the
observers are correct 75 % of the time and therefore detecting
the stimulus 50 % of the time. As long as the observers respond
honestly, their criteria, whether liberal or conservative, cannot
influence the results.
7.1.3.3 Staircase Procedures—Staircase procedures are
modifications of the forced-choice procedure designed to
measure only the threshold point on the psychometric function.
Staircase procedures are particularly applicable to situations in
which the stimulus presentations can be fully automated. A
stimulus is presented and the observer is asked to respond. If
8. Scaling Methods
8.1 Dimensionality—Scaling methods can be divided into
two groups: unidimensional (one-dimensional) and multidimensional scaling.
8.1.1 Unidimensional Scaling—This method assumes that
both the attribute to be scaled and the physical variation of the
stimulus are unidimensional. The observers are asked to make
their judgments on a single perceptual attribute. In color work,
common examples include judging the color difference in a
pair of specimens or judging the lightness of one specimen
relative to that of another in a series of colors in which hue and
chroma are constant.
8.1.1.1 Cross-Modality Scaling—It is also possible in color
work to judge one attribute of a pair of specimens but express
the results in terms of another attribute, displayed on a scale
made up of anchor pairs. An example is the use of a gray scale,
in which differences in total color difference, or chroma, or hue
are judged by comparison to anchor pairs presented in the form
of gray-scale pairs, in which the variable attribute is lightness
(see Test Method D2616).
8.1.2 Multidimensional Scaling—This method of scaling is
similar to unidimensional scaling but it does not make the
assumption that a single attribute is to be scaled. The dimensionality of the experiment is found as part of the analysis. In
multidimensional scaling the data are interval or ordinal scales
of the similarities or dissimilarities between all possible pairs
of stimuli and the resulting output is a multidimensional
geometric configuration of the perceptual relationships among
the stimuli. For example, the flying distances among a welldistributed sampling of USA cities can be used to reconstruct
a map of the country (see 9.1.3.1 and 9.1.3.2).
8.2 Scaling Methods—A variety of scaling techniques has
been devised. It is important to determine first the level of scale
required, that is, nominal, ordinal, interval, or ratio, and then
choose the technique that provides the simplest task for the
observer while still generating data that can be used to derive
the required scale.
8.2.1 Rank Order—Given a set of specimens, the observer is
asked to arrange them according to increasing or decreasing
magnitudes of a particular perceptual attribute. With a large
number of observers, the data may be averaged and re-ranked
to obtain an ordinal scale. To obtain an interval scale, certain
assumptions about the data must be made and additional
4
E1808 − 96 (2015)
of the few techniques that can be used to generate a ratio scale.
It can also be used to generate data for multidimensional
scaling by asking observers to scale the differences between
pairs of stimuli.
8.2.8 Ratio Estimation and Production—The observers are
asked for judgments in one of two ways: either to select or
produce a specimen that bears some prescribed ratio to a
standard; or, given two or more specimens, to state the
apparent ratios among them. A typical experiment is to give the
observers a specimen and ask them to find, select, or produce
a specimen that is one half or twice the standard in some
attribute. For most practical visual work this method is too
difficult to use, because of problems in either specimen
preparation or the observers’ judgments. However, it can be
used to generate a ratio scale.
analyses performed. In general it is not recommended that one
attempt to derive interval scales from rank-order data.
8.2.2 Graphical Rating—Graphical rating allows direct determination of an interval scale. Observers are presented
stimuli and asked to indicate the magnitude of their perceptions
on a unidimensional scale with fixed anchor points. For
example, in a lightness scaling experiment a line might be
drawn with one end labeled white and the other black. When
the observers are presented with a medium gray specimen that
is perceptually half way between white and black, they would
make a mark on the line at the midpoint. If the specimen was
closer to white than to black, they would make a mark at the
appropriate physical location along the line, closer to the end
labeled white. The interval scale is made up of the mean
locations on the graphical scale for each of the stimuli. This
technique relies on the well-established fact that the perception
of length over short distances is linear with respect to physically measured length.
8.2.3 Category Scaling—Several observers are asked to
separate a large number of specimens into various categories.
The number of times each specimen is placed in a given
category is recorded. For this to be an effective scaling method
the samples must be similar enough that they are not always
placed in the same category by different observers or even by
the same observer on different occasions. Interval scales may
be obtained by this method by assuming that the perceptual
magnitudes are normally distributed and making use of the unit
normal distribution.
8.2.4 Paired Comparisons—This method presents all specimens in all possible pairs to the observer, usually one pair at a
time. The proportion of times a particular specimen is judged
greater in some attribute than each other specimen is calculated
and recorded. Interval scales may be obtained from such data
by applying Thurstone’s Law of Comparative Judgments (see
3.3.4, and Ref (4), p. 458). This analysis results in an interval
scale on which the perceptual magnitudes of the stimuli are
normally distributed.
8.2.5 Triadic Combinations—The method of triadic combinations is useful for deriving similarity data for multidimensional analysis. Observers are presented with each possible
combination of the stimuli taken three at a time. They are asked
to judge which two of the stimuli in the triad are most similar
to one another and which two are most different. The data can
be converted to proportions of times each pair is judged most
similar or most different. These data can be combined into
either a similarity or a dissimilarity matrix for use in multidimensional scaling analyses.
8.2.6 Partition Judgments—The usual method of equating
intervals is by bisection. The observer is given two specimens
(No. 1 and No. 2) and asked to select a third specimen such that
the difference between it and No. 1 appears equal to the
difference between it and No. 2. A full interval scale may be
obtained by successive bisections.
8.2.7 Magnitude Estimation and Production—The observers are asked to assign numbers to the stimuli according to the
magnitude of their perceptions. (See 6.4 of Guide E1499.)
Alternatively, the observers are given a number and asked to
produce a stimulus with that perceptual magnitude. This is one
TABLE 1 Data for Two-Alternative Fixed-Choice Color-Difference
Experiment
∆E*ab
Observations
Correct Responses
0.52
0.82
1.05
1.19
1.66
50
50
50
50
50
27
32
36
44
49
9. Methods of Analysis
9.1 Deciding on the Method of Analysis—In most cases, the
scaling method selected determines the method of analysis.
Several scaling methods and the first steps of the subsequent
analyses are described in Sections 7 and 8. Often the data
require further, more detailed analyses to reach a perceptual
threshold or scale. This section describes some of these
analyses and provides a few examples.
9.1.1 Threshold and Matching—Threshold data that generate a psychometric function can be most usefully analyzed
using Probit analysis (5). Probit analysis is used to fit a
cumulative normal distribution to the data of the psychometric
function. The threshold point and its uncertainty can easily be
determined from the fitted distribution. There are also several
significance tests that can be performed to verify the suitability
of the analyses. Reference (5) provides details on the theory
and application of Probit analysis. Several commercially available statistical software packages can be used to perform Probit
analyses.4 When evaluating a software package for use in
Probit analysis, one should look for output that includes
fiducial limits (confidence regions) and goodness-of-fit metrics
and the ability to select the chance behavior probability,
sometimes referred to as the false-alarm rate.
9.1.1.1 Example: Two-Alternative Forced-Choice Threshold
Determination—An experiment was carried out in which
observers were shown two colored stimuli and asked which
one was different from a standard color. One of the two stimuli
was identical to the standard, the other was one of five-test
stimuli. The data consisted of the CIELAB color differences,
∆E*ab, between the standard and each of the five-test stimuli,
4
One example of such software is SAS, available from SAS Institute, Inc., P.O.
Box 8000, Cary, NC 27511.
5
E1808 − 96 (2015)
TABLE 3 Proportions for Which the Photographic System
Represented by the Column was Judged Superior to the System
Represented by the Row
the number of observations (observers, in this case), and the
number of correct responses. These data are listed in Table 1.
9.1.1.2 The data were analyzed using Probit analysis, in
which a cumulative-normal distribution is fitted to the proportion of correct responses as a function of ∆E*ab. A χ2 test is
used to determine whether a cumulative-normal distribution
appropriately describes the data. For this example, the χ2 is
1.13 with 3 df. This results in a probability-greater-than-χ2 of
0.77 indicating that the fit is good (a probability value greater
than 0.1 is considered good). The key datum from the fitted
distribution is the value of ∆E*ab at which 75 % of the
observers correctly identified a color difference (this value is
considered the perceptual threshold). Recall that 50 % correct
responses represents chance behavior. For these data, the
threshold ∆E*ab is 1.03 with a 95 % confidence region extending from 0.86 to 1.14. Examination of the input data shows that
there are 72 % correct responses at a ∆E*ab of 1.05. This might
lead one to believe that the threshold should be at a ∆E*ab
slightly greater than 1.05. This is not the case, since the Probit
analysis uses the entire data range to fit a normal distribution
for the best estimate of the true threshold. Any individual data
point may not fit the best estimate perfectly and should not be
relied on.
9.1.2 Unidimensional Scaling—Thurstone’s Law of Comparative Judgments and its extensions can be applied usefully
to ordinal data, such as those from paired comparisons and
category scaling, to derive meaningful interval scales. The
perceptual magnitudes of the stimuli are normally distributed
on the resulting scales. Thus, if it is safe to assume that the
perceptual magnitudes are normally distributed on the true
perceptual scale, these analyses derive the desired scale. They
also allow useful evaluation of the statistical significance of
differences between stimuli since the power of the normal
distribution can be utilized. References (4, 6) describe these
and other related analyses in detail.
9.1.2.1 Example: Unidimensional Scaling by Paired
Comparisons—An experiment was carried out in which the
perceived quality of five different photographic systems was
compared. Observers were asked to judge each paired combination of output from the five systems (10 pairs) and respond
as to which print in each pair was of better overall quality. The
data can be expressed as a frequency matrix in which the
number of times a system represented by a given column was
judged superior to the system represented by a given row. Table
2 shows the frequency matrix for this experiment. The data
were then converted to proportions by dividing each element of
the matrix in Table 2 by the number of observers, 18, to
produce the proportion matrix shown in Table 3.
A
B
C
D
E
A
B
C
D
E
...
6
10
12
13
12
...
12
11
13
8
6
...
10
13
6
7
8
...
12
5
5
5
6
...
B
C
D
E
0.67
...
0.67
0.61
0.72
0.44
0.33
...
0.56
0.72
0.33
0.39
0.44
...
0.67
0.28
0.28
0.28
0.33
...
TABLE 4 Abridged Table for Conversion of Proportions, p, into
Normal Deviates, z
NOTE 1—The proportion, p, is the area under the standard normal
distribution curve integrated from minus infinity to z.
p
z
p
z
p
z
0.04
0.08
0.12
0.16
0.20
0.24
0.28
0.32
−1.75
−1.41
−1.17
−0.99
−0.84
−0.71
−0.58
−0.47
0.36
0.40
0.44
0.48
0.52
0.56
0.60
0.64
−0.36
−0.25
−0.15
−0.05
0.05
0.15
0.25
0.36
0.68
0.72
0.76
0.80
0.84
0.88
0.92
0.96
0.47
0.58
0.71
0.84
0.99
1.17
1.41
1.75
TABLE 5 Normal Deviates Indicating the Perceptual Difference in
Quality Among the Various Systems
A
B
C
D
E
A
B
C
D
E
0.0
−0.44
0.15
0.44
0.58
0.44
0.0
0.44
0.28
0.58
−0.15
−0.44
0.0
0.15
0.58
−0.44
−0.28
−0.15
0.0
0.44
−0.58
−0.58
−0.58
−0.44
0.0
TABLE 6 Unidimensional Scale of Perceived Quality of Five
Photographic Systems
System
Scale Value
A
B
C
D
E
0.15
0.35
0.03
−0.09
−0.44
9.1.2.2 The proportions in Table 3 are converted to normal
deviates (sometimes referred to as z-scores) using a table of the
standard normal distribution. An abridgment of this table is
given in Table 4. These values can be thought of as distances
between successive stimuli on the perceptual quality scale in
units of standard deviations. The z-score values for the proportions in Table 3 are given in Table 5. Since a stimulus is never
judged against itself, the diagonal values of this matrix are set
to zero; by definition, the perceptual distance between a
stimulus and itself is zero.
9.1.2.3 A unidimensional scale is constructed by averaging
the columns of the matrix of Table 5. For this example, the
resulting scale is given in Table 6. Ninety-five percent confidence limits about each scale value can be calculated by taking
advantage of the fact that the scale is constructed in units of
standard deviations. In general, the 95 % confidence region is
defined by the interval of 61.38/√N, where N is the number of
observations. In this example, the confidence limits are 60.33
unit.
TABLE 2 Frequencies with Which the Photographic System
Represented by the Column was Judged Superior by 18
Observers to the System Represented by the Row
A
B
C
D
E
A
...
0.33
0.56
0.67
0.72
6
E1808 − 96 (2015)
TABLE 7 Dissimilarity Matrix Consisting of Distances Between Cities in the U.S.A.
Atlanta
Boston
Chicago
Dallas
Denver
Los Angeles
Seattle
New York City
Atlanta
Boston
Chicago
Dallas
Denver
Los Angeles
Seattle
New York City
...
1037
674
795
1398
2182
2618
841
...
...
963
1748
1949
2979
2976
206
...
...
...
917
996
2054
2013
802
...
...
...
...
781
1387
2078
1552
...
...
...
...
...
1059
1307
1771
...
...
...
...
...
...
1131
2786
...
...
...
...
...
...
...
2815
...
...
...
...
...
...
...
...
TABLE 8 Multidimensional Scaling Example Output of TwoDimensional Coordinates of the U.S.A. Cities Used in the Sample
Experiment
9.1.3 Multidimensional Scaling—Multidimensional scaling
(MDS) techniques take similarity or dissimilarity data as input
and produce a multidimensional configuration of points representing the relationships and dimensionality of the data. It is
necessary to use such techniques when either the perception in
question is multidimensional (such as color, with the dimensions hue, lightness, and chroma) or the physical variation in
the stimuli is multidimensional. References (7, 8)provide
details of these techniques. There are several issues with
respect to MDS analyses. There are two classes of MDS:
metric, which requires interval data, and nonmetric, which only
requires ordinal data. Both classes result in interval-scale
output. Various MDS software packages require specific assumptions regarding the input data, treatment of individual
cases, goodness-of-fit metrics (stress), distance metrics (for
example, Euclidean or city-block), etc. Users should understand clearly that they cannot indiscriminately put ordinal or
interval data into a program without being familiar with its
basic assumptions. Several commercial statistical software
packages,4,5 provide MDS capabilities. Features to look for
when choosing MDS software include metric versus nonmetric
scaling, stress metrics, choice of distance metrics, and selection
of dimensionality.
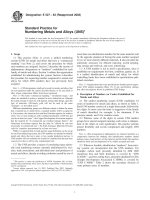
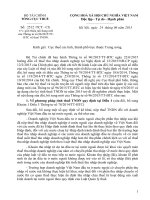
9.1.3.1 Example: MDS of U.S.A. Map—A classic example
of MDS analysis is the construction of a map from data
representing the distances between cities (7). In this example,
a map of the U.S.A. is constructed from the dissimilarity
matrix of distances among eight cities gathered from a road
atlas as illustrated in Table 7. These data are analyzed by MDS.
Stress (root-mean-square error) is used as a measure of
goodness-of-fit to determine the dimensionality of the data. In
this example, the stress of a unidimensional fit is about 0.12,
while the stress in two or more dimensions is essentially zero.
This indicates that a two-dimensional fit, as expected, is
appropriate. The results include the coordinates in each of the
two dimensions for each of the cities, and are listed in Table 8.
9.1.3.2 Plotting the coordinates of each city in the two
output dimensions results in a familiar map of the U.S.A.
However, it should be noticed that Dimension 1 increases on
going from east to west, and Dimension 2 increases on going
from north to south, resulting in a map that has the axes
reversed from those of a traditional map. This illustrates a
feature of MDS, that the definition of the output dimensions
requires post hoc analysis by the experimenter. Fig. 1 shows
the map after the axes have been reversed.
City
Atlanta
Boston
Chicago
Dallas
Denver
Los Angeles
Seattle
New York City
Dimension 1
Dimension 2
−0.63
−1.19
−0.36
0.07
0.48
1.30
1.37
−1.04
0.40
−0.31
−0.15
0.55
0.00
0.36
−0.66
−0.21
FIG. 1 Map of Two-Dimensional Coordinates for Cities in the
U.S.A., as Calculated by MDS, with Axes Reversed
10. Conclusions
10.1 This guide provides an overview of several common
techniques for designing visual experiments and analyzing the
results. While such experiments can provide valuable scales for
a wide variety of applications, experimenters must remember
to perform only appropriate mathematics on the resulting scale
values. For example, it is inappropriate to add or subtract
ordinal data or to multiply or divide interval data. The
statistical significance of the visual results should always be
considered, since visual scales tend to have greater uncertainty
than physical measurements. The analyses outlined in this
guide include techniques for determining confidence regions
for this purpose. Users of this guide are encouraged to refer to
the cited references for additional details and examples prior to
5
Software such as SYSTAT, available from SYSTAT, Inc., 1800 Sherman Ave.,
Evanston, IL 60201 provides MDS capabilities.
7
E1808 − 96 (2015)
implementing visual experiments.
11. Keywords
11.1 category scaling; interval scales; magnitude estimation;
matching experiments; nominal scales; ordinal scales; paired
comparisons; rank ordering; ratio scales; threshold determination; visual experiments; visual scaling
REFERENCES
Vol 5, Visual Measurements, Academic, New York, 1984.
(5) Finney, D. J., Probit Analysis, 2nd ed., Griffin Press, Cambridge,
England, 1971.
(6) Torgerson, W. S., Theory and Methods of Scaling, John Wiley and
Sons, New York, 1958.
(7) Kruskal, J. B., and Wish, M., Multidimensional Scaling, Sage
Publications, Newbury Park, CA, 1978.
(8) Young, F. W., and Hamer, R. M. Muiltidimensional Scaling: History,
Theory, and Applications, Lawrence Erlbaum Assoc., Hillsdale, NJ,
1987.
(1) ASTM Committee E18 on Sensory Evaluation of Materials and
Products, Manual on Sensory Testing Methods, ASTM STP 434,
ASTM International, West Conshohocken, PA, 1968.
(2) ASTM Committee E18 on Sensory Evaluation of Materials and
Products, Guidelines for the Selection and Training of Sensory Panel
Members, ASTM STP 758, ASTM International, West Conshohocken,
PA, 1981.
(3) Gescheider, G. A., Psychophysics: Method, Theory, and Application,
2nd ed., Lawrence Erlbaum Assoc., Hillsdale, NJ, 1985.
(4) Bartleson, C. J., and Grum, F., “Optical Radiation Measurements,”
ASTM International takes no position respecting the validity of any patent rights asserted in connection with any item mentioned
in this standard. Users of this standard are expressly advised that determination of the validity of any such patent rights, and the risk
of infringement of such rights, are entirely their own responsibility.
This standard is subject to revision at any time by the responsible technical committee and must be reviewed every five years and
if not revised, either reapproved or withdrawn. Your comments are invited either for revision of this standard or for additional standards
and should be addressed to ASTM International Headquarters. Your comments will receive careful consideration at a meeting of the
responsible technical committee, which you may attend. If you feel that your comments have not received a fair hearing you should
make your views known to the ASTM Committee on Standards, at the address shown below.
This standard is copyrighted by ASTM International, 100 Barr Harbor Drive, PO Box C700, West Conshohocken, PA 19428-2959,
United States. Individual reprints (single or multiple copies) of this standard may be obtained by contacting ASTM at the above
address or at 610-832-9585 (phone), 610-832-9555 (fax), or (e-mail); or through the ASTM website
(www.astm.org). Permission rights to photocopy the standard may also be secured from the Copyright Clearance Center, 222
Rosewood Drive, Danvers, MA 01923, Tel: (978) 646-2600; />
8