dendrimer assisted controlled growth of
Bạn đang xem bản rút gọn của tài liệu. Xem và tải ngay bản đầy đủ của tài liệu tại đây (657.61 KB, 4 trang )
IOP PUBLISHING NANOTECHNOLOGY
Nanotechnology 18 (2007) 385303 (4pp) doi:10.1088/0957-4484/18/38/385303
Dendrimer-assisted controlled growth of
carbon nanotubes for enhanced thermal
interface conductance
Placidus B Amama
1,4
, Baratunde A Cola
1,2
, Timothy D Sands
1,3
,
Xianfan Xu
1,2
and Timothy S Fisher
1,2
1
Birck Nanotechnology Center, Purdue University, West Lafayette, IN 47907, USA
2
School of Mechanical Engineering, Purdue University, West Lafayette, IN 47907, USA
3
Schools of Materials Engineering and Electrical and Computer Engineering,
Purdue University, West Lafayette, IN 47907, USA
E-mail:
Received 6 July 2007
Published 29 August 2007
Online at stacks.iop.org/Nano/18/385303
Abstract
Multi-walled carbon nanotubes (MWCNTs) with systematically varied
diameter distributions and defect densities were reproducibly grown from a
modified catalyst structure templated in an amine-terminated
fourth-generation poly(amidoamine) (PAMAM) dendrimer by microwave
plasma-enhanced chemical vapor deposition. Thermal interface resistances of
the vertically oriented MWCNT arrays as determined by a photoacoustic
technique reveal a strong correlation with the quality as assessed by Raman
spectroscopy. This study contributes not only to the development of an active
catalyst via a wet chemical route for structure-controlled MWCNT growth,
but also to the development of efficient and low-cost MWCNT-based thermal
interface materials with thermal interface resistances
10 mm
2
KW
−1
.
1. Introduction
The extraordinary properties of carbon nanotubes (CNTs)
have sparked interest in their potential application in
nanoelectronics, electronics packaging, sensors and energy
storage. In particular, CNTs possess very high intrinsic
thermal conductivity, which has made them attractive for
heat transfer applications [1–5]. For several applications,
including flat panel displays and heat transfer applications,
arrays of vertically oriented high-quality CNTs with large,
uniform coverage, controlled diameter and quality are required.
Multiwalled carbon nanotubes (MWCNTs) of such dimensions
have been reproducibly grown by plasma-enhanced CVD
(PECVD) on substrates with suitable transition metal catalysts
(Co, Ni, and Fe) [6]. Prior studies have shown the efficacy of
such MWCNT arrays for use as thermal interfaces [3, 4, 7, 8]
and as enhanced surfaces for pool boiling [9]. In these
studies, variations of the catalyst characteristics were minimal,
as the ultimate morphology of film-type catalysts is relatively
difficult to control. However, the use of catalyst nanoparticles
4
Author to whom any correspondence should be addressed.
offer the flexibility required to vary the catalyst structure, and
ultimately the structural properties of MWCNTs.
Here, we consider in detail the effects of the catalyst
structure used to create MWCNT arrays and its influence
on the diameter, quality and thermal interface resistance.
Using modified Fe
2
O
3
nanoparticles derived from a dendrimer
‘nanotemplate’, vertically oriented MWCNT arrays of variable
diameter distributions and quality were grown with high
reproducibility. The concentration of Fe used for complexation
with the dendrimer and the calcination temperature of the
dendrimer-templated nanocomposites are key parameters that
have been used to modify the catalyst structure. Owing to
its high precision, the photoacoustic (PA) technique provides
a reliable approach to characterize the thermal interface
performance of the MWCNT arrays [4].
Catalyst nanoparticles produced by wet chemical routes
have shown high selectivity and reproducibility for CNT
growth by PECVD over a wide temperature range [6],
including low temperatures as demonstrated recently [10, 11].
This approach also offers substantial economic advantages
as the catalyst solution is stable over several months and
the problem of catalyst contamination is highly reduced,
0957-4484/07/385303+04$30.00 1 © 2007 IOP Publishing Ltd Printed in the UK
Nanotechnology 18 (2007) 385303 PBAmamaet al
ensuring high reproducibility of CNT growth. Fe
2
O
3
nanoparticles were prepared via an interdendritic templating
mechanism involving Fe
3+
ions and an amine-terminated
fourth-generation poly(amidoamine) (PAMAM) dendrimer
(hereinafter referred to as G4-NH
2
). The dendrimer
‘nanotemplate’ efficiently delivers nearly monodispersed
transition metal nanoparticles to substrates [12]; the resultant
Fe
2
O
3
nanoparticles obtained after calcination have been used
for the growth of high-quality single-walled carbon nanotubes
(SWNTs) via both thermal CVD [13]andPECVD[14].
2. Experimental details
The G4-NH
2
dendrimer having an ethylene diamine core,
supplied as a 10% methanol solution from Aldrich, was
used as a carrier to deliver isolated Fe
2
O
3
nanoparticles
to a Ti (30 nm)-coated SiO
2
/Si substrate. The catalyst
solution was prepared by mixing separate 20 ml solutions
of the G4-NH
2
dendrimer and FeCl
3
·6H
2
O, with G4-NH
2
:Fe
mole ratios corresponding to 1:16 and 1:46. The synthesis
procedure was adapted from a recipe provided by Fahlman
and co-workers [15]. The catalyst was transferred to the
Ti/SiO
2
/Si substrate by dip coating for 10 s, and calcined
at different temperatures (250, 550, 700, and 900
◦
C) for
10 min resulting in the formation of exposed monolayer of
Fe
2
O
3
nanoparticles. The mole ratio of Fe:G4-NH
2
and
the temperature of calcination are the parameters that are
varied here to control the mean diameter and the quality of
MWCNTs. The catalyst solutions with G4-NH
2
:Fe mole
ratios corresponding 1:16 and 1:46 are hereafter referred to as
1Fe@den and 3Fe@den, respectively.
Arrays of vertically oriented MWCNTs with dense and
uniform coverage on the substrate were grown from the
Fe
2
O
3
nanoparticles by PECVD at 900
◦
C. A detailed
description of the microwave PECVD system has been
reported previously [16]. Briefly, the Ti/SiO
2
/Si-supported
catalyst was placed on a 2 inch diameter Mo puck in the
PECVD chamber and was evacuated to a pressure of 0.5 Torr
using an external mechanical pump, and then purged with
N
2
for 5 min. The catalyst was annealed in an N
2
ambient
to enhance the stabilization of the Fe
2
O
3
nanoparticles, as
demonstrated in a recent study [14]. Induction substrate
heating supplied by a 3.5 kW RF source acting on a graphite
susceptor upon which the Mo puck rested was applied to
heat the chamber to the reaction temperature (RT). At RT,
the chamber was evacuated and pressurized to 10 Torr with
H
2
flow of 50 SCCM (SCCM denotes cubic centimeter per
minute at STP). The H
2
plasma was ignited using a power
of 200 W, and 10 SCCM of CH
4
(Praxair, ultrahigh purity)
was introduced into the chamber under these conditions for
20 min. The morphology, microstructure and quality of the
‘as-grown’ MWCNTs were studied by FESEM (Hitachi S-
4800) and Raman spectroscopy. A PA technique was used
to characterize the thermal performance of the MWCNT
interfaces, and a detailed experimental set-up of the technique
is described in [4]. Briefly, in the PA technique, a sinusoidally
modulated fiber laser is used to periodically heat the surface
of the MWCNT interface samples. The heated area of the
sample’s surface is surrounded by a sealed acoustic chamber;
thus, a periodic pressure signal is produced, as measured by
a microphone housed in the chamber wall. The measured
(a) (b)
(c) (d)
30µm50µm
5µm 200nm
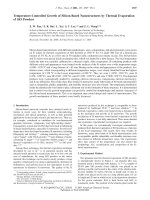
Figure 1. FESEM images of MWCNTs grown from 1Fe@den
catalysts calcined at 550
◦
C. (a) low-resolution image showing the
large and uniform coverage of MWCNTs; (b) vertical orientation of
the MWCNTs; (c) the substrate after scratching; and
(d) high-resolution image of MWCNTs.
pressure signal is used in conjunction with the model of [4]
to determine thermal properties—in this study the thermal
interface resistance. The time-resolved characteristic of the
PA technique facilitates a precision necessary to identify small
changes in thermal interface resistance (
∼1mm
2
KW
−1
)[4],
thus distinguishing different MWCNT array morphologies in
terms of thermal interface resistance.
3. Results and discussion
Figure 1 shows representative FESEM images of MWCNTs
grown from 1Fe@den calcined at 550
◦
C, while figure 2 shows
images of MWCNTs grown from 3Fe@den calcined at 250,
550, 700 and 900
◦
C. The spatial coverage of MWCNTs for
all the samples as determined by ImageJ [17] was roughly
the same, in the range of 65–70%. Little secondary growth
of smaller-diameter MWCNTs was observed. The control of
CNT diameter and quality are critical for most CNT-based
applications. Also, for heat transfer applications, CNTs are
required to be well anchored to the substrate. MWCNTs grown
from 1Fe@den and 3Fe@den catalysts meet this criterion as
demonstrated by the simple test we carried out to determine the
adhesion of the MWCNTs to the substrate. A representative
FESEM image of the MWCNT sample after scratching is
shown in figure 1(c). The fragments of MWCNTs present after
scratching are still strongly bonded to the substrate, suggesting
that the MWCNTs are well anchored to the substrate.
Raman spectroscopic measurements recorded on a
Renishaw Raman imaging microscope equipped with a 785 nm
(1.58 eV) diode laser, reveal two strong peaks at 1312 cm
−1
(D-band) and 1600 cm
−1
(G-band), which are characteristic
CNT vibration modes. The D-band represents the degree of
defects or amorphous carbon, while the G-band represents
the tangential stretching mode of highly ordered sp2 graphite.
The integrated intensity of the D-band relative to the G-
band (
I
D
/I
G
) has been used to evaluate the quality of
MWCNTs. The ratio is also affected by the change in CNT
2
Nanotechnology 18 (2007) 385303 PBAmamaet al
(a) 250 °C (b) 550 °C
(c) 700 °C (d) 900 °C
200nm200nm
200nm 200nm
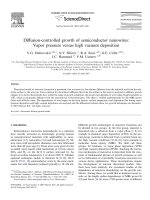
Figure 2. FESEM images of MWCNTs of different diameter
distributions grown from 3Fe@den catalysts calcined at (a) 250
◦
C,
(b) 550
◦
C, (c) 700
◦
C, and (d) 900
◦
C.
selectivity (i.e. single-wall or multiwall), which is insignificant
in the present case because all the samples were MWCNTs.
Therefore, amorphous carbon content and the number of defect
sites on the MWCNT walls are expected to be the main
contributors to the change in
I
D
/I
G
ratio. The I
D
/I
G
ratios of
MWCNTs grown from the respective catalysts are presented in
table 1. The Raman spectrum for each sample (not shown)
was an average of four spectra acquired randomly from the
sample. The results reveal a clear difference in the quality
of MWCNTs grown from 1Fe@den and 3Fe@den catalysts.
MWCNTs grown from 1Fe@den catalysts exhibit
I
D
/I
G
ratios
in the range of 1.1–1.2, which is substantially lower than
that observed for MWCNTs grown from 3Fe@den catalysts
with
I
D
/I
G
ratios in the range of 1.4–1.7. This indicates that
MWCNTs grown from the 3Fe@den catalysts possess more
defects or amorphous carbon.
This work demonstrates a reliable method for varying
the diameter range of MWCNTs grown from Fe
2
O
3
nanoparticles. The catalysts (1Fe@den and 3Fe@den),
calcination temperatures, and the corresponding diameter
distribution,
I
D
/I
G
ratio, and thermal resistance of MWCNTs
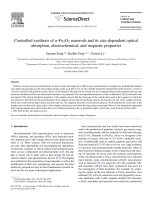
are summarized in table 1. The diameter distribution of
MWCNTs was obtained from a random statistical count of
130 nanotubes imaged by high-resolution FESEM, and the
histograms of MWCNT diameters grown from 1FXD@den
and 3FXD@den catalysts are presented in figures 3 and 4,
respectively. At low Fe concentration (1Fe@den), the average
diameters of MWCNTs decreases slightly as the calcination
temperature increases; at higher calcination temperatures (700
and 900
◦
C), the average diameter remains roughly unchanged
(15–40 nm); a high-resolution image is shown in figure 1(d).
The calcination of 3Fe@den at different temperatures allows
the variation of MWCNTs diameters distributions within the
20–90 nm range. The calcination of 3Fe@den catalyst at
250, 550, 700 and 900
◦
C resulted in the growth of MWCNTs
with corresponding diameter distributions of 28
.85 ± 12.42,
35
.43 ± 10.89, 70.34 ± 16.47, and 51.34 ± 15.02 nm (±,
standard deviation), respectively (figures 2(a)–(d)).
20 40 60
0
10
20
30
40
50
60
70
Frequency Counts
(b)
Mean = 26.14
±
8.06 nm
20 40 60
0
10
20
30
40
50
60
70
Mean = 23.20
±
7.69 nm
Frequency Counts
MWCNT Diameter (nm)
(c)
20 40 60
0
10
20
30
40
50
60
70
Mean = 24.28
±
8.73 nm
Frequency Counts
MWCNT Diameter (nm)
MWCNT Diameter (nm)
MWCNT Diameter (nm)
(d)
20 40 60
0
10
20
30
40
50
60
70
Mean = 30.64
±
10.19 nm
Frequency Count
(a)
Figure 3. Histograms of MWCNT diameters grown from
1FXD@den catalysts calcined at (a) 250
◦
C, (b) 550
◦
C, (c) 700
◦
C,
and (d) 900
◦
C.
20 40 60 80 100
0
10
20
30
40
50
Mean=35.43
±
10.89nm
Frequency CountFrequency Count
MWCNT Diameter (nm)
(b)
20 40 60 80 100
0
10
20
30
40
50
Mean=51.34±15.02nm
(d)
20 40 60 80 100
0
10
20
30
40
Mean=28.85
±
12.42nm
Frequency CountFrequency Count
MWCNT Diameter (nm)
(a)
20 40 60 80 100
0
10
20
30
40
50
Mean=70.33
±
16.47nm
MWCNT Diameter (nm) MWCNT Diameter (nm)
(c)
Figure 4. Histograms of MWCNT diameters grown from
3FXD@den catalysts calcined at (a) 250
◦
C, (b) 550
◦
C, (c) 700
◦
C,
and (d) 900
◦
C.
As shown in table 1, the average diameters and diameter
distributions of MWCNTs grown from 3Fe@den calcined
at 900
◦
C are lower than MWCNTs grown from the same
catalyst calcined at 700
◦
C. This result is likely the effect
of a decrease in the size of the Fe
2
O
3
nanoparticles upon
calcinationat temperatures higher than 700
◦
C and is consistent
with the work of Ago et al [18]. The calcination process
plays two key roles: (i) removal of the dendrimer template
resulting in the formation of exposed Fe
2
O
3
nanoparticles,
and (ii) the determination of the size and the grain structure
of Fe
2
O
3
nanoparticles to enable variation of the MWCNT
diameter. The latter role becomes more dominant at higher
Fe concentration, as observed for 3Fe@den catalysts.
The MWCNT thermal interface is created by placing a
piece of Ag foil (25
µmthick)atopaMWCNT-coveredSi
wafer. The room temperature thermal interface resistances of
the Si–MWCNT–Ag are presented in table 1. The resistance
measurements are performed at two interface pressures that
3
Nanotechnology 18 (2007) 385303 PBAmamaet al
Table 1. Summary of the effect of the calcination temperature of 1Fe@den and 3Fe@den catalysts on the diameter distribution, I
D
/I
G
ratio,
and thermal resistance of MWCNTs.
Thermal resistance (mm
2
KW
−1
)
Std
. error =±0.5mm
2
KW
−1
Catalyst G4-NH
2
:Fe
molar ratio
Calcination
temperature (
◦
C)
Diameter
distribution (nm)
I
D
/I
G
ratio
Std
. error =±0.1 10 psi 30 psi
1:16 (1Fe@den) 250 30.61 ±10.96 1.10 16 12
1:16 (1Fe@den) 550 26
.14 ±8.06 1.15 15 13
1:16 (1Fe@den) 700 23
.20 ±7.69 1.14 18 16
1:16 (1Fe@den) 900 24
.28 ±8.73 1.18 14 13
1:46 (3Fe@den) 250 28
.85 ±12.42 1.51 11 8
1:46 (3Fe@den) 550 35
.43 ±10.89 1.63 14 10
1:46 (3Fe@den) 700 70
.34 ±16.47 1.68 11 9
1:46 (3Fe@den) 900 51
.34 ±15.02 1.44 14 13
are representative of those commonly used to mate a heat sink
to a microprocessor. The thermal resistance values reported
here are comparable to those reported for MWCNT interfaces
grown from film catalysts [3, 4]. Interestingly, MWCNTs
grown from the 3Fe@den catalysts, which possessed more
defects and impurities, achieved lower thermal interface
resistances (
10 mm
2
KW
−1
) except for samples calcined
at 900
◦
C. In general, differences in the quality of the
MWCNTs resulted in the largest differences in thermal
interface performance, and the apparent effects of diameter
and small variations in spatial density were not distinguishable.
The MWCNT quality-dependent thermal performance is
clearly identified for samples calcined at 250
◦
C. Here, the
diameter ranges are similar, yet the more defective MWCNTs
grown from the 3Fe@den catalysts achieve thermal interface
resistances that are approximately 33% lower than those of the
higher-quality MWCNTs grown from the 1Fe@den catalysts.
The thermal resistances of well adhered, one-sided CNT
array interfaces such as the Si–MWCNT–Ag interfaces of
this study are dominated by the resistance at the free CNT
tips interface [4]. Thus, we postulate that the lower-quality
MWCNTs are more mechanically conformable due to a defect-
induced Young’s modulus reduction for individual tubes [19]
that lowers the effective bulk modulus of the MWCNT array.
As a result, the real contact area at the free CNT tips interface
increases to improve thermal interface conductance. Recently,
Zhang et al [20] showed that the effective bulk modulus of
carbon nanofiber arrays decreases as the number of defect sites
and impurities increases, and their observations are consistent
with the postulate stated above.
4. Conclusions
In summary, the diameter distribution and quality of MWCNTs
have been successfully varied using Fe
2
O
3
nanoparticles
derived on a dendrimer ‘nanotemplate’. The concentration of
Fe in the catalyst solution and the calcination temperature of
the Fe@den nanocomposites are key parameters that enable the
modification of the catalyst structure, resulting in variation of
the MWCNT structure. The effects of the foregoing factors
on the MWCNT structure are more significant at higher Fe
concentration. PA measurements reveal enhanced thermal
interface performance of MWCNTs grown from 3Fe@den
catalysts (
10 mm
2
KW
−1
for 3Fe@den catalysts calcined at
250, 550, and 700
◦
C), and they suggest that real interfacial
contact area may be increased by the additional conformability
provided by MWCNT arrays with an increased number of
defects. It is clear from our study that there seem to be an
inverse relationship between the thermal interface resistance
and the quality or the number of defect sites on the walls of the
MWCNTs.
Acknowledgments
This work was supported by the NASA-Purdue Institute for
Nanoelectronics and Computing and the Birck Nanotechnol-
ogy Center. Funding from Intel and Purdue University Gradu-
ate School are gratefully acknowledged by BAC.
References
[1] Berber S, Kwon Y-K and Tom´anek D 2000 Phys. Rev. Lett.
84 4613
[2] Che J W, Cagin T and Goddard W A 2000 Nanotechnology
11 65
[3] Xu J and Fisher T S 2006 Int. J. Heat Mass Transfer 49 1658
[4] Cola B A, Xu J, Cheng C, Hu H, Xu X and Fisher T S 2007
J. Appl. Phys. 101 054313
[5] Dresselhaus M S and Eklund P C 2000 Adv. Phys. 49 705
[6] Meyyappan M, Delzeit L, Cassel A and Hash D 2003 Plasma
Sources Sci. Technol. 12 205
[7] Hu X, Padilla A A, Xu J, Fisher T S and Goodson K E 2006
ASME J. Heat Transfer 118 1109
[8] Cola B A, Xu X and Fisher T S 2007 Appl. Phys. Lett.
90 093513
[9] Ujereh S Jr, Fisher T S and Mudawar I 2007 Int. J. Heat Mass
Transfer 50 4023
[10] Amama P B, Ogebule O, Maschmann M R, Sands T D and
Fisher T S 2006 Chem. Commun. 27 2899
[11] Min Y-S, Bae E J, Oh B S, Kang D and Park W 2005 J. Am.
Chem. Soc. 127 12498
[12] Scott R W J, Wilson O M and Crooks R M 2005 J. Phys. Chem.
B 109 692
[13] Choi H C, Kim W, Wang D and Dai H 2002 J. Phys. Chem. B
106 12361
[14] Amama P B, Maschmann M R, Fisher T S and Sands T D 2006
J. Phys. Chem. B 110 10636
[15] Vohs J K, Brege J J, Raymond J E, Brown A E, William G L
and Fahlman B D 2004 J. Am. Chem. Soc. 126 9936
[16] Maschmann M R, Amama P B, Goyal A, Iqbal Z, Gat R and
Fisher T S 2006 Carbon 44 10
[17] ImageJ 2007 (accessed January 2007)
[18] Ago H, Nakamura K, Uehara N and Tsuji M 2004 J. Phys.
Chem. B 108 18908
[19] Gillard J, Skove M and Rao A M 2005 Appl. Phys. Lett.
86 233109
[20] Zhang Y, Suhir E and Xu Y 2006 J. Mater. Res. 21 2948
4