cytotoxic drug resistance mechanisms
Bạn đang xem bản rút gọn của tài liệu. Xem và tải ngay bản đầy đủ của tài liệu tại đây (1.2 MB, 235 trang )
Drug Resistance 1
1
1
From:
Methods in Molecular Medicine, Vol. 28: Cytotoxic Drug Resistance Mechanisms
Edited by: R. Brown and U. Böger-Brown © Humana Press Inc., Totowa, NJ
Drug Resistance
The Clinical Perspective
D. Alan Anthoney and Stanley B. Kaye
1. Introduction
There are very few tumor types in which the use of chemotherapy can bring
about prolonged survival, and possibly cure, for individual patients. The most
common reason for this is the development of drug resistance within tumor
cells. The laboratory study of resistance to anticancer drugs has resulted in the
discovery of numerous mechanisms present within tumor cells that act to
reduce their cytotoxic effects. However, the failure to translate this basic labo-
ratory research into improved clinical outcome for patients remains one of the
most pressing problems in contemporary cancer research.
Clinical drug resistance encompasses two broad categories of treatment fail-
ure. Innate drug resistance is observed when a patient’s disease fails to respond
to therapy initially. Acquired resistance arises with the development of tumor
recurrence at some time after completion of initial treatment. The recurrent
disease often displays resistance to anticancer agents to which it has had no
prior exposure. Although cellular mechanisms of drug resistance play a sig-
nificant part in the failure of cancer chemotherapy, other important factors
influence the likelihood that a certain form of treatment will be effective. Prob-
lems in applying the results of in vitro studies on drug resistance to a clinical
setting arise out of the complexities involved in analyzing patients as opposed
to tumor cells in culture.
This chapter attempts to define some of the significant problems that influ-
ence the study of drug resistance in the clinical setting. It then presents an
overview of current clinical studies on the detection and circumvention of drug
resistance.
2 Anthoney and Kaye
2. Problems in the Clinical Analysis of Drug Resistance
The vast majority of laboratory studies on drug resistance have made use of
in vitro tumor cell lines in monolayer culture. Such cell lines are most often
clonally derived, reducing the risk that differences in sensitivity to specific
cytotoxic agents arise through variability between cells of the same line. The
ability to control the in vitro environment enables all cells to be exposed to
identical conditions, e.g., a specific concentration of cytotoxic agent. The use
of clonogenic and nonclonogenic methods of determining drug sensitivity and
resistance allows multiple repetitions of each assay. This improves the statisti-
cal significance of the values obtained. Analysis of cell lines with different
sensitivities to specific cytotoxic agents has uncovered biochemical and
molecular differences that may underlie the development of resistance.
In the clinical setting, a different situation pertains. The analytical unit
of clinical studies is the patient, a complex multicellular organism. Many
features of an individual patient and their environment can influence the
effectiveness of a particular form of drug treatment. Control of the envi-
ronment in which patients are studied is extremely difficult. Thus interpre-
tation of drug resistance in the clinical setting requires consideration of
many confounding factors that may have little to do with direct biochemi-
cal or molecular features of the tumor cell.
One problem with clinical studies of drug resistance is that several different
endpoints are used to determine the response of a tumor to a particular treat-
ment. During the administration of a course of treatment, response is measured
by use of serial X-rays, computerized tomography (CT) scans, assessments of
serum tumor markers, etc. Thus, one can make an approximate determination
as to whether there is disease progression, stable disease, or a complete or
partial response. However, the clinical (radiological) limit of detection is a
tumor of about 1 cm, which represents 10
8
–10
9
tumor cells (1). Therefore,
although there may be a good clinical response to treatment, a significant, but
undetectable, number of tumor cells may remain that may represent resistant
disease.
Clinical measurements, therefore, can be used to determine initial respon-
siveness or resistance to treatment in an individual patient, but can only pro-
vide a crude indication of the development of resistance over a period of time.
Clinical studies on new cytotoxic drugs, or combinations of drugs, use differ-
ent end-points to assess response. The most obvious determinant of successful
treatment is patient survival. However, problems arise in that the length of
survival may depend on many variables not directly related to the treatment
regimen under study. For example, patients who relapse after a specific course
of treatment will most likely receive other forms of therapy, with greater or
Drug Resistance 3
lesser effect in each individual’s case. Often, this is not taken into account in
the analysis of the overall survival of patients and may result in an underesti-
mation of the resistance to the regimen. Is measurement of the time to clinical
relapse, the disease-free survival, a better determinant of resistance to a par-
ticular form of treatment, within a given population, than overall survival?
Confounding factors can arise prior to or during treatment that may influence
the time to disease relapse. These may not be directly related to the inherent
sensitivity of the tumor cells to a specific form of chemotherapy. Thus, differ-
ences in the surgical debulking of tumor, and whether done by a general or
specialist surgeon, can have a significant effect on the time to disease relapse
between patients (2). Variations in the actual dose intensity of chemotherapy
received, as opposed to the planned dose intensity, can also significantly influ-
ence the time to disease relapse between patients. Often such data are not
included in the analysis of the response of a particular tumor type to a particu-
lar regimen of chemotherapy.
There are many other factors that influence the likely response of an indi-
vidual patient to a particular treatment. These include components of previous
health, genetic determinants of drug metabolism, prior exposure to other treat-
ment modalities, and so on. Although important in the individual case, such
variation between patients, not observed in clonal populations of cells, can
obscure the results of clinical trials of chemotherapy. This can be overcome by
enrolling large numbers of patients into such studies, often with the choice of
which treatment they receive being randomized. However, the logistical diffi-
culties in performing such trials are significant and patient recruitment is often
problematic. These studies do provide a very valuable resource for projects
aimed at understanding the causes of clinical drug resistance, because they
comprise a group of patients treated in a homogeneous fashion, for whom other
relevant data are also available.
It is obvious, therefore, that the study of the development of resistance to
anticancer drugs in the clinical setting is more complex than in the laboratory
and that often resistance can only be measured indirectly. This is not to say that
clinical studies of the importance of laboratory-derived drug resistance mark-
ers cannot be done. It may help to explain, however, why the results are often
less than clear.
3. Clinical Studies of Drug Resistance
Resistance to anticancer drugs is viewed as one of the most significant bar-
riers to the effective treatment of malignant tumors. It is therefore not surpris-
ing that despite the difficulties previously mentioned, many studies have been
and continue to be performed to determine the clinical significance of specific
drug-resistance mechanisms.
4 Anthoney and Kaye
3.1. P-glycoprotein (Pgp)
One of the major mechanisms of multidrug resistance in cultured cancer
cells has been shown to be caused by over-expression of a surface-membrane,
energy-dependent transport protein, P-glycoprotein (Pgp) (3). This protein can
increase the efflux of natural product anticancer drugs from the cell, thus reduc-
ing the effective intracellular concentration. Pgp is normally expressed in
detectable quantities in tissues such as colon, adrenal cortex, kidney, and liver.
Tumors from these organs often display inherent resistance to a range of anti-
cancer drugs. The MDR-1 gene, which encodes Pgp, is expressed at levels
thought to be physiologically significant in about 50% of human cancers (4).
However, does Pgp play a major part in the development of clinical drug resis-
tance? To answer this question, many studies have tried to correlate expression
of Pgp with established prognostic indicators or with determinants of treat-
ment outcome.
To date, the greatest number of studies have been performed in the hemato-
logical malignancies. This obviously reflects the more readily accessible
sources of tissue, i.e., bone marrow, available for study in these conditions.
A number of different techniques have been used to determine the levels of
expression of Pgp on blast cells in both acute lymphoblastic leukemia (ALL)
and acute myelogenous leukemia (AML). Attempts have then been made to
correlate these with response to treatment or clinical outcome. The methodology
for detection of Pgp in these studies has developed with time from determina-
tion of MDR-1 gene expression by Northern blotting or reverse transcriptase-
polymerase chain reaction (RT-PCR; see Chapter 7) to immunocytochemical
analysis of Pgp and measurement of its function (see Chapter 6). In de novo
AML a number of papers have reported a correlation between detectable levels
of Pgp and a poor response to treatment. Flow cytometry using the MRK16
monoclonal antibody (MAb) was used by Campos et al. to study 150 patients
with newly diagnosed AML (5). Patients with no detectable Pgp displayed a
significantly better rate of complete response to treatment and overall survival.
The same method was used by Ino et al. (6), who determined that Pgp detected
by flow cytometry correlated with functional Pgp by the Rhodamine 123 assay.
In a study of 52 patients with AML, they showed that although presence of Pgp
did not correlate with a reduced chance of achieving a complete response (CR)
after chemotherapy, it was associated with an increased risk of relapse (6).
Ludescher et al. (7) proposed that Pgp function, as assessed by the Rhodamine
123 assay, might act as an independent prognostic indicator in AML. This was
after finding a significant survival difference between patients whose blast
cells did and did not display functional Pgp by this method. Not all such stud-
ies show evidence of a correlation between the presence of Pgp on blast cells in
Drug Resistance 5
AML and a failure to respond to, or relapse after, chemotherapy. However, the
overall impression is that Pgp probably has a role in the development of resis-
tance to chemotherapy in AML.
The situation in other forms of hematological malignancy is less clear.
Anumber of studies in ALL have shown positive correlation between the pres-
ence of Pgp and relapse of disease after chemotherapy (8,9). However several
other groups have shown no clinical significance associated with the presence
of Pgp on blast cells in ALL (10). It has been proposed that this may result
from the different methodology used in different studies and perhaps also the
different populations of patients. Analysis of a large number of patients with
myeloma (11) before and after therapy with vincristine and doxorubicin
revealed that expression of Pgp was strongly correlated with prior exposure to
these drugs. The design of the study did not allow a determination of whether
this affected outcome.
Does the presence of detectable Pgp in cells from solid tumors act as a prog-
nostic indicator? The greatest amount of data collected to date has been for
adenocarcinoma of the breast (12). A number of studies have looked at whether
Pgp expression in breast carcinoma is associated with response to chemo-
therapy (12). Although Pgp levels measured before chemotherapy do not sig-
nificantly determine the likelihood of response to treatment a significant
association between elevated Pgp and poor outcome was noted if levels were
measured post-treatment. This may relate to selection for Pgp positive cells
during chemotherapy, but could also arise as an epiphenomenon if selection
for other determinants of poor prognosis during treatment, (e.g., mutant p53)
was associated with induction of MDR-1 expression (13). The prognostic sig-
nificance of detectable Pgp in breast cancer remains unclear as there is no uni-
form result from those investigations performed to date (12).
The expression of Pgp, as detected by immunohistochemistry (IHC), has been
shown to display a positive correlation with increased relapse rate in osteosar-
coma (14). This prognostic significance of Pgp was unrelated to other features
of the tumor such as chemotherapy-induced necrosis, which is currently the
most important predictor of disease-free survival. It is of interest that in this
study the relationship between Pgp and tumor relapse after chemotherapy could
not be linked to increased drug efflux from the tumor cells. The chemotherapy
used was composed of drugs that are not normally considered to be substrates
for Pgp. Therefore, at least in osteosarcoma and perhaps also in colon and breast
cancer, the presence of Pgp may not simply be a marker of tumor chemosensi-
tivity, but also a sign of tumor aggressiveness (15).
As with breast cancer, a state of uncertainty exists as to the significance of
Pgp studies in colorectal carcinoma in which there appears to be an even spread
of positive and negative correlations (16). Pgp expression may have prognostic
6 Anthoney and Kaye
significance in a subset of non-seminomatous germ cell tumors (17), but not in
non-small cell lung cancer or adrenocortical carcinoma from the data published
to date (18,19).
3.2. Pgp-Related Transporters
Over recent years, it has become obvious that Pgp is not the only membrane
protein that is associated with MDR. This was shown in tumor cells that dis-
played an MDR phenotype but without detectable levels of Pgp. Two further
drug-resistance related proteins have been described. MDR-associated protein
(MRP) is a member of the ATP-binding cassette (ABC)-transporter superfam-
ily that confers resistance to a similar, but not identical, spectrum of drugs as
Pgp (20,21). Lung resistance protein (LRP) was first identified in a lung-can-
cer cell line displaying MDR (22). There is evidence to suggest that LRP is
expressed more frequently in chemoresistant tumor types than in chemosensi-
tive cancers (23). Clinical studies have been performed in an attempt to deter-
mine the clinical significance of MRP and LRP expression in tumors.
Expression of MRP was found to be higher in patients with relapsed AML as
opposed to newly diagnosed cases (24). A positive correlation between MRP
and MDR-1 gene overexpression was observed in these AML cases, and this
was associated with a higher rate of emergence of clinical drug resistance. In
cases which were MDR negative, drug resistance was more frequent in MRP
positive cases than in MRP negative ones. Several other studies have also sug-
gested that over-expression of MRP can be detected in up to 35% of AML
patients and is associated with a tendency towards chemo-resistant disease (24).
However, it has also been shown that pre-treatment levels of MRP mRNA may
lack prognostic value in AML.
Metastatic neuroblastoma has a poor prognosis attributable, in part, to MDR.
The contribution of MDR-1/Pgp to neuroblastoma MDR is unclear, but evi-
dence suggests that MRP may play a significant role. A study of 60 neuroblas-
toma cases correlated elevated expression of MRP with other known indicators
of poor prognosis, e.g., increased N-myc expression. MRP expression was also
associated with reduced overall survival, and this appeared to be independent
of the status of other prognostic indicators in the tumor. MDR gene expression
in these tumors showed no prognostic significance. The consequences of
elevated MRP have also been analyzed in other solid tumor types. Ota et al.
(25) reported that MRP-expressing squamous-cell lung cancer showed a sig-
nificantly worse prognosis than MRP negative tumors, but that this was not so
in adenocarcinoma of the lung. MRP expression has also been shown to be
associated with increased resistance to certain anti-cancer drugs in vitro, as
measured using gastric cancer biopsies. However, there was no association
between MRP status and outcome in patients with gastric adenocarcinoma (26).
Drug Resistance 7
Far fewer studies to date have looked at the role of LRP in clinical drug
resistance. LRP has been shown to have prognostic significance in AML and
epithelial ovarian cancer (23). In the latter study, LRP was an independent
determinant of response to treatment and overall survival, whereas Pgp and
MRP were not. LRP levels were also shown to be increased post-chemotherapy
in osteosarcoma and this was a poor prognostic sign (27). LRP levels prior to
chemotherapy did not show prognostic significance.
3.3. Glutathione and Glutathione Transferases
Mechanisms of drug resistance involving membrane-associated protein
pumps, although the most thoroughly characterized, are not the only means by
which drug resistance can arise within tumor cells. Clinical studies investigat-
ing these other drug-resistance mechanisms are fewer in number, but are no
less important. The concentration of intracellular enzymes (both activating and
detoxifying) involved in the metabolism of cytotoxic drugs have been mea-
sured to determine whether there is a relationship with response to treatment.
The glutathione S-transferases (GST) are a group of detoxifying enzymes that
are thought to play a role in the metabolism of drugs such as cisplatin, doxoru-
bicin, melphalan, cyclophosphamide and the nitrosoureas (28). GST-π is the
predominant isoenzyme subtype found in ovarian carcinoma and several
studies have been performed to determine whether levels of this enzyme have
prognostic significance. Using immunohistochemistry on formalin fixed, par-
affin-embedded tumor sections, Green et al. (28) found that increased levels of
GST-π were correlated to a poor response to chemotherapy. GST-π levels also
correlated to overall survival, independent of other prognostic indicators. Simi-
lar results were obtained by Hamada et al. (29), who also found that levels of
GST-π were higher in residual tumor after the completion of chemotherapy.
Several other reports, however, using immunohistochemical and Western
immunoblot analysis of glutathione and GST-π levels in ovarian carcinoma,
have shown no evidence of independent prognostic significance (30,31).
Attempts to correlate GST levels and clinical outcome in urothelial tumors and
in cancers of the head and neck has also been attempted, but without clear
conclusions (32,33).
3.4. DNA Repair
The involvement of DNA repair pathways in the development of drug resis-
tance has become increasingly apparent over recent years from in vitro studies
on tumor cell lines. Measurement of the expression of specific genes involved
in DNA repair pathways in tumor samples has been used to assess the possible
clinical significance of DNA repair. Elevated levels of p53 protein in tumors
suggest mutation in the p53 gene. As p53 protein is involved in regulation of
8 Anthoney and Kaye
cell-cycle checkpoints, DNA repair and apoptotic pathways mutations in the
gene may be responsible for altering the sensitivity of tumor cells to cytotoxic
drugs. This may result in drug resistance. Immunohistochemical detection of
elevated levels of p53 has been associated with established features of aggres-
sive phenotype and poor prognosis in a number of tumor types, including ova-
rian, breast, and bladder carcinomas (31,34,35). Increased tumor p53 in ovarian
carcinoma has been associated with a poor response to chemotherapy (cisplatin-
based) in a report by Righetti (36), although a number of others show no sig-
nificant correlation (31,37). The association of elevated tumor p53 protein
levels and the length of progression-free survival (PFS) after chemotherapy
has also been studied, particularly in ovarian carcinoma. There have been no
indications that elevated p53 levels correlate with shorter PFS except in spe-
cific tumor sub-types (31,38).
A number of small studies have attempted to correlate response to chemo-
therapy with the levels of other DNA repair genes in tumor specimens. Thus,
the levels of expression of nucleotide-excision repair genes ERCC1, ERCC2,
and XPA have been compared to the response to cisplatin chemotherapy in
ovarian cancer, but without any significant association being determined
(39,40). There have also been suggestions that levels of Bcl2 expression in
ovarian tumors might influence the response to chemotherapy. Reports from
two groups suggest that detection of Bcl2 by immunohistochemistry (IHC),
along with lack of detectable p53, is associated with a better response to che-
motherapy in all but the worst prognosis patients (41,42). Unfortunately, the
small number of patients in these studies limits their significance
4. Clinical Importance of Specific Mechanisms of Drug Resistance
As can be seen from the evidence previously presented, the significance that
specific drug-resistance mechanisms play in the clinical response of tumors to
cytotoxic agents is unclear. In the majority of tumors, for every study that has
shown a correlation between a marker of resistance and poor outcome, another
study has shown no such association. Does different evidence exist that might
help in determining the clinical importance of specific mechanisms of drug
resistance?
If a tumor cell develops resistance by increasing the rate at which drug is
exported from the intracellular compartment, then it would appear reasonable
to assume that increasing the concentration of drug to which the cell is exposed
will overcome the resistance to some extent. Thus if a cell with classical MDR
is exposed to a higher concentration of cytotoxic agent, more drug will enter
the intracellular space and, despite the activity of Pgp, will lead to cytotoxicity.
This is easily observed in vitro as even highly resistant tumor cell lines can be
killed by exposure to a sufficient concentration of cytotoxic drug. The situa-
Drug Resistance 9
tion in vivo is obviously different as the effects of cytotoxic agents on normal
cells in the body limits the doses that can be given safely. However, the idea
that increasing the total dose and/or the dose intensity of specific cytotoxic
agents might improve outcome has led to many studies which have used “high-
dose” chemotherapy (HDC) to treat recurrent or poor prognosis tumors. Do the
results of such studies help in determining the clinical importance of classical
MDR-type resistance? The use of HDC and bone marrow rescue was initially
developed for the treatment of hematological malignancies and it is here that
the evidence appears to be most clear. For example, patients with non-Hodgkins
lymphoma (NHL) who fail to achieve a CR after conventional chemotherapy
or with relapsed disease have shown an improved response rate and survival
after treatment with HDC, as compared to standard dose-salvage regimens
(43,44). This data is compatible with the notion that some of the resistance
observed in relapsed or poorly responsive NHL may be owing to classical
MDR-type mechanisms.
The benefits of HDC in treatment of a wide range of solid tumors are much
less certain. The treatment of metastatic and poor prognosis forms of breast
cancer with HDC has been investigated most extensively. There would appear
to be little doubt that the use of high-dose regimens delivers a higher response
rate to treatment than standard-dose treatment. However, this has seldom
resulted in improvements in overall duration of response and survival (45).
Often the data has been difficult to interpret owing to the lack of clinical trials
in which HDC was directly compared to standard-dose regimens. One feature
that did arise from such studies was that there appeared to be a threshold of
drug dose, below which the response to treatment was definitely poorer. Thus,
“less was worse,” but more was not necessarily better. More recently a number
of controlled trials have been performed. Although the data from these studies
is not without potentially significant flaws, they suggest that in certain specific
groups of patients with poor prognosis breast cancer, HDC may result in improved
overall survival (46). In other solid tumors, there is no convincing evidence as yet
that HDC can overcome resistance resulting in improved survival (47).
There exists a further body of evidence that helps clarify the clinical rel-
evance of Pgp-mediated classical MDR resistance. With numerous in vitro
studies showing that Pgp was important in the development of MDR cell lines,
and some evidence that this might be significant in vivo, the idea of Pgp as a
specific target for therapy arose. A range of compounds have been shown to
reverse the classical MDR phenotype in vitro through competitive inhibition
of drug efflux (48). Some of these are drugs that have established therapeutic
roles in other forms of illness, e.g., calcium channel antagonists, cyclosporines,
antimalarials, and steroids. The potential for reversal of MDR with such com-
pounds has also been observed in Pgp-expressing tumor xenograft models (49).
10 Anthoney and Kaye
A number of these drugs have been used in clinical trials in an attempt to over-
come treatment resistance in tumors where Pgp commonly contributes to the
resistance phenotype. Some of these trials have shown that addition of Pgp
antagonists, such as Verapamil and cyclosporin A, in the treatment of resistant
myeloma and lymphoma appears to result in further responses to treatment
(50,51). However, there have been criticisms of many of the MDR reversal
studies performed to date. For example, addition of Pgp antagonists can also
alter the pharmacokinetics of cytotoxic drugs used in the treatment regimen.
This normally results in exposure of the tumor cells to a higher concentration
of cytotoxic drug. It is unclear, therefore, whether any improvement in results
with an MDR modulator is owing to direct blocking of Pgp or to pharmacoki-
netic interaction (52) as with cyclosporin analog, PSC833. The development
of more specific inhibitors of Pgp, e.g., LY335979 (53), which may not alter
the pharmacokinetics of cytotoxic agents, may help to clarify this issue.
The problems inherent in many of the MDR reversal studies published to
date mean that they do not, as yet, provide strong evidence for the importance
of Pgp in the development of clinical drug resistance. Improvements in trial
design and the development of more specific antagonists of Pgp may result in
more significant results in the not-too-distant future.
5. Conclusions
The preceding review illustrates that determining the clinical relevance of
drug-resistance mechanisms discovered in vitro is far from simple. Often it
appears that a consensus has been reached with regard to the significance of a
particular factor when the next study comes along with a contradictory conclu-
sion. The reasons for this, as have already been indicated, are numerous, and
often arise from the complexity of studying the human organism in its environ-
ment. However, much of the difficulty also arises from significant differences
in the way in which studies are performed. Clinical studies are often limited by
the numbers of patients that can be recruited.
Standardization of trial methods, therefore, could allow data to be accumulated
from multiple small studies, improving the significance of results. Obviously,
advances in molecular biology alter the sensitivity with which drug-resistance
genes or proteins can be detected. The differences between results observed in
clinical studies of Pgp in the late 1980s and in mid-1990s have been attributed
to the use of the more recent and sensitive technique of immunohistochemistry
(12). Attempts have been made to standardize the methods used in studying
drug-resistance markers. A recent workshop conference published guidelines
as to what criteria should be used to determine whether a tumor is Pgp-positive
(54). Such measures may increase the information that can be obtained from
diverse clinical studies.
Drug Resistance 11
A different approach to improving the clinical data on the significance of
drug-resistance mechanisms might be to study the development of resistance
in sequential biopsy samples from the same individual(s). Although this seems
attractive in principle, the reality is that, for most patients, tissue samples are
not easy to obtain. With hematological tumors, repeat samples of bone marrow
or lymph node biopsies obtained pre- and post-chemotherapy are a possibility.
However, with solid tumors it is often unfeasible, or unethical, to attempt to
obtain tissue samples after chemotherapy or at relapse.
The chapters that follow present a range of state-of-the-art techniques for inves-
tigation of mechanisms of drug resistance. Although not specifically aimed at clini-
cal studies, it is to be hoped that they will be of benefit in translational research
with its aims of bringing discoveries from the laboratory into the clinical domain. It
is hoped that with advances in laboratory techniques and materials, along with
improved design of clinical drug-resistance studies, the significance of resistance
mechanisms will become clearer. This should be a realistic goal because, to steal a
quote from another field of investigation, “The truth is out there.”
References
1. Tannoch, I. (1989) Principles of cell proliferation: cell kinetics, in Cancer: Prin-
ciples and Practice of Oncology, 3rd ed. (de Vita, V. T., Hellman, S., and
Rosenberg, S. A., eds.), J. B. Lippincott, Philadelphia, pp. 3–13.
2. Junor, E. J., Hole, D. J., and Gillis, C. R. (1994) Management of ovarian cancer:
referral to a multidiciplinary team matters. Br. J. Cancer 70, 363–370.
3. Kartner, N., Riordan, J. R., and Ling, V. (1983) Cell surface P-glycoprotein asso-
ciated with multidrug resistance in mammalian cell lines. Science 221, 1285–1288.
4. Goldstein, L. J., Galski, H., Fojo, A., Willingham, M., Lai, S. L., Gazdar, A.,
Pirker, R., Green, A., Crist, W., Brodeur, G. M., Lieber, M., Cossman, J.,
Gottesman, M. M., and Pastan, I. (1989) Expression of multidrug resistance gene
in human cancer. J. Natl. Cancer Inst. 81, 116–124.
5. Campos, L., Guyotat, D., Archimbaud, E., Calmard-Oriol, P., Tsuruo, T., Troncy,
J., Treille, D., and Fiere, D. (1992) Clinical significance of multidrug resistance
P-glycoprotein expression on acute nonlymphoblastic leukaemic cells. Blood 79,
473–476.
6. Ino, T., Miyazaki, H., Isogai, M., Nomura, T., Tsuzuki, M., Tsuruo, T., Ezaki, K.,
and Hirano, M. (1994) Expression of P-glycoprotein in de-novo acute myelog-
enous leukaemia at initial diagnosis: results of molecular and functional assays,
and correlation with treatment outcome. Leukaemia 8, 1492–1497.
7. Ludescher, C., Eisterer, W., Hilbe, W., Gotwald, M., Hofmann, J., Zabernigg, A.,
Cianfriglia, M., and Thaler, J. (1995) Low frequency of activity of P-glycoprotein
(P-170) in acute lymphoblastic leukaemia compared to acute myeloid leukaemia.
Leukaemia 9, 350–356.
8. Goasguen, J. E., Dossot, J., Fardel, O., LeMee, F., LeGall, E., Leblay, R., LePrise,
P. Y., Chaperon, J., and Fauchet, R. (1993) Expression of the multidrug resis-
12 Anthoney and Kaye
tance-associated P-glycoprotein (P-170) in 59 cases of de novo acute lymphoblas-
tic leukaemia: prognostic implications. Blood 81, 2394–2398.
9. Savignano, C., Geromin, A., Michieli, M., Damiani, D., Michelutti, A., Melli, C., Fanin,
R., and Baccarani, M. (1993) The expression of the multidrug resistance-related glyco-
protein in adult acute lymphoblastic leukaemia. Haematologica 78, 261–263.
10. Wattel, E., Leppelley, P., Merlat, A., Sartiaux, C., Bauters, F., Jouet, J. P., and
Fenaux, P. (1995) Expression of the multidrug resistance P-glycoprotein in newly
diagnosed adult acute lymphoblastic leukaemia: absence of correlation with
response to treatment. Leukaemia 9, 1870–1874.
11. Grogan, T. M., Spier, C. M., Salmon, S. E., Matzner, M., Rybski, J., Weinstein, R.
S., Scheper, R. J., and Dalton, W. S. (1993) P-glycoprotein expression in human
plasma cell myeloma: correlation with prior chemotherapy. Blood 81, 490–495.
12. Trock, B. J., Leonessa, F., and Clarke, R. (1997) Multidrug resistance in breast
cancer: Meta-analysis of MDR1/gp170 expression and its possible functional sig-
nificance. J. Natl. Cancer Inst. 89, 917–931.
13. Kaye, S. B. (1997) Multidrug resistance in breast cancer—is the jury in yet?
J. Natl. Cancer Inst. 89, 902,903.
14. Baldini, N., Scotlandi, K., Barbanti-Brodano, G., Manara, M. C., Maurici, D.,
Bacci, G., Bertoni, F., Picci, P., Sottili, S., Campanacci, M., and Serra, M. (1995)
Expression of P-Glycoprotein in high-grade osteosarcomas in relation to clinical
outcome. N. Engl. J. Med. 333, 1380–1385.
15. Pinedo, H. M. and Giaccone, G. (1995) P-Glycoprotein—A marker of cancer-cell
behavior. N. Engl. J. Med. 333, 1417–1419.
16. Linn, S. C. and Giaccone, G. (1995) MDR1/P-glycoprotein expression in
colorectal cancer. Eur. J. Cancer 31A, 1291–1294.
17. Eid, H., Bodrogi, I., Csokay, B., Olah, E., and Bak, M. (1996) Multidrug resis-
tance of testis cancer: the study of clinical relevance of P-glycoprotein expres-
sion. Anticancer Res. 16, 3447–3452.
18. Oka, M., Fukuda, M., Sakamoto, A., Takatani, H., Soda, H., and Kohno, S. (1997)
The clinical role of MDR1 gene expression in human lung cancer. Anticancer
Res. 17, 721–724.
19. Haak, H. R., van Seters, A. P., Moolenaar, A. J., and Fleuren, G. J. (1993) Expres-
sion of P-glycoprotein in relation to clinical manifestation, treatment and progno-
sis of adrenocortical cancer. Eur. J. Cancer 29A, 1036–1038.
20. Cole, S. P. C., Bhardwaj, G., Gerlach, J. H., Mackie, J. E., Grant, C. E., Almquist,
K. C., Stewart, A. J., Kurz, E. U., Duncan, A. M. V., and Deeley, R. G. (1992)
Overexpression of a transporter gene in a multidrug-resistant human lung cancer
cell line. Science 258, 1650–1654.
21. Grant, C. E., Valdimarssan, G., Hipfner, D. R., Almquist, K. C., Cole, S. P. C.,
and Dudley, R. G. (1994) Overexpression of multidrug resistance-associated pro-
tein (MRP) increases resistance to natural product drugs. Cancer Res. 54, 357–361.
22. Scheper, R. J., Broxterman, H. J., and Scheffer, G. L. (1995) Overexpression of a
M(r) 110,000 vesicular protein in non-P-glycoprotein-mediated multidrug resis-
tance. Cancer Res. 53, 1475–1479.
Drug Resistance 13
23. Izquierdo, M. A., van der Zee, A. G. J., Vermorken, J. B., van der Valk, P., Belien,
J. A. M., Giaccone, G., Scheffer, G. L., Flens, M. J., Pinedo, H. M., Kenemans, P.,
Meijer, C. J. L. M., de Vries, E. G. E., and Scheper, R. J. (1997) Drug resistance-
associated marker Lrp for prediction of response to chemotherapy and prognoses
in advanced ovarian carcinoma. J. Natl. Cancer Inst. 87, 1230–1237.
24. Zhou, D., Zittoun, R., and Marie, J. (1995) Expression of multidrug resistance-
associated protein (MRP) and multidrug resistance (MDR1) genes in acute
myeloid leukaemia. Leukaemia 9, 1661–1666.
25. Ota, E., Abe, Y., Oshika, Y., Ozeki, Y., Iwasaki, M., Inoue, M., Yamazaki, H.,
Ueyama, Y., Takazi, K., Ogata, T., Tamaoki, N., and Nakamura, M. (1995)
Expression of the multidrug resistance-related protein (MRP) gene in non-small
cell lung cancer. Br. J. Cancer 72, 550–554.
26. Endo, K., Maehara, Y., Ichiyoshi, Y., Kusumoto, T., Sakaguchi, Y., Ohno, S., and
Sugimachi, K. (1996) Multidrug resistance-associated protein expression in clini-
cal gastric carcinoma. Cancer 77, 1681–1687.
27. Uozaki, H., Horiuchi, H., Ishida, T., Lijima, T., Imamura, T., and Machinami, R.
(1997) Overexpression of resistance-related proteins (metallothioneins, glu-
tathione-S-transferase, heat shock protein 27, and lung resistance-related protein)
in osteosarcoma. Cancer 79, 2336–2344.
28. Green, J. A., Robertson, L. J., and Clark, A. H. (1993) Glutathione-S-transferase
expression in benign and malignant ovarian tumours. Br. J. Cancer 68, 235–239.
29. Hamada, S., Kamada, M., Furumoto, H., Hirao, T., and Aono, T. (1994) Expres-
sion of glutathione S-transferase pi in human ovarian cancer as an indicator of
resistance to chemotherapy. Gynecol. Oncol. 52, 313–319.
30. Tanner, B., Hengstler, J. G., Dietrich, B., Henrich, M., Steinberg, P., Weikel, W.,
Meinert, R., Kaina, B., Oesch, F., and Knapstein, P. G. (1997) Glutathione, glu-
tathione-S-transferase alpha and pi, and aldehyde dehydrogenase content in rela-
tionship to drug resistance in ovarian cancer. Gynecol. Oncol. 65, 54–62.
31. van der Zee, A. G. J., Hollema, H., Suurmeijer, A. J. H., Krans, M., Sluiter, W. J.,
Willemse, P. H. B., Aadlers, J. G., and de Vries, E. G. E. (1995) Value of
P-glycoprotein, glutathione-S-transferase ppi, c-erbB-2, and p53 as prognostic
factors in ovarian carcinomas. J. Clin. Oncol. 13, 70–78.
32. Kim, W. J., Kakehi, Y., Wu, W. J., Fukumoto, M., and Yoshida, O. (1996) Expres-
sion of multidrug resistance-related genes (mdr1, MRP, GST-pi and DNA
topoisomerase II) in urothelial cancers. Br. J. Urol. 78, 361–368.
33. Mulder, T. P., Manni, J. J., Roelofs, H. M., Peters, W. H., and Wiersma, A. (1995)
Glutathione S-transferases and glutathione in human head and neck cancer. Car-
cinogenesis 16, 619–624.
34. Eissa, S., Khalifa, A., el-Gharib, A., Salah, N., and Mohamed, N. K. (1997) Mul-
tivariate analysis of DNA ploidy, p53, c-erbB-2 proteins, EGFR, and steroid hor-
mone receptors for prediction of poor short term prognosis in breast cancer.
Anticancer Res. 17, 1417–1423.
35. Lacombe, L., Dalbagni, G., Zhang, Z., Cardon-Cordo, C., Fair, W. R., Herr, H.
W., and Reuter, V. E. (1996) Overexpression of p53 protein in a high risk popula-
14 Anthoney and Kaye
tion of patients with superficial bladder cancer before and after bacillus Calmette-
Guerin therapy: correlation to clinical outcome. J. Clin. Oncol. 14, 2646–2652.
36. Righetti, S. C., Torre, G. D., Pilotti, S., Menard, S., Ottone, F., Colnaghi, M. I.,
Pierotti, M. A., Lavarino, C., Cornarotti, M., Oriana, S., Bohm, S., Bresciani, G.
L., Spatti, G., and Zunino, F. (1996) a comparative study of p53 gene mutations,
protein accumulation and response to cisplatin-based chemotherapy in advanced
ovarian carcinoma. Cancer Res. 56, 689–693.
37. Hartmann, L. C., Podratz, K. C., Keeney, G. L., Kamel, N. A., Edmonson, J. H.,
Grill, J. P., Su, J. Q., Katzmann, J. A., and Roche, P. C. (1994) Prognostic signifi-
cance of p53 immunostaining in epithelial ovarian cancer. J. Clin. Oncol. 12, 64–69.
38. Levesque, M. A., Katsaros, D., Yu, H., Zola, P., Sismondi, P., Giardina, G., and
Diamandis, E. P. (1995) Mutant p53 protein overexpression is associated with
poor outcome in patients with well or moderately differentiated ovarian carci-
noma. Cancer 75, 1327,1328.
39. Dabholkar, M., Bostick-Bruton, F., Weber, C., Bohr, V. A., Egwuagu, C., and
Reed, E. (1992) ERCC1 and ERCC2 expression in malignant tissues from ovarian
cancer patients. J. Natl. Cancer Inst. 84, 1512–1517.
40. Yu, J. J., Dabholkar, M., Bennett, W. P., Welsh, J. A., Mu, C. J., Bostick-Bruton,
F., and Reed, E. (1996) Platinum-sensitive and platinum-resistant ovarian cancer
tissues show differences in the relationships between m-RNA levels of p53,
ERCC1 and XPA. Intl. J. Cancer 8, 313–317.
41. Diebold, J., Baretton, G., Felchner, M., Meier, W., Dopfer, K., Schmidt, M., and
Lohrs, U. (1996) bcl-2 expression, p53 accumulation, and apoptosis in ovarian
carcinomas. Am. J. Clin. Pathol. 105, 341–349.
42. Herod, J. J. O., Eliopoulos, A. G., Warwick, J., Neidobiteck, G., Young, L. S., and
Kerr, D. J. (1996) The prognostic significance of Bcl-2 and p53 expression in
ovarian carcinoma. Cancer Res. 56, 2178–2184.
43. Philip, T., Guglielmi, C., Hagenbeek, A., Somers, R., van der Lelie, H., and Bron,
D. (1995) Autologous bone marrow transplantation as compared with salvage
chemotherapy in relapses of chemotherapy-sensitive Non-Hodgkin’s lymphoma.
N. Engl. J. Med. 333, 1540–1545.
44. Mills, W., Chopra, R., McMillan, A., Pearce, R., Linch, D. C., and Goldstone, A.
H. (1995) BEAM chemotherapy and autologous bone marrow transplantation for
patients with relapsed or refractory Non-Hodgkin’s lymphoma. J. Clin. Oncol.
13, 588–595.
45. Eddy, D. M. (1992) High-dose chemotherapy with autologous bone marrow trans-
plantation for the treatment of metastatic breast cancer. J. Clin. Oncol. 10, 657–670.
46. Bezwoda, W. R., Seymour, L., and Dansey, R. D. (1995) High-dose chemotherapy
with hematopoietic rescue as primary treatment for metastatic breast cancer: a
randomised trial. J. Clin. Oncol. 13, 2483–2489.
47. Hornedo, J. and Cortes-Funes, H. (1996) The role of high dose chemotherapy in
adult solid tumours other than breast cancer. Ann. Oncol. 7, 23–30.
48. Raederer, M. and Scheithauer, W. (1993) Clinical trials of agents that reverse
multidrug resistance—a literature review. Cancer 72, 3553–3563.
Drug Resistance 15
49. Sikic, B. I. (1993) Modulation of MDR: at the threshold. J. Clin. Oncol. 11, 1629–1635.
50. Miller, T. P., Grogan, T. M., Dalton, W. S., Spier, C. M., Scheper, R. J., and
Salmon, S. E. (1991) P-glycoprotein expression in malignant lymphomas and
reversal of clinical drug resistance with chemotherapy plus high-dose verapamil.
J. Clin. Oncol. 9, 17–24.
51. Sonneveld, P., Durie, B. G. M., Lokhorst, H. M., Marie, J. P., Solbu, G., Suciu, S.,
Zittoun, R., Lowenberg, B., and Nooter, K. (1992) Modulation of multidrug-
resistant multiple myeloma by cyclosporin. Lancet 340, 255–259.
52. McLeod, H. L. (1994) Clinical reversal of the MDR phenotype: true tumour modu-
lation or pharmacokinetic interaction? Eur. J. Cancer 30A, 2039–2041.
53. Dantzig, A. H., Shepard, R. L., Cao, J., Law, K. L., Ehlhardt, W. J., Baughman, T.
M., Bumol, T. F., and Starling, J. J. (1996) Reversal of P-glycoprotein-mediated
multidrug resistance by a potent cyclopropyldibenzosuberane modulator, LY335979.
Cancer Res. 56, 4171–4179.
54. Beck, W. T., Grogan, T. M., Willman, C. L., Cardon-Cordo, C., Parham, D. M.,
Kuttesch, J. F., Andreeff, M., Bates, S. E., and Berard, C. W. (1996) Methods to
detect P-glycoprotein-associated multidrug resistance in patients’ tumours: con-
sensus recommendations. Cancer Res. 56, 3010–3020.
Cell Sensitivity Assays: Clonogenic Assay 17
2
17
From:
Methods in Molecular Medicine, Vol. 28: Cytotoxic Drug Resistance Mechanisms
Edited by: R. Brown and U. Böger-Brown © Humana Press Inc., Totowa, NJ
Cell Sensitivity Assays
Clonogenic Assay
Jane A. Plumb
1. Introduction
The use of cell culture systems to assess the toxicity of anticancer agents
began over 50 years ago following the observation of the antineoplastic effects
of nitrogen mustard (1). There are a wide variety of assays designed to evaluate
cellular drug sensitivity described in the literature. These assays essentially
fall into two groups; those that measure cell survival and those that measure
cytotoxicity. Cytotoxicity assays include methods such as trypan blue dye
exclusion,
51
Cr release and
3
H-thymidine incorporation (2–4) and these assays
assess the structural integrity and metabolic function of the cells following
drug exposure. In contrast, cell survival assays measure the end result of these
effects on the cell which can be either cell death or recovery. A cell survival
assay thus requires a measure of the ability of cells to proliferate and this is
usually an estimate of the ability of individual cells to form colonies. However,
cytotoxicity assays can also measure the ability of cells to proliferate if the
cells are allowed a period of growth following drug exposure. This recovery
time is comparable to the time taken for formation of colonies in a clonogenic
assay.
Clonogenic assays are commonly regarded as the “gold standard” cellular sen-
sitivity assay. This idea originates from the early 1960s when radiobiologists
were comparing the radiosensitivities of tumour cell lines in vitro. This involved
estimation of multiple logs of cell kill and it was thought that only a clonogenic
assay would have sufficient sensitivity to be able to assess cell kill at low per-
centage survivals (<1%). However, the results obtained with a cell growth assay
were similar to those obtained with a clonogenic assay (5). Nevertheless, the
18 Plumb
clonogenic assay has retained its superior status (6). Many factors influence cel-
lular drug sensitivity and no one assay can take account of all these variables.
The human tumour stem cell assay has been widely used in attempts to pre-
dict the response of tumors to chemotherapeutic agents (7). In order to distin-
guish between normal and tumour cells present within a biopsy the assay
measures the ability of cells to undergo substrate independent proliferation in
agar. Overall, the ability of the assay to predict treatment response is good but
only about 30% of biopsies processed resulted in sufficient colony numbers to
allow evaluation (8). This is a major problem with the assay and many human
tumour cell lines show a very poor cloning efficiency in agar (<1%) whereas
the cloning efficiency on tissue culture treated plastic can be greater than 50%.
The clonogenic assay described is based on monolayer cloning which is widely
applicable to continuous cell lines.
In the standard clonogenic assay cells in the exponential phase of growth are
exposed to a cytotoxic drug. The drug exposure time depends on a number of
factors. If the drug is cell cycle specific (i.e., specific for cycling as opposed to
noncycling cells) a short exposure may be sufficient and this can be related to
the estimated duration of exposure in the clinic. In contrast, if the drug is phase
specific it may be necessary to extend the exposure period to the take account
of the cell doubling time. Cells are normally exposed to drug in the exponential
phase of growth since the majority of cytotoxic drugs are active against cycling
cells. However, the assay can be used equally well with confluent noncycling
cells provided that they will re-enter the cell cycle on subculture. Follow-
ing drug exposure the cells are disaggregated to form a single cell suspension
and are plated out at low density to allow colony formation. The colonies are
fixed, stained and counted. Each colony is assumed to be derived from a single
cell and thus the colony count is an estimate of the number of cells that sur-
vived the drug treatment.
The number of cells within each colony depends on the number of cell
doublings and can be used as an estimate of the effects, if any, of the drug on
the cell doubling time. A clonogenic assay can thus discriminate between cyto-
toxic (cell kill) and cytostatic (decreased growth rate) effects. Because a cyto-
static effect may be lost upon removal of the drug a cytotoxicity assay based on
colony formation is also described since this allows continuous drug exposure.
2. Materials
1. Petri dishes (6 cm, tissue-culture grade).
2. Tissue-culture flasks (25 cm
2
).
3. Universal containers (30 mL).
4. Plastic box.
5. Wash bottles.
Cell Sensitivity Assays: Clonogenic Assay 19
6. Growth medium.
7. Phosphate buffered saline (PBS, Dulbecco’s A).
8. 0.25% Trypsin in PBS.
9. Methanol.
10. 1% Crystal Violet in water (Merck).
3. Methods
3.1. A Standard Clonogenic Assay
1. Trypsinise a sub-confluent monolayer culture and collect cells in growth medium
containing serum. Centrifuge the suspension (200g, 5 min) to pellet cells and
resuspend in fresh growth medium. Use a haemocytometer to count the cells and
ensure that a single cell suspension is obtained (see Note 1). Dilute cells to a
density of 8 × 10
4
cells/mL (see Note 2) in a total volume of 10 mL. Add 4 mL of
culture medium to each of 9 tissue culture flasks (25 cm
2
) and transfer 1 mL of
the cell suspension to each flask (see Note 3). Equilibrate with CO
2
and incubate
cells at 37°C for 2–3 d such that cells are in the exponential phase of growth for
drug addition.
2. Prepare a serial five-fold dilution of the cytotoxic drug in growth medium to give
eight concentrations (see Note 4). Pipet 6 mL of growth medium in to each of
seven universal containers (30 mL). Prepare 10 mL of the highest concentration
of the drug and transfer 1.5 mL of this solution to the first universal container.
Mix and then transfer 1.5 mL to the next universal. Continue until the seventh
universal is reached. The concentrations should be chosen such that the highest
concentration kills most of the cells and the lowest kills none of the cells (see
Note 5).
3. Label the nine flasks with one for each of the eight drug concentrations and one
as a control. Remove the medium from the flasks of cells. Add 5 mL of growth
medium to the control flask and 5 mL of the appropriate drug solution to the
other eight. Equilibrate the flasks with CO
2
and incubate at 37°C for 24 h (see
Note 6).
4. Remove the medium from the nine flasks, add 1 mL of trypsin solution and incu-
bate at 37
o
C. While waiting for the cells to detach, label the Petri dishes on the
side of the base (see Note 7). Use three dishes for the control and for each drug
concentration. When the cells have detached add 4 mL of growth medium to each
flask. Disperse the cells by repeat pipeting to give a single cell suspension and
transfer the flask contents to a universal container (30 mL). Count the cells from
the control flask only and dilute to give a density of 10
3
cells/mL and a total
volume of 4 mL (see Note 8). Follow exactly the same dilution steps for the cell
suspensions from each of the drug treated flasks (see Note 9). Transfer 1 mL of
the control cell suspension to each of the three labeled Petri dishes. Repeat for
each of the drug treatments. Finally, add 4 mL of growth medium to each Petri
dish (see Note 10). Place the Petri dishes in a plastic box and incubate for 10 days
in a humidified atmosphere at 37°C (see Note 11).
20 Plumb
4. Fill a wash bottle with PBS and a second with methanol. Remove and discard the
lids from the Petri dishes. Pour the medium from the Petri dish into a container
for disposal and carefully add about 5 mL of PBS to wash off the remaining medium.
Pour off the PBS and add about 5 mL of methanol and leave for 5 min. Repeat for all
dishes. After 5 min pour off the methanol and add another 5 mL of methanol to each
dish and leave for 5 min. Pour off the methanol and allow dishes to dry.
5. Add 5 mL of crystal violet to each Petri dish and leave for 5 min. Pour off the
stain and rinse the dish under running tap water to remove excess dye. Invert
dishes and leave to dry.
6. Count the colonies in each Petri dish (see Note 12). If the drug has a cytostatic effect
this will be seen as a reduction in the size of the colonies and should be apparent to the
naked eye. In this case, as well as counting the total number of colonies per dish, the
number of cells per colony should also be counted (see Note 13).
7. Calculate the mean colony count for each of the treatments. Divide the number of
colonies in the drug treated dishes by the number of colonies in the control dishes
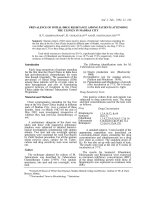
and express as a percentage. Plot a graph of percent survival (y axis) against drug
concentration (x axis). Results are usually expressed as the IC
50
value which is
the drug concentration required to kill 50% of the cells or as in this assay to
reduce the number of colonies to 50% of that in the control untreated dishes (see
Fig. 1). Values for the IC
10
and IC
90
can be determined in the same manner. The
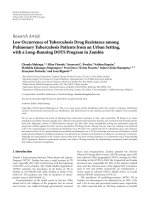
Fig. 1. A typical dose response curve obtained by clonogenic assay. The human
colon tumor cell line HT29 in exponential growth was exposed to mitomycin C for 3 h
and then plated out at a density of 500 cells/6 cm Petri dish. The mean colony count in
the control dishes was 281, which is a cloning efficiency of 56%. Three flasks of cells
were used at each dose level and each point is the mean ± standard error of the mean of
the three estimates. Estimation of the IC
50
value (the drug concentration required to
kill 50% of the cells) is shown by the straight lines.
Cell Sensitivity Assays: Clonogenic Assay 21
shape of the survival curve depends on a number of factors. For a cycle specific
drug and a homogeneous cell population the curve can be very steep such that
only a small increment of drug is required to go from 0–100% cell kill. Some-
times a tail is seen on the curve such that cell kill does not reach 100% even at
high drug concentrations. This can be due to the presence of a resistant subpopu-
lation. It can also occur when a phase specific drug, such as camptothecin, is used
and the duration of drug exposure is less than the cell doubling time. In this case
the tail should not be apparent if the drug exposure time is increased.
3.2. A Cytotoxicity Assay Based on Colony Formation
1. Trypsinise a sub-confluent monolayer culture and collect cells in growth medium
containing serum. Centrifuge the suspension (200g, 5 min) to pellet cells, resus-
pend in growth medium and count cells. Dilute cells to a density of 10
3
cells/mL
(see Note 7). Label Petri dishes (6 cm), allowing three per treatment, and add
1 mL of cell suspension to each dish. Add 3 mL of medium to the dishes and
place in a plastic box. Incubate in a humidified atmosphere at 37°C for 4 h to
allow cell to adhere (see Note 14).
2. Prepare a range of concentrations of the cytotoxic drug in growth medium (see
Notes 4 and 5). The drug is diluted five-fold when added to the Petri dishes, so
these solutions should be prepared at five times the required final concentration.
3. Add 1 mL of the drug solution to the 4 mL of medium in each of the three Petri
dishes. Incubate for 10 d in an humidified atmosphere at 37°C (see Notes 11 and 15).
4. Fix and stain the colonies and evaluate as for the standard clonogenic assay.
4. Notes
1. It is essential that a single cell suspension is plated out and it may be necessary to
adjust the trypsin concentration or duration of exposure to achieve this.
2. A density of 8 × 10
4
cells/25cm
2
culture flask is a suggested density for cells with
a doubling time of about 24 h and a plating efficiency of around 60%. Clearly the
density may need to be increased or decreased depending on the cell line used.
The aim is to obtain a sub-confluent culture of cells in the exponential phase of
growth for drug treatment.
3. An experimental design based on one control and eight drug treatments is a sug-
gested starting point and it should be noted that this does not include replicates.
The number of flasks that can be set up in one experiment is limited by the time
required to carry out step 4.
4. The drug solution should be prepared just before use and should be sterile. Many
cytotoxic drug are insoluble in water. Any diluent used to solubilize the drug
should be included as a separate control, usually at the highest concentration to
be used. DMSO can be used and since this is self sterile it avoids possible loss of
drug owing to binding to the filter. Most cells will tolerate up to 1% DMSO in
culture medium.
5. If the cytotoxicity of the drug is not known a serial dilution with a starting con-
centration of 10
–5
M can be used. Once the cytotoxicity is known the drug
concentration range can be reduced to cover the area of interest.
22 Plumb
6. The drug exposure period can be varied. As a rule cytotoxicity increases with
increasing drug exposure. The most marked effects are seen during the first 24 h
and sensitivity usually shows a plateau by 72 h. Factors to take into account are
the mechanism of action of the drug such that if it is S-phase specific the expo-
sure period should allow for all cells to have passed through S-phase. The stabil-
ity of the drug in culture medium should also be taken in to account. For drug
exposure periods of greater than 24 h, it is recommended that the drug is replaced
at 24 h intervals.
7. Do not label the lids, because these are removed when the colonies are fixed.
Make sure that the marker pen used is resistant to methanol.
8. Accuracy of the dilution is important and it is recommended that individual dilu-
tion steps are no greater than 1 in 10 and that the volume of cell suspension used
is greater than 200 µL. A density of 10
3
cells/mL is a suggested density assuming
a plating efficiency for the cell line of about 50%. This would give 500 colonies
in the control dishes. The aim is to retain separated colonies in the control dishes
at the end of the experiment but to still have a sufficient number of colonies in the
drug treated dishes to allow accurate estimation of survival at the higher drug
concentrations. It is possible to compensate for the low survival at higher drug
concentrations by increasing the number of cells plated out for these concentra-
tions. To do this either increase the volume of cell suspension used or reduce the
dilution factor.
9. It is not necessary to count the cells in the drug treated flasks because all flasks
contained the same number of cells at the start of the experiment. Any difference in
cell counts between the flasks at this stage is due to the effects of the drug and is
thus part of the experiment. Remember to resuspend the cells well before diluting.
10. Care must be taken to ensure an even distribution of cells in the Petri dish. This is
achieved if the cells are added first and then the bulk of the medium added. Do
not be tempted to swirl the dishes to mix the cells because this results in the cells
accumulating in the centre of the dish and forming one large colony.
11. The incubation time will vary depending on the doubling time of the cell line
used but is usually between 8–12 d. This allows for about 10 doubling times. It is
advisable to check the dishes after about 8 d and colonies should be clearly vis-
ible to the naked eye.
12. Following drug treatment some cells will plate and undergo a few cell divisions
before the damage is expressed. This leads to the formation of small colonies that
fail to develop further. These cells are not viable and the colonies should not be
counted. This is usually avoided by limiting the counts to those colonies that have
undergone more that five cell doublings, i.e., those containing more than 50 cells.
13. A cytostatic effect will result in a reduction in the number of cell doublings in a
given time and thus a reduction in the number of cells within a colony. There are
several ways of quantifying a cytostatic effect. The most direct method is to count
the number of cells in 50 representative colonies per dish. Alternatively, it can be
estimated by measuring the diameter of the colony and thus calculating the area
of the colony. This method assumes that there is no change in cell size.
Cell Sensitivity Assays: Clonogenic Assay 23
14. For most continuous cell lines, 4 h is sufficient for adherence to plastic. The time
can be increased, but it should not exceed the doubling time for the cell line
because the assay relies on colonies originating from single cells. In some proto-
cols the cells and drug are added together. The disadvantage of this approach is
that the drug may have an effect per se on the plating of the cells separate from
effects on cell survival.
15. This assay protocol is best suited to continuous drug exposure but it is possible to
limit the drug exposure time by replacing the medium. However, as explained in
Note 14 the total time for plating and drug exposure should not exceed the dou-
bling time for the cell line.
References
1. Dendy, P. P. and Hill, B. T. (1983) Human Tumour Drug Sensitivity Testing in
Vitro: Techniques and Clinical Applications. Academic, London.
2. Wilson, A. P., Ford, C. H. J., Newman, C. E., and Howell, A. (1984) A compari-
son of three assays used for the in vitro chemosensitivity testing of human
tumours. Br. J. Cancer 49, 57–63.
3. Weisenthal, L. M. (1981) In vitro assays in preclinical antineoplastic drug screen-
ing. Seminars Oncol. 8, 362–376.
4. Weisenthal, L. M., Dill, P. L., Kurnick, N. B., and Lippman, M. E. (1983) Com-
parison of dye exclusion assays with a clonogenic assay in the determination of
drug-induced cytotoxicity. Cancer Res. 43, 258–264.
5. Nias, A. H. W. and Fox, M. (1968) Minimum clone size for estimating normal
reproductive activity of cultured cells. Br. J. Radiol. 41, 468–474.
6. Weisenthal, L. M. and Lippman, M. E. (1985) Clonogenic and nonclonogenic in
vitro chemosensitivity assays. Cancer Treat. Rep. 69, 615–632.
7. Salmon, S. E. (1980) Cloning of Human Tumour Stem Cells. Liss, New York, NY.
8. Von Hoff, D. D. (1990) He’s not going to talk about in vitro predictive assays
again, is he? J. Natl. Cancer Inst. 82, 96–101.