multi omics approach to study the growth efficiency and amino acid metabolism in lactococcus lactis at various specific growth rates
Bạn đang xem bản rút gọn của tài liệu. Xem và tải ngay bản đầy đủ của tài liệu tại đây (1.37 MB, 12 trang )
Lahtvee et al. Microbial Cell Factories 2011, 10:12
/>
RESEARCH
Open Access
Multi-omics approach to study the growth
efficiency and amino acid metabolism in
Lactococcus lactis at various specific growth rates
Petri-Jaan Lahtvee1,2, Kaarel Adamberg2,3, Liisa Arike2,3, Ranno Nahku1,2, Kadri Aller1,2, Raivo Vilu1,2*
Abstract
Background: Lactococcus lactis is recognised as a safe (GRAS) microorganism and has hence gained interest in
numerous biotechnological approaches. As it is fastidious for several amino acids, optimization of processes which
involve this organism requires a thorough understanding of its metabolic regulations during multisubstrate growth.
Results: Using glucose limited continuous cultivations, specific growth rate dependent metabolism of L. lactis
including utilization of amino acids was studied based on extracellular metabolome, global transcriptome and
proteome analysis. A new growth medium was designed with reduced amino acid concentrations to increase
precision of measurements of consumption of amino acids. Consumption patterns were calculated for all 20 amino
acids and measured carbon balance showed good fit of the data at all growth rates studied. It was observed that
metabolism of L. lactis became more efficient with rising specific growth rate in the range 0.10 - 0.60 h-1, indicated
by 30% increase in biomass yield based on glucose consumption, 50% increase in efficiency of nitrogen use for
biomass synthesis, and 40% reduction in energy spilling. The latter was realized by decrease in the overall product
formation and higher efficiency of incorporation of amino acids into biomass. L. lactis global transcriptome and
proteome profiles showed good correlation supporting the general idea of transcription level control of bacterial
metabolism, but the data indicated that substrate transport systems together with lower part of glycolysis in L.
lactis were presumably under allosteric control.
Conclusions: The current study demonstrates advantages of the usage of strictly controlled continuous cultivation
methods combined with multi-omics approach for quantitative understanding of amino acid and energy
metabolism of L. lactis which is a valuable new knowledge for development of balanced growth media, gene
manipulations for desired product formation etc. Moreover, collected dataset is an excellent input for developing
metabolic models.
Background
Lactococcus (L.) lactis is the most intensively studied
lactic acid bacterium and it has a great industrial importance. In addition to its wide usage in the dairy industry,
L. lactis subsp. lactis IL1403 was the first lactic acid
bacterium whose genome was sequenced [1], and it is
extensively used for production of different metabolic
products and recombinant proteins [reviews in [2-4]].
As this bacterium is generally recognised as safe
(GRAS), there has been increasing interest in its use as
* Correspondence:
1
Tallinn University of Technology, Department of Chemistry, Akadeemia tee
15, 12618 Tallinn, Estonia
Full list of author information is available at the end of the article
a live vector for mucosal delivery of therapeutic proteins, including nasal and gastrointestinal vaccines [5,6].
However, there exists a remarkable lack of knowledge
about the peculiarities of L. lactis metabolic regulation,
especially regarding amino acid metabolism. There are
several defined media designed for L. lactis [7-9], however, these are unbalanced and concentrations of individual amino acids are quite high, making their
consumption measurements inaccurate as utilization by
the cells is small compared to the total content. Lack of
reliable information on consumption patterns and regulation of amino acid metabolism hinders design of
cheaper balanced complex media and optimization of
bioprocesses.
© 2011 Lahtvee et al; licensee BioMed Central Ltd. This is an Open Access article distributed under the terms of the Creative Commons
Attribution License ( which permits unrestricted use, distribution, and reproduction in
any medium, provided the original work is properly cited.
Lahtvee et al. Microbial Cell Factories 2011, 10:12
/>
Systems biology approaches where ‘omics’ methods
are combined with advanced cultivation methods, computational and mathematical models form a solid platform for elucidating quantitative peculiarities of
metabolism and its regulation in microorganisms. Transcriptome and proteome expression in L. lactis have
been measured and compared several times in various
phases of batch cultivations [10,11]. A multi-omics
study where L. lactis was cultivated at steady state conditions was carried out by Dressaire et al. [12,13]. They
characterized L. lactis at the transcriptome level in isoleucine limited chemostat cultures, calculated translation
efficiencies based on proteome and transcriptome levels,
and showed that energy costs associated with protein
turnover in cells are bigger at low growth rates in comparison with higher ones.
To provide more comprehensive knowledge about
amino acid metabolism in L. lactis we developed a new
medium, which allowed studying quantitative patterns
of amino acid consumption. To further link amino acid
metabolism with the overall physiological state of cells,
growth rate dependent trancriptomes, proteomes and
extracellular metabolomes were measured and studied
together with carbon, nitrogen and ATP, redox balance
analyses. L. lactis was cultivated in accelerostat (A-stat)
continuous cultures as this method allows acquisition of
vast amount of data on quasi steady state growing cells
and precise determination of growth characteristics,
especially investigation of dependences of growth characteristics on residual concentrations of growth limiting
substrate (e.g. glucose) which determines the specific
growth rate of cells (μ).
Results
L. lactis growth characteristics
L. lactis was cultivated in A-stat culture where after
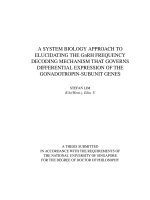
stabilisation in chemostat at dilution rate 0.10 h-1, specific growth rate (μ) was smoothly increased until the
maximal μ (μmax) was reached at 0.59 ± 0.02 h-1 (average value of five independent experiments ± standard
deviation; Figure 1). To obtain higher precision in the
determination of amino acid consumption patterns, concentrations of most amino acids in the growth medium
were reduced ca 3 times compared to the chemically
defined medium (CDM) [14], exceptions being arginine
and glutamine, whose concentrations were increased in
the medium to avoid amino group shortage during the
growth (see Methods). The residual glucose concentration remained below detection limit (<0.1 mM) between
μ 0.10 h -1 and 0.59 ± 0.02 h -1 in all five independent
experiments. It is important to note that constant protein content (45 ± 2% of cell dry weight) and constant
amino acid composition of the protein fraction was
observed in the full range of μ from 0.10 to 0.55 h -1
Page 2 of 12
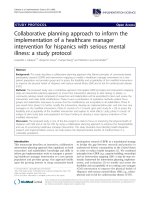
Figure 1 Typical A-stat cultivation, where dilution rate
dependent metabolism of L. lactis is illustrated. D - dilution rate
(h-1); X - biomass concentration (g (dry cellular weight) L-1); μ specific growth rate (h-1); lact, form, glc, eth, ace - lactate, formate,
glucose, ethanol, acetate concentration in bioreactor, respectively
(mM). D, μ and X are monitored constantly; metabolite
concentrations are measured with a frequency of approximately
0.01 h-1.
(Additional file 1, Table S1). RNA content increased
from 6.5 ± 1.0% to 9.5 ± 1.5% in cell dry weight in
between the latter μ values. The biomass yield per
consumed carbon (YXC) increased from 0.13 ± 0.00 to
0.17 ± 0.01 C-mol biomass C-mol carbon -1 when μ was
raised from 0.20 ± 0.02 h -1 to 0.52 ± 0.04 h -1 (Additional file 2, Table S1). It was realized by decrease of
by-product formation per biomass from 89.6 to 62.3
mmol gdw-1 (sum of Ylact, Yace and Yeth, Additional file
2, Table S1). Corresponding yield of these by-products
(lactate, acetate, ethanol) per consumed glucose
decreased from 2.05 to 1.88 mol products mol glc -1 , with
lactate yield per consumed glucose Y lg = 1.83 ± 0.03
mollact molglc-1 remaining constant. As by-product formation exceeded maximal possible yield (2 mol mol-1)
per consumed glucose at growth rates below 0.4 h -1
(Additional file 1, Table S2) it indicated that part of the
amino acids should have been catabolised to pyruvate
and eventually to by-products. The overall consumption
of amino acids decreased from 12.5 ± 0.5 mmol gdw-1
to 9.3 ± 0.3 mmol gdw-1 with increasing μ (Additional
file 2, Figure S1), exceeding two to three times that
required for synthesis of proteins in biomass (4.2 ± 0.1
mmol gdw-1, Additional file 1, Table S1), and constituting always 21 ± 1% (52 to 39 C-mmol gdw-1) of all the
total carbon utilised by cells throughout the μ range
studied.
For proof of principle, a chemostat experiment was
carried out at a dilution rate of 0.45 h-1 and the data
obtained were compared with the data obtained at the
same μ value in A-stat experiments. The measured substrate and product yields in chemostat culture had
values in the range of presented standard deviations for
A-stat data (Additional file 2, Table S2) which shows
Lahtvee et al. Microbial Cell Factories 2011, 10:12
/>
that quasi steady state data from A-stat is comparable to
chemostat.
Amino acid consumption profiles
Based on amino acid concentrations in the cultivation
broth, consumption patterns (mmolAA gdw-1) for all the
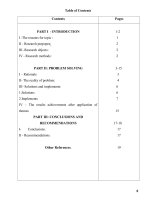
20 amino acids were calculated (Figure 2 and Additional
file 2, Figure S2). The most abundantly consumed
amino acid throughout the μ range studied was glutamine (Additional file 2, Figure S2). Asparagine, arginine,
serine, threonine, alanine, leucine, isoleucine and
cysteine were the next most intensively consumed
amino acids which consumption exceeded notably the
amounts necessary for biomass formation. Lysine, phenylalanine and valine were consumed in slightly higher
amounts than needed for biomass production. Consumption of aspartate, histidine, and proline were in the
range of measurement errors, hence, their consumption
can be considered minimal or nonexistent. It has been
shown that the latter amino acids are non-essential for
the growth of L. lactis [8].
In more detail, specific growth rate dependent consumptions of asparagine, threonine and cysteine per biomass were constant in the μ range of 0.10 - 0.20 h-1, but
decreased 30 to 40% from μ = 0.20 h-1 until μmax value
(Figure 2 and Additional file 2, Figure S2). Consumption
of arginine decreased rapidly in the μ range of 0.10 0.35 h-1 from 2.15 ± 0.04 mmol gdw-1 and levelled at
0.44 ± 0.07 mmol gdw-1 at higher growth rates (Figure 2)
- at an amount greater than necessary for biomass production (0.20 ± 0.02 mmol gdw-1). Decreasing trends in
the μ range 0.10 - 0.35 h -1 were observed for the
production of ornithine and for the production of the
only amino acid produced - glutamate. Glycine was the
only amino acid which consumption increased during
increasing μ (Figure 2), however, its consumption was
always lower than its need for biomass formation. Consumption of other amino acids (Gln, Ile, His, Leu, Lys,
Page 3 of 12
Met, Phe, Tyr, Trp, Val) did not change significantly
throughout the studied μ range, indicating also a more
efficient use of amino acids at higher μ values as growth
yields based on carbon and nitrogen consumption
increased.
Carbon, nitrogen and ATP balances
Carbon recovery which was calculated based on glucose
and amino acid consumptions, product and biomass formation was 100 ± 2% over the entire μ range (Additional
file 2, Figure S3). However, nitrogen recovery, calculated
based on amino acid utilization and ornithine, glutamate
and biomass formation, was 55 ± 3% (Additional file 2, Figure S3). Amino acids were the main nitrogen source in the
medium, comprising more than 99% of the consumed
nitrogen by the cultivated bacterium. Based on amino acid
utilization, the total consumption of nitrogen decreased
from 22 to 14 mmol gdw-1 between the μ range 0.10 - 0.59
± 0.02 h -1 . On the basis of monomer composition,
N-molar content in the biomass was found to be constant
at 7.2 mmol gdw-1 during the studied μ range. Concomitantly, nitrogen incorporation into the biomass increased
from 33 to 50% from total consumed nitrogen in amino
acids with increasing μ. The rest of nitrogen (50-67%)
could have been metabolised through arginine deiminase
(ADI) pathway, by excreting other amino acids (glutamate,
aspartate) or through deamination reactions (ammonium).
Activity of the ADI pathway decreased in the μ range
0.10 - 0.35 h-1 and nitrogen excretion to ornithine and
synthesis of exogenous NH3 declined from 4.7 to 0.5 mmol
gdw-1 (21 to 4% from total nitrogen consumed) in the
above μ range. In addition, 0.4 to 0.06 mmol gdw -1 of
nitrogen was excreted as glutamate and 0.1 mmol gdw-1
through transamination reactions with the formation of
the following compounds detected and quantified by
mass-spectrometry: 4-hydroxyphenylpyruvic acid, hydroxyphenyllactic acid, 2-hydroxy-3-methylbutyric acid, 2-hydroxyisocaproic acid and L-3-phenyllactic acid from tyrosine,
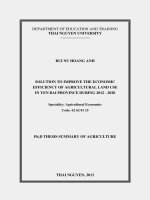
Figure 2 L. lactis dilution rate dependent amino acid consumptions (mmol gdw-1) for (A) arginine (thick line) and ornithine (thin line);
(B) asparagine (thick line), glycine (dashed line) and aspartate (thin line); (C) glutamine (thick line) and glutamate (thin line). Negative
numbers on chart represent production. Refer to Additional file 2, Figure S2 for consumption yields of all amino acids.
Lahtvee et al. Microbial Cell Factories 2011, 10:12
/>
phenylalanine or branched chain amino acids (data not
shown). The left-over of consumed nitrogen was 9.5 - 6.6
mmol gdw-1 (contributing 44 - 48% from total nitrogen)
in the μ range of 0.1 - 0.6 h-1. This nitrogen must have
been excreted as NH3 if the excess of consumed amino
acids not incorporated into protein fraction of biomass
would have been converted to pyruvate. The latter
assumption is supported by the fact that the carbon was
fully recovered during the growth. Reduction of carbon
and nitrogen wasting led to the increase of the biomass
yields based on carbon (including glucose and amino
acids) and nitrogen consumption 1.3 and 1.5 times,
respectively (from 0.12 to 0.15 C-mol C-mol-1 and from
0.33 to 0.50 N-mol N-mol-1), in parallel with the increase
of μ from 0.10 to 0.59 ± 0.02 h-1.
Based on biomass monomer composition and the stoichiometry of ATP, NAD(P)H and central metabolites for
monomer production, μ dependent ATP and NAD(P)H
balance calculations were carried out (Additional file 1,
Tables S3-S5). Calculations indicated that more ATP was
produced than necessary for biomass formation. Presumably the ATP synthesized in excess was wasted in futile
cycles. Calculated energy spilling was constant at 60
mmol ATP gdw -1 in the range of the μ 0.10 - 0.15 h -1
and decreased afterwards to 36 mmol gdw-1 at μmax, indicating that the metabolism was the most efficient near
μmax conditions (Additional file 1, Table S5). Similarly
calculated NAD(P)H misbalance (spilling) decreased
from 3.5 mmol gdw -1 at low growth rates to 0 mmol
gdw-1 at specific growth rate >0.45 h-1 (Additional file 1,
Table S5). However, latter improvement of balance is
inside the range of errors of lactate measurements (as
lactate dehydrogenase is the main NAD regeneration
reaction in lactic acid bacteria). Therefore a conclusion
that redox balance was maintained throughout the
studied growth conditions should be drawn.
Transcriptome and proteome response
Transcriptomes and proteomes at four different quasi
steady state μ values (0.17, 0.24, 0.44, 0.52 h-1) were compared to steady state μ = 0.10 h-1 (additional info in Methods). Changes in gene and protein expression levels for
the most relevant reactions between μ 0.52 and 0.10 h-1
are illustrated on Figure 3 and 4; a full list of measured
gene and protein expression changes at various μ values
can be found in Additional file 3. In this section we discuss
changes of mRNA and protein expressions significant with
P value ≤ 0.05 for μ 0.52 ± 0.03 h-1 vs. 0.10 h-1.
Mannose uptake genes ptnAB, which are responsible
for glucose transport in L. lactis, and ptsI were upregulated 2.1 to 4.3-fold at the transcriptome level at
higher growth rates (above 0.44 h-1). However, corresponding enzymes did not show any remarkable change
in the same growth rate range as measured in the
Page 4 of 12
proteome. Transporter genes for additional sugars (not
present in our medium) like galactose (by galE) and cellobiose (by ptcABC and yidB) were 1.8 to 2.9-fold
down-regulated at higher specific growth rates at the
transcriptome level, whereas a 2.2- to 2.8-fold repression
of PtcAB was measured for proteome. This down-regulation is known to be the consequence of carbon catabolite repression which is extensively studied also in other
bacteria like E. coli and B. subtilis [15,16].
Expression in the upper part of glycolysis did not
change significantly during increase of μ. However, the
lower part of glycolysis (from fbaA to eno) was 1.8- to
4-times up-regulated at the transcriptome level, but only
Pmg showed significant 1.6-fold up-regulation at the
proteome level at the growth rates higher than 0.44 h-1
(Figure 3). The pentose phosphate pathway showed a
1.3- to 2.0-fold down-regulation in genes deoBC, rpiA,
zwf, tkt, ywcC (Additional file 3), which might be
explained by a lower NADPH requirements at higher μ
conditions. Despite the down-regulation of pentose
phosphate pathway, genes encoding proteins involved in
purine and pyrimidine metabolism were up-regulated.
Moderate, 1.5- to 3.0-fold up-regulation both at the
transcriptome and proteome level of the operon PurABEFLMQ was observed. With the increase of purine and
pyrimidine metabolism, the need for amino group transfer from glutamine should have been also increased with
rising specific growth rate. In agreement with this,
expression of the genes in the first steps of purine and
pyrimidine synthesis, purF increased and carAB
remained constant respectively, with the increase of μ.
High glutamine availability was maintained presumably
by increased expression of glutamine transporter
(glnQP) and glutamine synthetase (glnA).
Considering pyruvate metabolism, decreased acetate
production was in accordance with the significant
down-regulation of genes eutD and ackA2 and their corresponding enzymes (see Figure 3). However, decreased
production of formate and lactate seemed not to be
regulated similarly with acetate - Pfl and Ldh showed no
major changes neither in gene nor protein expression
levels confirming that Ldh is regulated rather by the
NADH/NAD + ratio than by transcription and/or
translation, as proposed in literature [17]. Although
ethanol production decreased, AdhE expression
increased 7.3- and 1.8-fold in transcriptome and proteome analysis, respectively. This might be related to the
incorporation of ethanol formation pathway intermediate, acetaldehyde, to acetyl-CoA synthesis from deoxyribose. Pyruvate dehydrogenase subunits (PdhABCD) were
2- to 3-fold down-regulated at both levels (Figure 3).
It is well known, that L. lactis can direct part of the consumed (or de novo synthesised) serine into pyruvate by
sdaA and ilvA - this flux could form up to 10% of overall
Lahtvee et al. Microbial Cell Factories 2011, 10:12
/>
Page 5 of 12
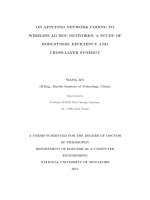
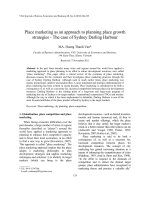
Figure 3 Overview of central carbon metabolism in L. lactis at various specific growth rates (μ). Black and capitalised metabolites were
measured extracellular. Measured metabolites in boxes/ellipses were consumed/produced, respectively. Red/green/white background represents
decrease/increase/no change, respectively, in metabolite consumption or production with increasing μ. Red arrows indicate decrease, green
arrows increase and black arrows no significant change in transcriptome and proteome expressions when μ 0.5 h-1 is compared with μ 0.1 h-1.
Orange arrows represent increase only at transcriptome level with increasing μ. Arrowheads indicate the assumed reaction directions. More
specific protein expression fold changes are illustrated on chart.
pyruvate flux [18]. In the current study, these noted genes
were 1.4- to 2.2-fold up-regulated comparing μ = 0.50 to
μ = 0.10 h-1. In concordance with the sharp decrease of
arginine consumption from μ 0.10 h-1 up to μ 0.35 h-1, the
2.3- to 4.5-fold decrease in protein expression of ArcAB,
which converts arginine to ornithine, was observed during
the increase of μ (Figure 4).
Discussion
Carbon balance and growth efficiency
Growth conditions have a strong influence on specific
growth rate (μ), macromolecular composition of biomass
(i.e. ribosomal content) and cell size of microorganisms
[18,19]. In this study, a gradual change to more efficient
carbon metabolism with the increase of μ was observed
for L. lactis (Figure 1). The first shift in L. lactis metabolism took place at μ 0.20 ± 0.02 h-1, when biomass yield
(YXC) per consumed carbon started to increase. Thirty
percent increase with the increase of μ from 0.10 to 0.60
h-1 was achieved by reduction of fermentation by-products
synthesis (acetate, formate, ethanol). Concomitantly to the
increase of biomass yield, calculated ATP balance showed
decreased energy spilling. It has been postulated that
higher energy spilling at lower μ conditions could be
Lahtvee et al. Microbial Cell Factories 2011, 10:12
/>
Page 6 of 12
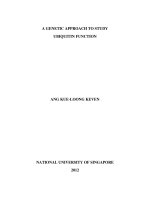
Figure 4 Overview of arginine and glutamine metabolism in L. lactis at various specific growth rates (μ). Black and capitalised
metabolites were measured extracellular. Measured metabolites in boxes/ellipses were consumed/produced, respectively. Red/white background
represents decrease/no change, respectively, in metabolite consumption or production with increasing μ. Red arrows indicate decrease, green
arrows increase and black arrows no significant change in transcriptome and proteome expressions when μ 0.5 h-1 is compared with μ 0.1 h-1.
Arrowheads indicate the assumed reaction directions. Underlined metabolites exist several times on chart. More specific protein expression fold
changes are illustrated on chart. Proteins PurF and YphF, represented only on charts, are involved in purine metabolism and converting
glutamine to glutamate. THF - tetrahydrofolate; aKG - a-ketoglutarate; Car-P - carbamoyl-phosphate, * - represents example pathway
components from literature [38,39].
caused by greater costs of turnover of macromolecules and
sensory molecules, establishment of ion gradients across
the cell membrane etc [20]. Dressaire et al. [12] calculated
the degradation rates for proteins and found that protein
median half-lives were ca 10-fold shorter at μ = 0.10 h-1
than at μmax. As ATP is consumed during protein degradation [21] this non-growth related expenditure might
form a higher proportion of the total energy synthesized at
lower μ conditions than at higher growth rates.
Nitrogen metabolism
With the increase of specific growth rate from 0.10 to
0.60 h-1 biomass yield YXN increased 1.5 times showing
that cells used nitrogen more effectively for biomass
production. The most important amino acid that plays
role in the observed reduction of nitrogen wasting was
arginine (arginine consumption decreased from 1.5 to
0.5 mmol gdw-1 with increase of μ from 0.1 to 0.35 h-1).
Throughout the μ range studied, arginine consumption
was 0.3 to 1.3 mmol gdw -1 higher than spent for biomass synthesis and majority of the consumed arginine
was transformed to ornithine (0.05 to 1.2 mmol gdw-1),
especially at lower specific growth rates, which indicates
energy limitation of cells. However, not all arginine left
over from calculated requirements for biosynthesis (0.1
to 0.25 mmol gdw-1) was converted to ornithine. Based
on annotated network of L. lactis there is no route for
consumption of ornithine other than that leading to the
synthesis of glutamate (mediated by ArgCDJFG, which
were reduced with increase of specific growth rates
especially after 0.4 h -1 ). Although the mechanisms of
arginine overconsumption in addition to ornithine production are not known, correlation between ornithine
production and glutamate synthesis was 0.99, which
shows that these syntheses were most probably coupled.
Production of glutamate has also been observed before,
when both glutamine and glutamate were present in the
cultivation medium [8,22].
Nitrogen wasting through glutamine metabolism was
not decreased during the increase of specific growth
rate. Glutamine, the most consumed amino acid (glutamine consumption covers 30 to 50% of total nitrogen
consumed, at μ 0.10 and 0.60 h-1, respectively), is used
for synthesis of biomass proteins and it is the donor of
amino groups in purine, pyrimidine and in aminosugar
production pathways (glutamine and glutamate requirements for transamination reactions in aminosugar and
nucleotide synthesis was in average 1.35 mmol gdw-1). It
should be noted that glutamine synthetase (glnA) was
highly expressed (having array spot intensity values up
to four times higher than these of average values of all
genes) and increased with increase of μ in parallel to
high consumption of the amino acid. Although we cannot argue over the direction of reactions on the basis of
our experimental data, it could be assumed that maintenance of high intracellular concentrations of glutamine
Lahtvee et al. Microbial Cell Factories 2011, 10:12
/>
Page 7 of 12
in the cells in the result of intense synthesis and consumption flows might be necessary to keep the transfer
of amino group effective.
The third biggest part of nitrogen wasting could be
associated with the consumption of asparagine, which
was reduced from 1.4 to 1.1 mmol gdw-1 with increase
of μ from 0.10 to 0.60 h -1 . Asparagine and aspartate
(which was not consumed and therefore should have
been produced from asparagine) are required for syntheses of nucleotides (in average 0.35 mmol gdw -1) and
proteins (in average 0.4 mmol gdw-1). It was shown that
0.35 to 0.65 mmol gdw-1 of asparagine was not used for
biosynthesis. Asparagine can be metabolised through
asparaginase (ansB) - however its expression was in the
range of threshold values in the mRNA array and corresponding protein was not detected. Instead of that the
high expression (array spot intensity values up to seven
times higher than these of average values of all genes) of
asparagine synthetase (asnB), which expression even
increased with increase of specific growth rate was
observed. Similarly to glutamine it could be assumed
that overconsumption of asparagine and high expression
of the relevant synthesis genes might be necessary to
keep the transfer of amino group effective. Energetically
transport of asparagine in L. lactis is much more efficient than aspartate [23], moreover, asparagine is probably preferentially directed towards the production of
aspartate [24,25]. Surplus of aspartate in its turn can be
directed into pyruvate by AspB (Figure 4).
The role of other amino acids (other than glutamine,
arginine and aspartate) in nitrogen wasting can be considered minimal as over-consumptions (amounts greater
than necessary for biomass production) of these amino
acids were below 0.2 mmol gdw -1 (cysteine, serine,
threonine) or 0.1 mmol gdw-1 (all other not mentioned
above).
Omics comparison
Good correlation with a Pearson coefficient up to 0.69
was observed between 600 measured protein and gene
expression data (Figure 5). An interesting phenomenon
was seen at μ values 0.52 ± 0.03 h-1 and 0.42 ± 0.02 h-1
compared to 0.10 h -1 : a large amount of genes upregulated at the transcriptome level showed only small
or no change at the proteome level (Figure 5). The vast
majority of members in this group were related to
ribosomal subunits (74% from all detected ribosomal
proteins), as well as lower glycolysis (FbaA, GapB, Pgk,
Eno) and amino acid or peptide transport (BusAB,
GlnPQ, GltPS, OptCD, PepCPX, PtnABD, PtsHI).
Up-regulation at the transcriptome level and no significant change at proteome level during anaerobic growth
of L. lactis in lower part of glycolysis have also been
noticed before [11,12]. Despite the relatively good
Figure 5 L. lactis transcriptome and proteome correlation at
various specific growth rates. “R” value on chart represents
Pearson coefficient. Six hundred proteins, with a standard deviation
less than 30% and their corresponding genes are indicated on a
graph.
Lahtvee et al. Microbial Cell Factories 2011, 10:12
/>
correlation between the transcriptomic and proteomic
data, several important regulations were observed only
at trancriptome level. The data obtained indicated
importance of taking into account the possibility of
allosteric regulation, and carrying out measurements of
fluxome in addition to transcriptome and proteome to
fully characterize regulation of metabolic pathways.
By scanning the entire range of specific growth rates
using A-stat experiments, it is possible to continuously
monitor the steady state metabolism using on-line sensors or frequently collected samples for at-line analyses.
Reproducibility of growth characteristics in A-stat were
compared with chemostat at μ 0.45 h-1 . All measured
substrate consumption and product formation yields
(including amino acids) remained within mentioned
standard deviation ranges indicating the accordance of
quasi steady state and steady state data (Additional file
2, Table S2). Recently, similar comparisons at the global
transcriptome level were conducted with E. coli achieving very good correlation with a Pearson coefficient
up to 0.96 [26]. In both studies, it was shown that the
A-stat cultivation technique allows precise monitoring
the sequence of metabolic switch points.
Conclusions
Distinct ratios of glucose and amino acids in the growth
media are very important for biomass yield optimization
as carbon and nitrogen metabolism are tightly coupled
in L. lactis. High biomass yields are crucial for producing vaccines using microorganisms and nutrient limitations can strongly affect achieving the desired results.
As was shown in this study, some amino acids were
consumed in large amounts (glutamine, asparagine, arginine) and more efficient growth might not be achieved
by insufficient supply of these compounds. There have
been several attempts to optimize the media for lactococci using a single omission technique [7,8], however, a
systematic approach taking into account that amino acid
requirements depend on environmental conditions (e.g.
at various μ values) has not yet been fully realized as it
is difficult using only batch cultivation. The current
work combining systematic continuous cultivation
approach with omics methods is therefore of high value
for better media design, as well as for understanding
principles of metabolism of the bacteria.
Using steady state cultivation methods and a systems
biology approach for characterisation of L. lactis metabolism, it was possible to demonstrate a shift to more
efficient metabolism at higher growth rates by increasing
the biomass yield, change towards homolactic fermentation, and decreasing the flux through alternative energy
generation pathways with lower efficiency than glycolysis
e.g. acetate formation and the ADI pathway.
Page 8 of 12
This study demonstrates the necessity of using strictly
controlled continuous cultivation methods in combination with a multi-omics approach and element balance
calculations to gain quantitative understanding of the
regulation of complex global metabolic networks, important for strain dependent media optimisation or the
design of efficient producer cells. However, questions
about rationale of 2-3 times over-consumption of amino
acids by cells and principles of properly balanced media
remain to be answered in full in the future studies.
Methods
Microorganism and medium
The strain used throughout these experiments Lactococcus
lactis subsp. lactis IL1403 was kindly provided by Dr. Ogier
from INRA (Jouy-en-Josas, France). Inoculum was prepared
using a lyophilized stock culture stored at -80°C which was
pre-grown twice on the cultivation medium. Chemically
defined medium with a reduced amino acid concentrations
were developed especially for better detection of amino
acids. Media contained 70% GIBCO™ F-12 Nutrient Mixture (Invitrogen Corporation, Carlsbad, CA) and 30% modified CDM (composition in [27]). This combination gave the
best trade-off for growth yield and maximal growth rate.
Composition of the final medium was as follows (mg L-1):
limiting substrate D-Glucose - 3500; L-Alanine - 78;
L-Arginine - 185; L-Asparagine - 74; L-Aspartic acid - 72;
L-Cysteine - 64; L-Glutamic acid - 70; L-Glutamine - 132;
Glycine - 58; L-Histidine - 60; L-Isoleucine - 102;
L-Leucine - 207; L-Lysine - 158; L-Methionine - 41;
L-Phenylalanine - 86; L-Proline - 92; L-Serine - 163; LThreonine - 76; L-Trypthophan - 16; L-Tyrosine - 29;
L-Valine - 107; Biotin - 0.305; Choline chloride - 9.8;
D-Pantothenate - 0.65; Folic Acid - 1.21; Niacinamide 0.325; Pyridoxine hydrochloride - 0.642; Riboflavin - 0.326;
Thiamine hydrochloride - 0.51; Vitamin B12 - 0.98; i-Inositol - 12.6; CaCl2 - 28; CuSO4 × 5H2O - 0.272; FeSO4 ×
7H2O - 0.71; MgCl2 - 58; KCl - 157; NaCl - 5580; Na2PO4
- 99; ZnSO4 × 7H2O - 1; Hypoxanthine-Na - 3; Linoleic
Acid - 0.1; Lipoic Acid - 0.1; Phenol Red - 0.8; Putrescine ×
2HCl - 0.1; Na-Pyruvate - 77; Thymidine - 0.5.
A-stat cultivations
A-stat cultivations were carried out in a 1 L Biobundle
bioreactor (Applikon, Schiedam, the Netherlands) controlled by an ADI1030 biocontroller (Applikon) and a
cultivation control program “BioXpert NT” (Applikon)
(detailed description in [28], with an addition of an
in situ OD sensor (model TruCell2; Finesse, San Jose,
CA)). Cultivations were carried out under anaerobic
conditions (N2-environment) with an agitation speed of
300 rpm at 34°C and pH 6.4. Five parallel A-stat experiments were carried out where after a batch phase,
Lahtvee et al. Microbial Cell Factories 2011, 10:12
/>
constant dilution rate (D = 0.1 h-1) was initiated. Culture was stabilised until constant optical density and
titration rate, pumping through at least 5 volumes of
medium. After achieving steady state conditions, acceleration of dilution rate (a = 0.01 h-2) was started. Additionally, a steady state chemostat experiment was
carried out at a dilution rate of 0.45 h-1 and results were
compared with data collected from the A-stat experiment at the same dilution rate. Average yield and metabolic switch point values with their standard deviations
were calculated based on five independent experiments,
additionally taking into account chemostat experiment
values at a dilution rate of 0.45 h-1.
Analytical methods and growth characteristics
Biomass was constantly monitored by measuring the optical density at 600 nm; biomass dry weight was determined
gravimetrically. Biomass correlation constant K was
0.372 ± 0.005 and was not specific growth rate dependent.
Levels of glucose, lactate, formate, acetate and ethanol in
the culture medium were measured with liquid chromatography (Alliance 2795 system, Waters Corp., Milford,
MA), using a BioRad HPX-87H column (Hercules, CA)
with isocratic elution of 5 mM H2SO4 at a flow rate of 0.6
mL min-1 and at 35°C. A refractive index detector (model
2414; Waters Corp.) was used for detection and quantification of substances. The detection limit for the analytical
method was 0.1 mM. Samples from culture medium were
centrifuged (14,000 × g, 4 min); supernatants were collected and analyzed immediately or stored at -20°C until
analysis. Free amino acid concentrations were determined
from the same sample (analysing frequency ca 0.02 h-1)
with an amino acid analyzer (Acquity UPLC; Waters
Corp.) according to the manufacturer’s instructions.
Empower software (Waters Corp.) was used for the data
processing. For measuring amino acid concentrations in
protein content, biomass was hydrolysed with 6 M HCl
for 20 h at 120°C. From hydrolyte, amino acids were determined as free amino acids described above. Protein content from biomass dry cell weight was calculated based on
amino acid analysis and, additionally, measured using the
Lowry method [29], where bovine serum albumin was
used as a standard. For measurement of DNA content in
biomass genomic DNA was extracted and measured using
instructions of RTP® Bacteria DNA Mini Kit (Invitec, Germany). Detailed protocol for fatty acid quantification is
described in [30]. Growth characteristics μ, YXS, YSubstrate,
YProduct were calculated as described previously [27,28].
For consumption calculations, measured medium concentrations were used.
Carbon, nitrogen and ATP balance calculations
For carbon balance calculations C-molar concentrations
of measured substrates, products and biomass were used
Page 9 of 12
(biomass C-molar concentration with a value 0.03625
C-mol gdw-1 was calculated based on monomer composition). For nitrogen balance calculations N-molar
amino acid consumptions, production of ornithine and
glutamate, ADI pathway activity and biomass composition (0.00725 N-mol gdw-1) were taken into account.
For calculations of ATP and NAD(P)H balance measured biomass, amino acid, RNA, DNA and fatty acid
contents were used. Other necessary data were adapted
from literature [31]. Stoichiometry of ATP, NAD(P)H
and central metabolites for monomer production were
taken from the Kyoto Encyclopaedia of Genes and Genomes database with an assumption
that amino acids were not synthesized. Specific calculations are presented in Additional file 1.
Gene expression profiling
Agilent’s DNA microarrays (Santa Clara, CA) were
designed in eArray web portal in 8 × 15K format, containing 7 unique probes per target m.
agilent.com/earray/. Target sequences for 2234 genes
were downloaded from Kyoto Encyclopaedia of Genes
and Genomes />For microarray analysis, steady state chemostat culture
of L. lactis IL1403 was used as reference (D = 0.10 h-1).
Subsequent quasi steady state points from A-stat experiment at specific growth rates 0.52 ± 0.03; 0.42 ± 0.02;
0.29 ± 0.01 h1 in biological duplicates and 0.17 h-1 were
compared to the reference sample. Transcript change
was considered significant if the P value between parallel
experiments was less than 0.05.
Total RNA was extracted and quantified, cDNA
synthesised and labelled as described previously [27],
with minor modification: 11 μg of total RNA was used
for cDNA synthesis. Hybridization, slide washing and
scanning was performed using standard Agilent’s
reagents and hardware .
Gene expression data was analyzed as described before
[27], except global lowess normalization was used. Spots
with intensities lower than 100 units in both channels
and outliers among technical replicates (according [32])
were filtered. After filtering, seven technical replicates
showed average standard deviation <10%. Gene (and
protein) expression measurement results are shown in
Additional file 3. DNA microarray data is also available
at NCBI Gene Expression Omnibus (Reference series:
GSE26536).
Protein expression profiling
For protein expression analysis, the steady state chemostat culture of L. lactis IL1403 was used as reference
(μ = 0.10 h-1). Quasi steady state points at μ = 0.20 ±
0.01, 0.30 ± 0.02, 0.42 ± 0.01 and 0.50 ± 0.01 h-1 were
Lahtvee et al. Microbial Cell Factories 2011, 10:12
/>
compared with the reference sample. Three biological
replicates were analysed.
Samples intended for proteome analysis were collected, washed with PBS (0.137 M NaCl, 2.7 mM KCl,
10.0 mM Na2HPO4, 1.4 mM KH2PO4), flash frozen in
liquid nitrogen and stored at -80°C prior to protein
extraction.
Proteins were extracted in ice-cold SDS-buffer
(100 mM Tris-HCl (pH 6.5), 1% SDS (w/v)). Cells were
disrupted as a result of agitating the suspension with
glass-beads at 4°C for 30 minutes. After centrifugation
for 30 min at 4°C, the supernatant was collected and the
protein concentration was determined by 2D Quant kit
(Amersham Biosciences, Buckinghamshire, UK) and protein samples were stored at -80°C until further analysis.
Aliquots of 100 μg cloroform/MeOH chloroform precipitated proteins from each sample were processed for
labeling with iTRAQ 4plex reagents (Applied Biosystems, Foster City, CA) according to manufacturer’s
instructions. Briefly, precipitated proteins were dissolved
in 0.5 M triethylammonium bicarbonate (TEAB) and
0.1% SDS, disulfide bonds were reduced in 5 mM
Tris-(2-carboxyethyl) phosphine (TCEP) for 1 h at 60°C,
followed by blocking cycteine residues in 10 mM methyl
methanethiosulfonate (MMTS) for 30 min at room temperature, before digestion with trypsin (1:40, enzyme to
protein ratio) overnight at 37°C. For labeling, each
iTRAQ reagent was dissolved in 70 μl of ethanol and
added to the respective peptide mixture. After 1 h incubation at room temperature the reactions were stopped
by adding 100 μl milliQ water and incubating for 30
min. All four samples were mixed together and ethanol
was removed by drying in a vacuum concentrator
(Model 5301, Eppendorf, Cambridgeshire, UK).
The combined peptide mixtures were separated into 10
fractions with a cation exchange cartridge system
(Applied Biosystems, Foster City, CA) by different
KH2PO4 concentrations (10-1000 mM) and cleaned by
StageTips [33]. All fractions were analyzed twice by
LC-MS/MS using an Agilent 1200 series nanoflow system
(Agilent Technologies, Santa Clara, CA) connected to a
Thermo Scientific LTQ Orbitrap mass-spectrometer
(Thermo Electron, San Jose, CA) equipped with a nanoelectrospray ion source (Proxeon, Odense, Denmark).
Purified peptides were dissolved in 0.5% formic acid and
loaded on self-packed fused silica emitter (150 mm ×
0.075 mm; Proxeon) packed with Repropur-Sil C18-AQ 3
μm particles (Dr. Maisch, Germany) using a flow rate of
0.7 μl min-1. Peptides were separated with a 180 min gradient from 3 - 40% B (A: 0.1% formic acid, B: 0.1% formic
acid/80% acetonitrile) using a flow-rate of 200 nl min-1
and sprayed directly into LTQ Orbitrap massspectrometer operated at 180°C capillary temperature
and 2.4 kV spray voltage.
Page 10 of 12
Mass spectrometry method combined HCD and CID
spectrums as described in Köcher et al. [34]. Briefly, full
mass spectra were acquired in profile mode, with mass
range from m/z 300 to 1800 at resolving power of
60000 (FWHM). Up to four data-dependent MS/MS
scans with CID and four scans with HCD tandem mass
spectrometry experiment triggered from the same precursor ion were acquired in centroid mode for each
FTMS full-scan spectrum. CID was carried out with a
target signal value of 10 000 in the linear ion trap, collision energy of 35%, Q value of 0.25 and an activation
time of 30 ms. HCD-generated ions were detected in
the Orbitrap using the target signal value of 10 000, collision energy of 35% and an activation time of 40 ms.
Each fragmented ion was dynamically excluded for 60s.
Raw files were extracted to .mgf files by MM File
Conversion Tools />mm-cgi/downloads.py. Each .mgf file was converted to a
QuantMerge file [34]. All files from the same sample
were merged together. Data generated was searched
against L. lactis IL1403 NCBI database (22092009) by
MassMatrix search tool [35]. A reversed decoy database
was used for false positives detection. In all cases, a peptide mass tolerance of 5 ppm was used and fragment ion
masses were searched with a 0.6 Da mass window. Two
missed cleavage sites for trypsin were allowed. Betamethylthiolation of a cysteine was set as a fixed modification and oxidation of methionine as a variable modification. Quantification was set as iTRAQ and
quantification statistics as arithmetic mean. Only proteins with confidence intervals of more than 95% were
allowed for further data analysis (Additional file 3). Proteomic analysis raw data is available at the PRIDE database [36] under accession
numbers 13105-13162 (username: review17185, password: wyd*b6_6). The data was converted using PRIDE
Converter />Protein expression change was considered significant if
the P value between parallel experiments was less than
0.05.
Additional material
Additional file 1: Specific growth rate dependent ATP and NAD(P)H
balance calculations for A-stat experiments with Lactococcus lactis
subsp. lactis IL1403.
Additional file 2: Supplementary figures and tables.
Additional file 3: Specific growth rate dependent mRNA and
protein expression changes from A-stat experiments with
Lactococcus lactis subsp. lactis IL1403. The expression fold change is
given accordingly: sample at respective specific growth rate (quasi steady
state) is divided by steady state chemostat sample (0.10 h-1). Average
log2 gene and protein expression changes were calculated from “n”
number of parallel A-stat experiments. In gene expression analysis spots
with intensities lower than 100 units in both channels and outliers
among technical replicates (according Rorabacher, 1991) were filtered. In
Lahtvee et al. Microbial Cell Factories 2011, 10:12
/>
protein expression analysis, proteins identified with a confidence interval
more the 95% and appearances in all mentioned parallels are presented.
Acknowledgements
The authors would like to thank Lauri Peil (University of Tartu) and Elina
Pelonen (Turku University of Applied Sciences and Åbo Akademi) for their
help in carrying out ‘omics analysis. The financial support for this research
was provided by the European Regional Development Fund project
EU29994, and Ministry of Education, Estonia, through the grant
SF0140090s08.
Author details
Tallinn University of Technology, Department of Chemistry, Akadeemia tee
15, 12618 Tallinn, Estonia. 2Competence Center of Food and Fermentation
Technologies, Akadeemia tee 15b, 12618 Tallinn, Estonia. 3Tallinn University
of Technology, Department of Food Processing, Ehitajate tee 5, 19086
Tallinn, Estonia.
1
Authors’ contributions
PJL, KAd, RV designed experiments and conceived the project. PJL, KAl
carried out experiments. PJL, RN, LA, KAl contributed in analytics and data
analysis. KAd was responsible for mathematical calculations. PJL drafted the
manuscript. KAd helped drafting the manuscript. RV, RN, LA edited the
manuscript. All authors read and approved the final manuscript.
Competing interests
The authors declare that they have no competing interests.
Received: 13 July 2010 Accepted: 24 February 2011
Published: 24 February 2011
References
1. Bolotin A, Wincker P, Mauger S, Jaillon O, Malarme K, Weissenbach J,
Ehrlich SD, Sorokin A: The complete genome sequence of the lactic acid
bacterium Lactococcus lactis ssp. lactis IL1403. Genome Research 2001,
11:731-53.
2. Hugenholtz J, Sybesma W, Groot MN, Wisselink W, Ladero V, Burgess K, van
Sinderen D, Piard JC, Eggink G, Smid EJ, Savoy G, Sesma F, Jansen T, Hols P,
Kleerebezem M: Metabolic engineering of lactic acid bacteria for the
production of nutraceuticals. Antonie Van Leeuwenhoek 2002, 82:217-35.
3. Kleerebezem M, Boels IC, Groot MN, Mierau I, Sybesma W, Hugenholtz J:
Metabolic engineering of Lactococcus lactis: the impact of genomics and
metabolic modelling. J Biotechnol 2002, 98:199-213.
4. Hugenholtz J: The lactic acid bacterium as a cell factory for food
ingredient production. Intern Dairy J 2008, 18:466-75.
5. Morello E, Bermúdez-Humarán LG, Llull D, Solé V, Miraglio N, Langella P,
Poquet I: Lactococcus lactis, an efficient cell factory for recombinant
protein production and secretion. J Mol Microbiol Biotechnol 2008,
14:48-58.
6. Bermúdez-Humarán LG: Lactococcus lactis as a live vector for mucosal
delivery of therapeutic proteins. Human Vaccines 2009, 5:264-7.
7. Jensen PR, Hammer K: Minimal Requirements for Exponential Growth of
Lactococcus lactis. Appl Environ Microbiol 1993, 59:4363-6.
8. Novak L, Cocaign-Bousquet M, Lindley N, Loubiere P: Metabolism and
energetics of Lactococcus lactis during growth in complex or synthetic
media. Appl Environ Microbiol 1997, 63:2665-70.
9. Zhang G, Block DE: Using highly efficient nonlinear experimental design
methods for optimization of Lactococcus lactis fermentation in
chemically defined media. Biotechnol Prog 2009, 25:1587-97.
10. Larsen N, Boye M, Siegumfeldt H, Jakobsen M: Differential expression of
proteins and genes in the lag phase of Lactococcus lactis subsp. lactis
grown in synthetic medium and reconstituted skim milk. Appl Envir
Microbiol 2006, 72:1173-9.
11. Mazzoli R, Pessione E, Dufour M, Laroute V, Giuffrida M, Giunta C, CocaignBousquet M, Loubière P: Glutamate-induced metabolic changes in
Lactococcus lactis NCDO 2118 during GABA production: combined
transcriptomic and proteomic analysis. Amino Acids 2010, 3:727-37.
Page 11 of 12
12. Dressaire C, Redon E, Milhem H, Besse P, Loubière P, Cocaign-Bousquet M:
Growth rate regulated genes and their wide involvement in the
Lactococcus lactis stress responses. BMC Genomics 2008, 9:343.
13. Dressaire C, Gitton C, Loubière P, Monnet V, Queinnec I, CocaignBousquet M: Transcriptome and proteome exploration to model
translation efficiency and protein stability in Lactococcus lactis. PLoS
Comput Biol 2009, 5:12.
14. Poolman B, Konings WN: Relation of growth of Streptococcus lactis and
Streptococcus cremoris to amino acid transport. J Bacteriol 1988,
170:700-707.
15. Görke B, Stülke J: Carbon catabolite repression in bacteria: many ways to
make the most out of nutrients. Nat Rev Microbiol 2008, 6:613-24.
16. Titgemeyer F, Hillen W: Global control of sugar metabolism: a grampositive solution. Antonie Van Leeuwenhoek 2002, 82:59-71.
17. Garrigues C, Loubiere P, Lindley ND, Cocaign-Bousquet M: Control of the
shift from homolactic acid to mixed-acid fermentation in Lactococcus
lactis: predominant role of the NADH/NAD+ ratio. J Bacteriol 1997,
179:5282-7.
18. Novak L, Loubiere P: The metabolic network of Lactococcus lactis:
Distribution of 14C-labeled substrates between catabolic and anabolic
pathways. J Bacteriol 2000, 182:1136-1143.
19. Molenaar D, van Berlo R, de Ridder D, Teusink B: Shifts in growth
strategies reflect tradeoffs in cellular economics. Mol Syst Biol 2009, 5:323.
20. Russell JB: The energy spilling reactions of bacteria and other organisms.
J Mol Microbiol Biotechnol 2007, 13:1-11.
21. Ogura T, Wilkinson AJ: AAA+ superfamily ATPases: common structure diverse function. Gen Cells 2001, 6:575-597.
22. Smid EJ, Konings WN: Relationship between utilization of proline and
proline-containing peptides and growth of Lactococcus lactis. J Bacteriol
1990, 172:5286-92.
23. Benthin S, Villadsen J: Amino acid utilization by Lactococcus lactis subsp.
cremoris FD1 during growth on yeast extract or casein peptone. J Appl
Microbiol 1996, 80:65-72.
24. Lapujade P, Cocaign-Bousquet M, Loubiere P: Glutamate biosynthesis in
Lactococcus lactis subsp. lactis NCDO 2118. Appl Envir Microbiol 1998,
64:2485-9.
25. Konings WN, Poolman B, Driessen AJ: Bioenergetics and solute transport
in lactococci. Crit Rev Microbiol 1989, 16:419-76.
26. Valgepea K, Adamberg K, Nahku R, Lahtvee PJ, Arike L, Vilu R: Systems
biology approach reveals that overflow metabolism of acetate in
Escherichia coli is triggered by carbon catabolite repression of acetylCoA synthetase. BMC Syst Biol 2010, 4:166.
27. Lahtvee PJ, Valgepea K, Nahku R, Abner K, Adamberg K, Vilu R: Steady state
growth space study of Lactococcus lactis in D-stat cultures. Antonie Van
Leeuwenhoek 2009, 96:487-96.
28. Adamberg K, Lahtvee PJ, Valgepea K, Abner K, Vilu R: Quasi steady state
growth of Lactococcus lactis in glucose-limited acceleration stat (A-stat)
cultures. Antonie van Leeuwenhoek 2009, 95:219-26.
29. Lowry OH, Rosebrough NJ, Farr AL, Randall RJ: Protein measurement with
the Folin phenol reagent. J Biol Chem 1951, 193:265-75.
30. Špitsmeister M, Admaberg K, Vilu R: UPLC/MS based method for
quantitative determination of fatty acid composition in Gram-negative
and Gram-positive bacteria. J Microbiol Methods 2010, 82:288-95.
31. Oliveira A, Nielsen J, Forster J: Modeling Lactococcus lactis using a
genome-scale flux model. BMC Microbiol 2005, 5:39.
32. Rorabacher DB: Statistical treatment for rejection of deviant values:
critical values of Dixon’s “Q” parameter and related subrange ratios at
the 95% confidence level. Analyt Chem 1991, 63:139-146.
33. Rappsilber J, Mann M, Ishihama Y: Protocol for micro-purification,
enrichment, pre-fractionation and storage of peptides for proteomics
using StageTips. Nat Prot 2007, 2:1896-906.
34. Köcher T, Pichler P, Schutzbier M, Stingl C, Kaul A, Teucher N, Hasenfuss G,
Penninger JM, Mechtler K: High precision quantitative proteomics using
iTRAQ on an LTQ Orbitrap: a new mass spectrometric method
combining the benefits of all. J Prot Research 2009, 8:4743-52.
35. Xu H, Freitas MA: MassMatrix: a database search program for rapid
characterization of proteins and peptides from tandem mass
spectrometry data. Proteom 2009, 9:1548-55.
36. Martens L, Hermjakob H, Jones P, Adamski M, Taylor C, States D, Gevaert K,
Vandekerckhove J, Apweiler R: PRIDE: the proteomics identifications
database. Proteomics 2005, 5:3537-3545.
Lahtvee et al. Microbial Cell Factories 2011, 10:12
/>
Page 12 of 12
37. Barsnes H, Vizcaíno JA, Eidhammer I, Martens L: PRIDE Converter: making
proteomics data-sharing easy. Nat Biotechnol 2009, 27:598-599.
38. Ganesan B, Dobrowolski P, Weimer BC: Identification of the leucine-to-2methylbutyric acid catabolic pathway of Lactococcus lactis. Appl Environ
Microbiol 2006, 72:4264-73.
39. Chambellon E, Rijnen L, Lorquet F, Gitton C, van Hylckama Vlieg JET,
Wouters JA, Yvon M: The D-2-hydroxyacid dehydrogenase incorrectly
annotated PanE is the sole reduction system for branched-chain 2-keto
acids in Lactococcus lactis. J Bacteriol 2009, 191:873-81.
doi:10.1186/1475-2859-10-12
Cite this article as: Lahtvee et al.: Multi-omics approach to study the
growth efficiency and amino acid metabolism in Lactococcus lactis at
various specific growth rates. Microbial Cell Factories 2011 10:12.
Submit your next manuscript to BioMed Central
and take full advantage of:
• Convenient online submission
• Thorough peer review
• No space constraints or color figure charges
• Immediate publication on acceptance
• Inclusion in PubMed, CAS, Scopus and Google Scholar
• Research which is freely available for redistribution
Submit your manuscript at
www.biomedcentral.com/submit