New approach to prevent premature capacity loss of lead-acid battery in cycle use docx
Bạn đang xem bản rút gọn của tài liệu. Xem và tải ngay bản đầy đủ của tài liệu tại đây (1.95 MB, 9 trang )
A
vailable online at www.sciencedirect.com
Journal of Power Sources 179 (2008) 799–807
New approach to prevent premature capacity
loss of lead-acid battery in cycle use
Ken Sawai
∗
, Yuichi Tsuboi, Yuichi Okada,
Masaaki Shiomi, Shigeharu Osumi
Technical Development Division, Industry Business Unit, GS Yuasa Power Supply Ltd.,
Nishinosho, Kisshoin, Minami-ku, Kyoto 601-8520, Japan
Received 3 December 2007; accepted 20 December 2007
Available online 9 January 2008
Abstract
Pb–Ca foil laminated on rolled sheet for positive grid of lead-acid battery is proposed to prevent premature capacity loss (PCL) during
charge–discharge cycling. Batteries with Pb–Ca foil laminated on positive grid had longer life during charge–discharge cycle than conventional
battery, which failed early by PCL. PCL is a phenomenon due to the increase of the interfacial resistance between the positive grid and the positive
active mass (PAM) during discharging by PbSO
4
formation in the corrosion layer. Positive plates suffered from PCL when the compression between
the grid and the PAM was poor, H
2
SO
4
concentration at the interface was high or the corrosion layer mainly consisted of -PbO
2
. Adhesion between
the PAM and Pb–5%Sb alloy or Pb–1%Ca alloy was firmer than that between the PAM and Pb–0.06%Ca–1.5%Sn. Corrosion layer formed at the
interface between grid material and the PAM during cycle included more ␣-PbO
2
on Pb–5%Sb and on Pb–1%Ca than on Pb–0.06%Ca–1.5%Sn.
It was found out that excellent cycle life performance with Pb–1%Ca foil against PCL is due to firm adhesion between the PAM and grid material,
and that ␣-PbO
2
is formed at the interface as a result of firm adhesion of the PAM and Pb–1%Ca grid.
© 2007 Elsevier B.V. All rights reserved.
Keywords: Lead-acid battery; Premature capacity loss (PCL); Positive plate; Grid; Laminate
1. Introduction
It is well known that some valve-regulated lead-acid (VRLA)
batteries with antimony-free positive grid lose discharge capac-
ity earlier than expected under certain conditions, even in a
floating application [1–3]. This phenomenon is called “pre-
mature capacity loss (PCL)”. PCL is caused by the capacity
loss of the positive plates, typically during deep discharge and
full charge cycle [3]. Discharge capacity of the battery with
pure Pb grid plates decreased after a few cycles because the
grid surface was passivated with corrosion layer during cycling,
although it did not decline with Pb–Sb grid plates and the grid
surface was not passivated [4,5]. It means that if the positive
grid includes Sb in its composition, PCL is prevented. On the
other hand, Sb is oxidized and the ion is dissolved into the
electrolyte [6] and precipitates on the negative electrode as Sb
∗
Corresponding author. Tel.: +81 75 312 2123; fax: +81 75 316 3798.
E-mail address: (K. Sawai).
metal during cycling. It lowers the hydrogen overpotential of
the negative electrode and causes more water loss and dry out
of the cell [7]. Therefore, a number of studies have been car-
ried out to prevent PCL with antimony-free positive grid so
far.
Large current charging was found to delay PCL [5,8,9].A
barrier layer formed on a Pb–Ca–Sn grid during discharging
was found to be PbSO
4
when PCL occurred [8,10,11]. These
papers mentioned above dealt with the interface between the
grid and the positive active mass (PAM).
On the other hand, there were papers dealing with PAM char-
acteristics, especially changes in the connection or the size of
the PAM particles, which was affected by the charging condi-
tions [12–15]. These papers described how PCL phenomenon
was caused by increase of positive plate resistance. However,
PCL mechanism is different in each paper.
In the former report [2], PCL was found to be a phenomenon
due to the increase of the interfacial resistance between the grid
and the PAM by the direct measurements of resistance across
the interface and in the PAM.
0378-7753/$ – see front matter © 2007 Elsevier B.V. All rights reserved.
doi:10.1016/j.jpowsour.2007.12.106
800 K. Sawai et al. / Journal of Power Sources 179 (2008) 799–807
Effects of Sb addition toprevent PCL are explained by change
of corrosion layer in physical and chemical characteristics.
Oxide layer formed on Pb–Sb alloy is hard to crack, while
that formed on Pb metal is dense and crack and come off easily
[16]. Oxide layer formed on Pb–Sb is thicker and includes more
water than that formed on Pb [17]. The texture of oxide layer
surface is finer on Pb–Sb than on Pb [18].
Another effect of oxide layer including Sb is to improve the
electrical conductivity [19,20]. It is supposed that conductivity
of gel of Pb–O–Pb chain structure [21] increases more, or PbO
x
is formed more in the interfacial layer by oxidation of t-PbO
[22] on Pb–Sb rather than on Pb.
Other papers reported that oxide layer including Sb consists
of ␣-PbO
2
[23], and ␣-PbO
2
becomes more stable with Sb doped
[3]. In acidic solution, -PbO
2
is more stable than ␣-PbO
2
,but
is rapidly reduced to PbSO
4
[24]. Therefore, it is supposed that
␣-PbO
2
becomes stable with Sb and the ␣-PbO
2
layer keeps
the conductive path at the PAM/grid interface from reduction to
PbSO
4
.
In this report, Pb–Ca alloy laminated on rolled sheet for the
positive expanded grid is proposed to increase adhesion of the
PAM to grid and to control PCL phenomenon.
2. Influence of the interface state between the grid and
the PAM on endurance against PCL
A functional electrode and cell were designed and tested
to examine the effects of the reactivity of the corrosion layer
between the positive grid and the PAM on endurance against
PCL.
2.1. Experimental
The PAM paste made from leady oxide powder (raw mate-
rial of lead-acid battery active material), water and sulfuric acid
was filled into a hole (diameter: 25 mm, thickness: 3 mm) in
a resin frame. It was cured under 3BS (tribasic lead sulfate,
3PbO·PbSO
4
·H
2
O) conditions on Pb–0.06%Ca–1.5%Sn sheet.
Then, it was formed (oxidized) by electrochemical oxidation to
a PAM tablet (density: 3.7 g cm
−3
) on the Pb–0.06%Ca–1.5%Sn
sheet. After formation, this tablet of the PAM was taken off the
Pb alloy sheet and its surface was polished to make it smooth.
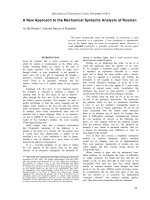
This tablet was put on a Pb–0.06%Ca–1.5%Sn (percentage of
alloy composition means mass % in this report) alloy flat cur-
rent collector, as shown in Fig. 1(a) on which corrosion layer was
formed in advance. An absorptive glass mat (AGM) separator, a
conventional negative plate and a weight were put on the PAM
tablet. 5.26 M H
2
SO
4
was poured to be retained in the PAM,
AGM and negative active material (NAM) before the weight
was put on. Fig. 1(b) shows the construction of the “tablet plate
cell”.
The resistance of the electrolyte at the interface area between
the current collector (Pb alloy) and the PAM can be changed by
mass of the weight and by adding a different concentration of
electrolyte directly on the corrosion layer.
A light weight means relatively small adhesion between the
PAM and the corrosion layer on the current collector. This would
Fig. 1. Schematic diagram of (a) current collector and (b) “tablet plate” cell.
cause high mobility and low resistance of H
2
SO
4
around the
corrosion layer area. Thus, the effect of electrolyte resistance at
the interface area on endurance against PCL can be examined
with this tablet plate cell.
Two different compounds (␣-PbO
2
and -PbO
2
) were formed
as the corrosion layer by anodic oxidation of the current collector
surface before the PAM tablet was put on, in order to examine the
effect of the corrosion layer reactivity on PCL phenomenon. In
general, it is known that -PbO
2
is more reactive than ␣-PbO
2
and shows a higher utilization rate when discharged [24].In
case of conventional positive plates with grid and the PAM, the
composition of the corrosion layer cannot be changed without
changing other material conditions, such as the PAM composi-
tion or physical characteristics. However, with this tablet plate,
the composition of the corrosion layer can be changed without
changing any other material conditions.
The ␣-PbO
2
corrosion layer was made by anodic oxidation
in 0.1 M NaOH, while the -PbO
2
corrosion layer was made
by anodic oxidation and one discharge–charge cycle in 0.82 M
H
2
SO
4
.
Details of the cell composition are described in Table 1. These
cells were discharged at 150 mA (i.e. 27.5 mA g
−1
of the PAM)
at 25–30
◦
C and discharge voltage was measured.
2.2. Results and discussions
The change of discharge voltage of the cells with various
weights is shown in Fig. 2. Voltage of cells with weight of less
than 450 g (9.0 kPa compression at interface area) dropped at
short time discharge. There were no effects on the cells with the
K. Sawai et al. / Journal of Power Sources 179 (2008) 799–807 801
Table 1
Detail of the tablet paste cells
Cell No. Corrosion layer H
2
SO
4
concentration (M) Mass of weight (g)
In AGM separator, PAM and NAM Around corrosion layer
1 -PbO
2
rich
a
5.26 5.26 300
2 -PbO
2
rich 5.26 5.26 450
3 -PbO
2
rich 5.26 5.26 600
4 -PbO
2
rich 5.26 5.26 1000
5 -PbO
2
rich 5.26 5.26 2000
6 -PbO
2
rich 5.26 7.21 2000
7 ␣-PbO
2
rich
b
5.26 7.21 2000
a
Made by one reduction–oxidation cycle after anodic oxidation (100 mA × 48 h in 0.82 M H
2
SO
4
).
b
Made by anodic oxidation: 100 mA × 48 h in 0.1 M NaOH.
Fig. 2. Discharge characteristics of the “tablet plate cell” at 150 mA, 25–30
◦
C
with a weight of 300 g (), 450 g (), 600 g (), 1000 g (᭹), 2000 g ()onthe
plates.
weight of more than 600 g (12 kPa compression). The decline of
discharge voltage is not due to just the poor contact between the
current collector and the PAM, because the discharge voltages
of all the cells at the beginning of discharge are all the same,
notwithstanding the weight difference. Therefore, this decline
in discharge capacity of the cells with light weight is assumed
to be due to PCL phenomenon.
It was found from these results that PCL is largely affected
by the adhesion between the PAM and the current collector
(-PbO
2
corrosion layer), and that discharging of the corro-
sion layer causes the increase of internal resistance during
discharge.
The change of discharge voltage of the cells under various
interfacial conditions is shown in Fig. 3. The discharge voltage
of the positive electrode with 7.21 M H
2
SO
4
on the -PbO
2
corrosion layer (cell No. 6) dropped at shorter time than that
with 5.26 M H
2
SO
4
(cell No. 5), although the discharge voltages
at the beginning of the discharge were not different for the both
cells. In this experiment, a 2000 g weight (40 kPa compression)
was applied to the cells and they did not fail by poor adhesion.
It was found that high concentration H
2
SO
4
around the -PbO
2
corrosion layer accelerate PCL, even if the adhesion is good
between the current collector and the PAM. It may be because
the electrode potential of the corrosion layer becomes higher and
the corrosion layer is preferentially discharged when the H
2
SO
4
concentration around the corrosion layer increased.
On the other hand, the positive electrode with 7.21 M H
2
SO
4
on the ␣-PbO
2
corrosion layer (cell No. 7) did not show PCL
behavior at all. These experimental results proved that the effect
of corrosion layer composition on PCL phenomenon is much
larger than that of the local H
2
SO
4
concentration. Especially the
␣-PbO
2
corrosion layer can prevent PCL, even in a high H
2
SO
4
concentration around corrosion layer. This may be caused by the
reactivity or the electrode potential difference between ␣-PbO
2
and -PbO
2
.
3. Adhesion between the PAM and grid after the
positive plates curing
In the Section 2, PCL was found out to be the phenomenon
that the corrosion layer of grid discharges earlier than the PAM
to increase the internal resistance of the cell, and it is largely
affected by the adhesion between the PAM and the current col-
lector. For the positive plates of the test cells in the Section 2,
the adhesion was kept with load of a weight during discharging.
However, in lead-acid batteries, it is difficult to keep adhesion
by direct compression to the plates. Therefore, it is important
to make the adhesion of the PAM to grid tight during the plate
manufacturing process.
Fig. 3. Discharge characteristics of the “tablet plate cell” at 150 mA, 25–30
◦
C
under various conditions of sulfuric acid concentration at interfacial area and
corrosion layer composition on the current collector. The conditions are; 5.26 M
H
2
SO
4
, -PbO
2
(); 7.21 M H
2
SO
4
, -PbO
2
(); 7.21 M H
2
SO
4
, ␣-PbO
2
().
802 K. Sawai et al. / Journal of Power Sources 179 (2008) 799–807
Adhesion between the PAM tablet and grid alloy was mea-
sured after curing before formation for grid alloy sheets of
various composition.
3.1. Experimental
A paste tablet was put on a sheet of grid alloy and cured. The
force to take the unformed PAM tablet off the Pb alloy sheet was
measured after curing, in place of the adhesion measurement
between the PAM tablet and grid alloy. Three types of Pb alloy
were tested, Pb–0.06%Ca–1.5%Sn, Pb–1%Ca, and Pb–5%Sb.
Test samples were prepared as follows. The schematic diagram
is shown in Fig. 4.
(1) 2 mm thick Pb alloy sheet was cut into 20 mm × 20 mm size.
(2) Paste made from leady oxide, sulfuric acid, and water was
mixed into paste and filled in 20 mm × 20 mm × 3 mm ABS
frame.
(3) The paste tablet was set on the alloy sheet, just after filling.
(4) The paste tablet and sheet sample was cured in 50
◦
C, 80%
relative humidity for 30 min to 72 h with constant compres-
sion at 2.45–24.5 kPa by the weight of 100–1000 g on the
samples (Fig. 4a).
(5) Samples were vacuum dried at 50
◦
C for 24 h.After curing,
the force to take the PAM tablet off the Pb alloy sheet was
measured as follows. The schematic diagram is shown in
Fig. 4(b).
(6) A sample after drying was set on the adhesion measuring
stage.
Fig. 4. Schematic diagram of curing the paste tablet with Pb alloy sheet and
the adhesion measuring stage for the unformed PAM tablet plate sample after
curing.
Fig. 5. Force to take the unformed PAM tablet off Pb sheet during curing with
24.5 kPa compression to the PAM/sheet interface. Composition of the sheet was
Pb–0.06%Ca–1.5%Sn () and Pb–1%Ca ().
(7) Steel plate of 2 mm thick × 11 mm wide was lowered with
10 mm min
−1
speed, as illustrated in Fig. 4(b).
(8) The force worked to the steel plate was measured by load
cell set on it, at taking the PAM tablet off the Pb alloy sheet.
Each test was repeated for three samples and average force to
take off was calculated.
3.2. Results and discussion
Fig. 5 shows the force to take the cured PAM tablet off the
Pb alloy sheet after curing for various times. It shows that adhe-
sion between the unformed PAM and Pb–1%Ca alloy begin to
increase after 2 h from the start of curing. The force to take
the PAM tablet off the sheet after 24 h exceeded 80 kPa, and was
almost the same after 72 h. Therefore, adhesion of the PAM to the
sheet become tight enough after 24 h curing. On the other hand,
the force to take the PAM tablet off the Pb–0.06%Ca–1.5%Sn
alloy sheet was less than 10 kPa even after 72 h curing. Adhe-
sion to the Pb–0.06%Ca–1.5%Sn alloy sheet did not become
tight under these conditions.
Fig. 6 shows the relationship between the compression to
the PAM tablet/various alloy sheet interface during curing and
the adhesion. The force to take the PAM tablet off increased
when the compression increased. For Pb–0.06%Ca–1.5%Sn
alloy, force data “0” means that the PAM came off before set-
ting the sample on the measuring stage. Adhesion between the
PAM and the Pb–1%Ca or Pb–5%Sb alloy is much higher than
Pb–0.06%Ca–1.5%Sn alloy, especially cured with compression.
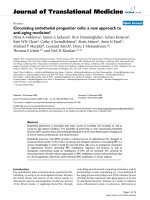
Fig. 7 shows the photograph of the sheet samples after taking
the PAM off. Pb–0.06%Ca–1.5%Sn sample was metallic lead
color and relatively smooth. It means that the sheet surface
was little corroded. Contrary, the surface of the Pb–1%Ca or
Pb–5%Sb sheets was clearly covered by the oxide layer. The
oxide corrosion layer is presumed to play role as glue in the
interface.
K. Sawai et al. / Journal of Power Sources 179 (2008) 799–807 803
Fig. 6. Force to take the unformed PAM tablet off Pb alloy sheet after curing
with various compression to the PAM/sheet interface. Composition of the sheet
was Pb–0.06%Ca–1.5%Sn (), Pb–1%Ca (), and Pb–5%Sb ().
Corrosion layer of Pb alloy sheet after taking the PAM
tablet off was analyzed by X-ray diffraction analysis (XRD).
Fig. 8 shows the XRD pattern of corrosion layer on
Pb–0.06%Ca–1.5%Sn (Fig. 8a), Pb–1%Ca (Fig. 8b), and
Pb–5%Sb (Fig. 8c) after 24 h curing. Each corrosion layer
after curing was found to consist of PbO, PbO hydrate,
PbSO
4
, and 3BS. The peak intensity for metal lead (m-Pb)
on Pb–0.06%Ca–1.5%Sn was higher than on Pb–1%Ca or on
Pb–5%Sb compared with peaks for PbO. It shows that the
corrosion layer on Pb–0.06%Ca–1.5%Sn is thinner because
Pb–0.06%Ca–1.5%Sn alloy can resist corrosion, however, it
also means that the alloy is less adhesive to the PAM oxide
tablet through the corrosion layer. On the other hand, the peak
intensity for metal lead (m-Pb) on Pb–1%Ca was lower than
on Pb–5%Sb. It shows that Pb–1%Ca is more corrosive and
is more adhesive to the PAM through the corrosion layer than
Pb–5%Sb. They are consistent with the adhesion measurement
results.
It was found out that Pb–1%Ca as well as Pb–Sb alloy could
make the adhesion tight between the PAM and the grid in the
positive plates.
Fig. 8. X-ray diffraction pattern of current collector surface of; (a)
Pb–0.06%Ca–1.5%Sn; (b) Pb–1%Ca; (c) Pb–5%Sb; after taking the PAM off
after curing for 24 h at 50
◦
C, 80% relative humidity, with compression of
24.5 kPa.
4. Changes of interfacial states between the PAM and
grid during cycling
The changes in the composition of the corrosion layer at the
interface between the current collector and the PAM during the
test cycle were examined.
4.1. Experimental
Electrodes with PAM (diameter: 20 mm, thickness: 3 mm,
density: 3.7 g cm
−3
) on a Pb alloy current collector were man-
Fig. 7. Photograph of Pb alloy sheets surface after taking the PAM tablet off. Curing conditions were 24 h at 50
◦
C, 80% relative humidity, with compression of
24.5 kPa. Composition of the sheet was (a) Pb–0.06%Ca–1.5%Sn, (b) Pb–1%Ca, and (c) Pb–5%Sb.
804 K. Sawai et al. / Journal of Power Sources 179 (2008) 799–807
Fig. 9. Schematic diagram of the experimental cell for cycle test with PAM
pasted directly on a current collector.
ufactured, as shown in Fig. 9. The PAM paste made from leady
oxide powder, water and sulfuric acid was pasted on a Pb alloy
current collector directly. Next, it was cured for 24 h at 50
◦
C,
80% relative humidity withcompression of 24.5 kPa, andformed
with compression by electrochemical oxidation to a PAM tablet
on the current collector. Then, an AGM separator, a negative
plate of larger capacity than that of the positive electrode with
PAM and a 1000-g weight were put on it, and 5.65 M H
2
SO
4
was poured into the cell. In this way, 300 mAh capacity cells
were constructed. The cells were subjected to the cycling test of
discharge with 100 mA for 20 min and charge with 15 mA for
200 min at 50
◦
C. The samples were picked out at planned cycles
and chemical composition of the corrosion layer at the current
collector/PAM interface was measured. Cells with current col-
lectors of Pb–3%Sb–0.25%As alloy and Pb–1%Ca alloy were
also tested.
The chemical composition of the corrosion layer was
analyzed by the XRD. The characteristic diffraction line
for ␣-PbO
2
was 2θ = 28.58
◦
and those for -PbO
2
are
2θ = 25.42
◦
and 2θ = 31.94
◦
. Intensity ratio of ␣-PbO
2
peak
to sum of those of ␣-PbO
2
and -PbO
2
was calculated as
Ip
28.58
◦
/[Ip
28.58
◦
+ (Ip
25.42
◦
+Ip
31.94
◦
)/2]. The PAM was taken
off the sample electrode, the current collector with corrosion
layer on the surface was washed by distilled water, and the XRD
of the surface was measured.
4.2. Results and discussion
The changes of the cell voltage at the end of discharge
during cycling are shown in Fig. 10. The discharge volt-
age quickly decreased after only 35 cycles for the cell of
Pb–0.06%Ca–1.5%Sn alloy current collector, although it did not
decrease for the cells of both the Pb–3%Sb–0.25%As and the
Pb–1%Ca alloy current collector. PCL was prevented on these
types of alloy.
Examples of the XRD charts of the current collector sur-
face after taking the PAM off are shown in Fig. 11. It shows
the composition of the corrosion layer after the formation
before the cycle test. The peak intensity for metal lead (m-
Pb) on Pb–0.06%Ca–1.5%Sn was higher than on Pb–1%Ca
or on Pb–3%Sb–0.25%As compared with peaks for PbO
2
.
This tendency was also observed in Fig. 8, on the elec-
Fig. 10. Change in the end-of-discharge voltage of 300mAh cells during PCL
pattern cycle of the pasted tablet PAM cells. Composition of current collector
alloy was Pb–0.06%Ca–1.5%Sn (), Pb–1%Ca (), and Pb–3%Sb–0.25%As
().
trode surface after curing before formation. It means that
Pb–0.06%Ca–1.5%Sn alloy corrodes less than Pb–1%Ca or
on Pb–Sb not only in cured positive electrodes but also in
formed ones in cells. The changes in ␣-PbO
2
peak intensity
Fig. 11. X-ray diffraction pattern of surface of current collector surface of; (a)
Pb–0.06%Ca–1.5%Sn; (b) Pb–1%Ca; (c) Pb–3%Sb–0.25%As; after taking the
PAM off after PCL pattern cycle test.
K. Sawai et al. / Journal of Power Sources 179 (2008) 799–807 805
Fig. 12. Change in peak intensity ratio of ␣-PbO
2
to (␣-PbO
2
+ -PbO
2
)ofthe
XRD, calculated as Ip
28.58
◦
/[Ip
28.58
◦
+ (Ip
25.42
◦
+Ip
31.94
◦
)/2] of current collector
surface after taking the PAM off. Composition of current collector alloy was
Pb–0.06%Ca–1.5%Sn (), Pb–1%Ca (), and Pb–3%Sb–0.25%As ().
ratio to (␣-PbO
2
+ -PbO
2
) peak intensity of the XRD, calcu-
lated as Ip
28.58
◦
/[Ip
28.58
◦
+ (Ip
25.42
◦
+Ip
31.94
◦
)/2] are shown in
Fig. 12. Before cycling, the ␣-PbO
2
peak intensity ratio for
Pb–0.06%Ca–1.5%Sn was almost the same as that for Pb–1%Ca
and was less than that for Pb–3%Sb–0.25%As. It means that ␣-
PbO
2
is relatively stable on Pb–Sb alloy before cycling, and that
-PbO
2
tends to be formed on Pb–Ca (–Sn) alloy under these
conditions.
The peak ratio of ␣-PbO
2
to -PbO
2
significantly decreased
only for the Pb–0.06%Ca–1.5%Sn alloy electrode during
cycling. On the other hand, the ␣-PbO
2
peak intensities for
Pb–3%Sb–0.25%As alloy electrode held constant, and that for
Pb–1%Ca alloy was increased during cycling. More stable phase
of PbO
2
tends to increase by oxidation and reduction reaction
during cycling on the current collector. Therefore, -PbO
2
is
increased on Pb–0.06%Ca–1.5%Sn alloy and is not increased
on Pb–3%Sb–0.25%As alloy. On Pb–1%Ca alloy, it is assumed
that ␣-PbO
2
become stable because H
2
SO
4
concentration on the
surface becomes lower, perhaps caused by its thick oxide layer
and tighter adhesion at the interface.
It is well known that a Pb–Sb alloy positive grid can suppress
PCL phenomenon. This might causes that the amount of ␣-PbO
2
in the corrosion layer on a Pb alloy grid did not decrease with
the number of cycles.
As a result of these tests, it was found that Pb–1%Ca alloy
current collector could prevent PCL, because of its increasing
composition of ␣-PbO
2
in the corrosion layer during the cycles.
It might be caused by its thick oxide layer and tighter adhesion
at the interface.
5. Battery tests
It has become clear that it is effective for PCL prevention
to apply Pb–1%Ca alloy to the positive grid for tight adhesion
between the PAM and grid. Therefore, it was demonstrated in
battery tests. It is difficult to apply this type of alloy to the
positive grid by casting. It is because that Pb–1%Ca alloy is
highly corrosive in sulfuric acid, so the battery life will be con-
trolled by grid corrosion before PCL phenomenon. Therefore,
the alloy technology was applied to expanded grid by laminat-
ing Pb–1%Ca foil on the Pb–0.06%Ca–1.5%Sn alloy thick cast
sheet and rolling it to thin sheet for expanding.
5.1. Experimental
5.1.1. Test cell
2 V 8 Ah (5 hR) valve regulated cells were assembled with
four positive plates and five negative plates and AGM sepa-
rator. Electrolyte was 5.65 M (specific gravity 1.32 at 20
◦
C)
H
2
SO
4
.
The types of the positive plates are shown in Table 2. Each
positive expanded grid was designed in the same size and mass.
The positive active material of 3.7 g cm
−3
density was filled by
the same mass for each type of grid.
The positive grids for the cell No. 2 were prepared as follows.
Pb–1%Ca foil was laminated on the Pb–0.06%Ca–1.5%Sn alloy
thick cast sheet and rolled with the cast sheet to thin sheet. The
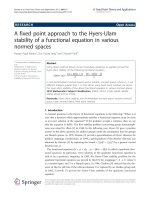
rolled sheet was expanded to the grid form, shown in Fig. 13(a).
Fig. 13(b) shows the photograph of the cross section of the
grid. Pb–1%Ca foil was laminated on the grid surface in 20 m
thick.
The positive grids for the cell No. 3 were prepared by the
same way as the cell No. 2, but Pb–1.2%Sb–0.25%As alloy was
chosen for laminated foil. The Sb content was set at as low as
1.2%, because Sb would lower the cell performance if the Sb
content was high in VRLA battery.
5.1.2. Test regime
First, initial discharge capacity of each cell was checked. The
cells were discharged at 1/3 CA (2.7 A) at 25
◦
C. The end of dis-
charge voltage was set at 1.7 V. Then, the cells were tested under
constant current charge–discharge cycle conditions at 50
◦
C.
Cycle regime was designed to enhance PCL phenomenon. It
is as follows.
Discharge: 1.5 A × 1.5 h (28% DOD).
Charge: 1.5 A × 1.2 h + 0.25 A × 5 h (135%).
Rest: 6 h.
Table 2
The test cell structure for PCL pattern life test
Cell No. Positive grid type Positive grid alloy Negative grid type Negative grid alloy
1 Expanded Pb–0.06%Ca–1.5%Sn Cast Pb–Ca–Sn
2 Expanded Pb–1%Ca foil laminated on Pb–0.06%Ca–1.5%Sn Cast Pb–Ca–Sn
3 Expanded Pb–1.2%Sb–0.25%As foil laminated on Pb–0.06%Ca–1.5%Sn Cast Pb–Ca–Sn
806 K. Sawai et al. / Journal of Power Sources 179 (2008) 799–807
Fig. 13. Photographs of (a) expanded positive grid for 2 V 8 Ah test cell and (b) cross section of the positive grid surface laminated with Pb–1%Ca foil.
2.7 A discharge capacity was checked at 25
◦
C, at the 29th, 65th
and 105th cycle of the charge–discharge cycle. The cells were
charged at 0.8 A to 135% of discharged capacity.
5.2. Results and discussion
Fig. 14 shows the cell capacity change with PCL charge–
discharge cycles. The initial capacity of each cell was almost
the same. The cell No. 1, Pb–0.06%Ca–1.5%Sn positive grid
without laminated foil, lost the capacity at the 29th cycle by
PCL. The cell No. 3 with Pb–1.2%Sb–0.25%As laminated foil
had longer life than the cell No. 1, but was deteriorated by PCL at
the 105th cycle. On the other hand, the cell No. 2 with Pb–1%Ca
laminated foil lived longer life than 105 cycles and showed an
excellent durability against PCL.
Fig. 14. Change in the capacity of 2 V 8 Ah cells during PCL pattern cycle.
Discharge current was 2.7 A (3 CA), end of discharge voltage was 1.7 V. The
positive grid was Pb–0.06%Ca–1.5%Sn without laminate (), Pb–1%Ca foil
laminated (), and Pb–1.2%Sb–0.25%As foil laminated ().
It was found that the positive grids with Pb–Ca alloy lam-
inated foil can prevent cycle use batteries from PCL and give
them longer life.
6. Conclusions
(1) PCL occurs when the adhesion between the grid and the
PAM is poor, the H
2
SO
4
concentration at the interface
between the grid or the PAM is high and the corrosion layer
mainly consists of -PbO
2
.
(2) Pb–1%Ca alloy as well as Pb–Sb alloy can make the adhe-
sion tight between the PAM and grid in the positive plates
after curing.
(3) Pb–1%Ca alloy current collector could prevent PCL,
because of its increasing composition of ␣-PbO
2
in the cor-
rosion layer during the cycles. It might be caused by its thick
oxide layer and tighter adhesion at the interface.
(4) The beneficial effect of Pb–1%Ca alloy grid on PCL was
confirmed also in the battery cycle test. Ca ion does not
lower the hydrogen overpotential at the negative electrode,
resulting in less water loss in battery than Sb ion. Therefore,
it can be applied to cycle use batteries.
References
[1] G. Karlsson, Proceedings of the 21st International Telecommunication
Energy Conference, Copenhagen, Denmark, 6–9 June, 1999, pp. 21–23.
[2] M. Shiomi, Y. Okada, Y. Tsuboi, S. Osumi, M. Tsubota, J. Power Sources
113 (2003) 271.
[3] A.F. Hollenkamp, J. Power Sources 36 (1991) 567.
[4] M.K. Dimitrov, D. Pavlov, J. Power Sources 46 (1993) 203.
[5] Y. Okada, K. Takahashi, M. Tsubota, Proceedings of the 11th International
Electric Vehicle Symposium, Florence, Italy, 27–30 September, 1992, p.
6.01.
[6] S. Laihonen, T. Laitinen, G. Sundholm, A. Yli-Pentti, Electrochim. Acta
35 (1990) 229.
[7] D. Berndt, Maintenance-Free Batteries, second ed., Wiley, 1997.
[8] D. Pavlov, G. Petkova, M. Dimitrov, M. Shiomi, M. Tsubota, J. Power
Sources 87 (2000) 39.
K. Sawai et al. / Journal of Power Sources 179 (2008) 799–807 807
[9] M. Dimitrov, D. Pavlov, J. Power Sources 93 (2001) 234.
[10] M. Kosai, S. Yasukawa, S. Osumi, M. Tsubota, J. Power Sources 67 (1997)
43.
[11] M. Tsubota, S. Osumi, M. Kosai, J. Power Sources 33 (1991) 105.
[12] A. Winsel, E. Voss, U. Hullmeine, J. Power Sources 30 (1990) 209.
[13] W. Borger, U. Hullmeine, H. Laig-Horstebrock, E. Meissner, in: T. Keily,
B.W. Baxter (Eds.), International Power Sources Symposium Committee,
Power Sources, vol. 12, Leatherhead, UK, 1989, p. 131.
[14] E. Meissner, J. Power Sources 46 (1993) 231.
[15] M. Calabek, K. Micka, P. Baca, P. Krivak, V. Smarda, J. Power Sources 64
(1997) 123.
[16] B.K. Mahato, J. Electrochem. Soc. 126 (1979) 365.
[17] B. Monahov, D. Pavlov, J. Electrochem. Soc. 141 (1994) 2316.
[18] M. Shiota, Y. Yamaguchi, Y. Nakayama, N. Hirai, S. Hara, J. Power Sources
113 (2003) 277.
[19] D. Pavlov, J. Power Sources 46 (1993) 171.
[20] M. Metikos-Hukovic, R. Babic, S. Brinic, J. Power Sources 64 (1997)
13.
[21] D. Pavlov, J. Electrochem. Soc. 139 (1992) 3075.
[22] T. Rogachev, J. Power Sources 23 (1988) 331.
[23] P. Ruetschi, B.D. Cahan, J. Electrochem. Soc. 104 (1957) 406.
[24] S. Ikari, S. Yoshizawa, S. Okada, Denki Kagaku 27 (1959) 552.